 Published by Sascha Neumeier
Last updated on January 12, 2023
•
16 minute read
For the past two years, I have started our annual reviews with the following quote:
“Wow. 2020 was quite a hell ride for all of us! And I don't just mean us at Paessler, but really all of us. The whole planet experienced a rather exceptional year!“
I hope you came through this time resilient, thoughtful and with a positive, future-oriented mindset. ❤️ Speaking of positives, I'm going to show you how we've progressed with Paessler PRTG over the past 12 months.
Paessler PRTG Highlights 2022
An important part of this year's development work was the improvement of features and security.
In total we released 8 brand new stable releases of Paessler PRTG. For each of these releases, we shared very detailed release notes with you. All details can be found on the page PRTG Release Notes.
There you will find a clear summary of new features, product and feature enhancements and security optimizations.
The release notes also show you what's going on with our Lab products 🧪.
We currently have several products and tools that are still going through the development process as alpha or beta but which will soon be available as a stable product on the market.
Before I tell you more about that, let's first look at what's been happening with the sensor types in PRTG.
For a better overview, here's a table of contents:
- Sensor types everywhere
- Industrial use cases and OPC UA notifications
- Okta Single Sign On
- New User Interface and API v2 for Paessler PRTG
- The Multi-Platform Probe (the Linux thingi)
- PRTG Desktop
- Plans for 2023
Sensor types everywhere
The sensor types below are new to PRTG, and you can install them in your production systems even if you don't have our Experimental Features feature enabled.
The Amazon Web Services package

There are a lot of new sensor types available for AWS, namely: AWS Alarm v2, AWS EBS v2, AWS EC2 v2, AWS ELB v2 and AWS RDS v2.
Check the blog articles below for a detailed summary of the new features:
👉 Monitoring your AWS environment with PRTG - The sensor types
👉 Hands-on guide on how to setup your AWS monitoring in PRTG
HPE 3PAR
 To help you keep an eye on your HPE 3PAR environment, you can now rely on the HPE 3PAR Drive Enclosure and HPE 3PAR Virtual Volume sensor types.
For insights on the sensors, see these articles:
👉 Let’s talk about sensors! HPE 3PAR Storage Server monitoring
👉 How to easily add and use HPE 3PAR sensors in PRTG
Redfish
![]() Redfish is the official successor of IPMI (Intelligent Platform Management Interface) for managing servers over the network. You may have already heard about these sensors. By now, the sensors have left the cozy beta program, ready to be deployed even on the most sensitive production systems.
Redfish is the official successor of IPMI (Intelligent Platform Management Interface) for managing servers over the network. You may have already heard about these sensors. By now, the sensors have left the cozy beta program, ready to be deployed even on the most sensitive production systems.
Read more about the Redfish System Health and the Redfish Power Supply Sensor here:
👉 Let’s talk about sensors! Monitoring with PRTG Redfish sensors
👉 All about Redfish and how to easily add the sensors in PRTG
More sensor gems
 If you have a Rittal cabinet in your server room, you might be interested in our SNMP Rittal CMC III Hardware Status Sensor. Concerning the topic of Rittal and data centers, we also prepared some information for you this year. I can especially recommend this article from Simon:
👉 PRTG & Rittal – Empowering data center facilities teams
The best way to monitor your Fortinet Fortigate firewalls is with our Fortigate System Statistics Sensor. Jasmin shows you in his blog article exactly how to do this.
👉 Monitoring FortiGate Firewalls with Paessler PRTG
 To keep an eye on your Microsoft 365 mailboxes, we provide a dedicated Microsoft 365 sensor.
In October 2022 Microsoft removed the ability to use Basic authentication in Exchange Online for Exchange ActiveSync (EAS), POP, IMAP, Remote PowerShell, Exchange Web Services (EWS), Offline Address Book (OAB), Outlook for Windows, and Mac.
Our developers updated the Microsoft 365 Sensor early, so that you can seamlessly monitor your Microsoft 365 environment even after the shutdown of basic authentication.
We have also published an article about this:
👉 Exchange Online and Paessler PRTG: From basic to modern authentication
Industrial use cases and OPC UA notifications
Customers have now been using PRTG in manufacturing environments for a few years, and we were able to find some cool use cases. One industrial customer uses PRTG to monitor its Automated Guided Vehicles - and by extension, their industrial wireless LAN. Meanwhile, another customer uses PRTG to ensure that their Operational Technology devices are up and running - check out the blog post and video here.
Plus, we extended the industrial functionality of PRTG by adding the ability to send notifications to northbound systems that run on OPC UA (like certain SCADA or Distributed Control Systems).
Okta Single Sign On
 Since Paessler PRTG Release 22.2.76 you can use Okta as provider for single sign-on (SSO) to login to PRTG with multi-factor authentication. Okta is the second SSO provider that you can integrate with PRTG.
Azure Active Directory (Azure AD) is available since PRTG 21.2.68. You can choose the SSO provider that you work with in the system administration of PRTG and configure the settings for your SSO access.
i Please note that this feature is only available for Paessler PRTG Network Monitor, not for Paessler PRTG Hosted Monitor.
Somethings brewing. A look inside our Lab 🧪
Throw on a white coat, put on your safety goggles, because we're going into the lab! There's a lot of program code around that's growing into new features or full-blown products.

New User Interface and API v2 for Paessler PRTG
Most likely you have already read here on the blog that we are busy equipping Paessler PRTG with a completely new UI. This comes directly with the PRTG API v2. Both UI and API run on a PRTG Application Server, invisible in background.
👉 Taking the Paessler PRTG API to the next level
👉 Paessler PRTG brings an entirely new user experience with a brand new UI
👉 Paessler PRTG offers a brand new Restful API alongside a new UI
Through modularization and enormous innovation work, we are making Paessler PRTG as modern and innovative as ever before.
You can now activate the new UI and PRTG API v2 in your production environment
The PRTG Application Server powers the new UI and the API v2. Until now we recommended that you should only activate the PRTG Application Server on test systems because we wanted to ensure a basic level of stability.
With Paessler PRTG version 22.4.81 that we released in December, we have now reached the necessary milestone that allows you to activate the shiny new UI and the API v2 on your production system without worrying. 😍
Recent UI and API changes
In the PRTG API v2 you now have access to historical data for graphs and we provide you with an API key. Next, we'll take care of enabling you to create and edit devices, probes, groups, and sensors directly through the API.
We are also working on declaring the first set of API endpoints as stable. By finishing this task, we will ensure the API won’t break with future updates and you are ready to build your integrations for production environments. We’ll let you know as soon as we reached this milestone.
The new UI comes with new graphs that allow you to zoom and scroll through your data. The graphs include a hover function which allows you to consume details even faster. In addition to the familiar stacked graphs, we also offer split graphs. With the split graphs, there is one graph per channel, but zoom, scroll and hover is applied to all of them in the same way. The screenshot below says more than a thousand words.
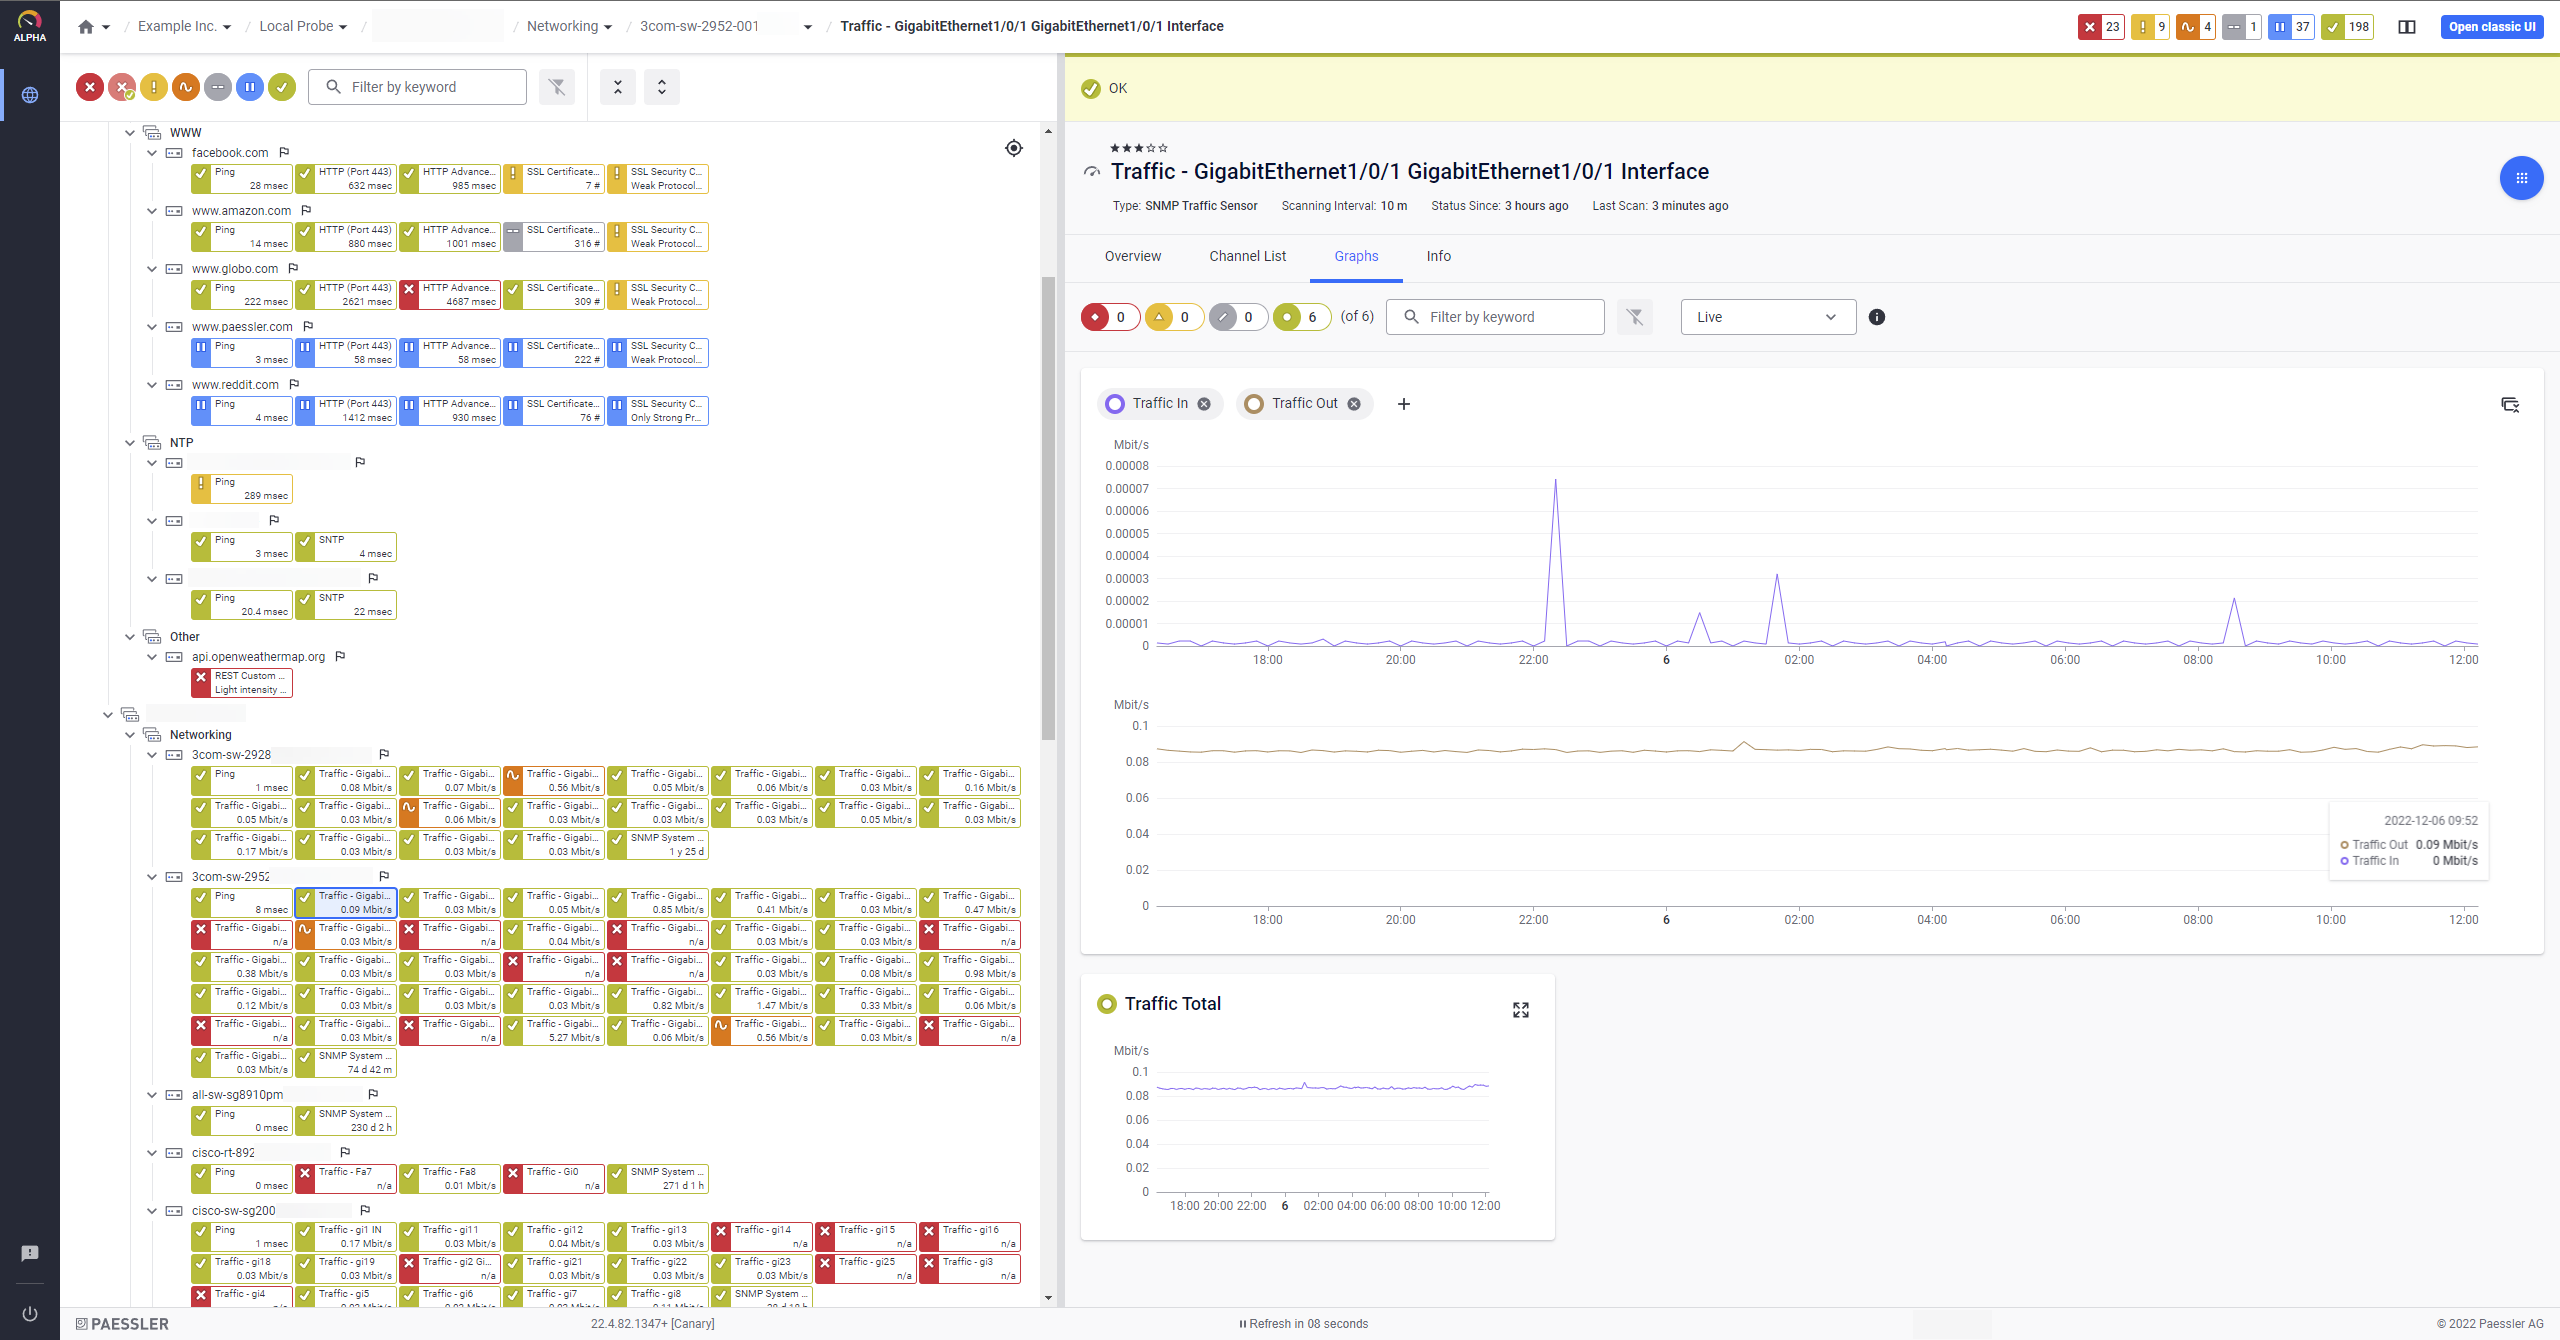
This is how the graphs look like in the new Paessler PRTG UI
The interface now provides a split screen function. With split screen we enable you to navigate through your monitoring objects much faster. When you click on an object in the device tree, the tree remains visible, and you can see the details of this object on the right side. It is possible to customize where the screen splits, and you can collapse a page completely if you want.
There’s also a new sensor and device overview. There we have put the focus on showing the user as simply and quickly as possible what the current state of the object is and why.
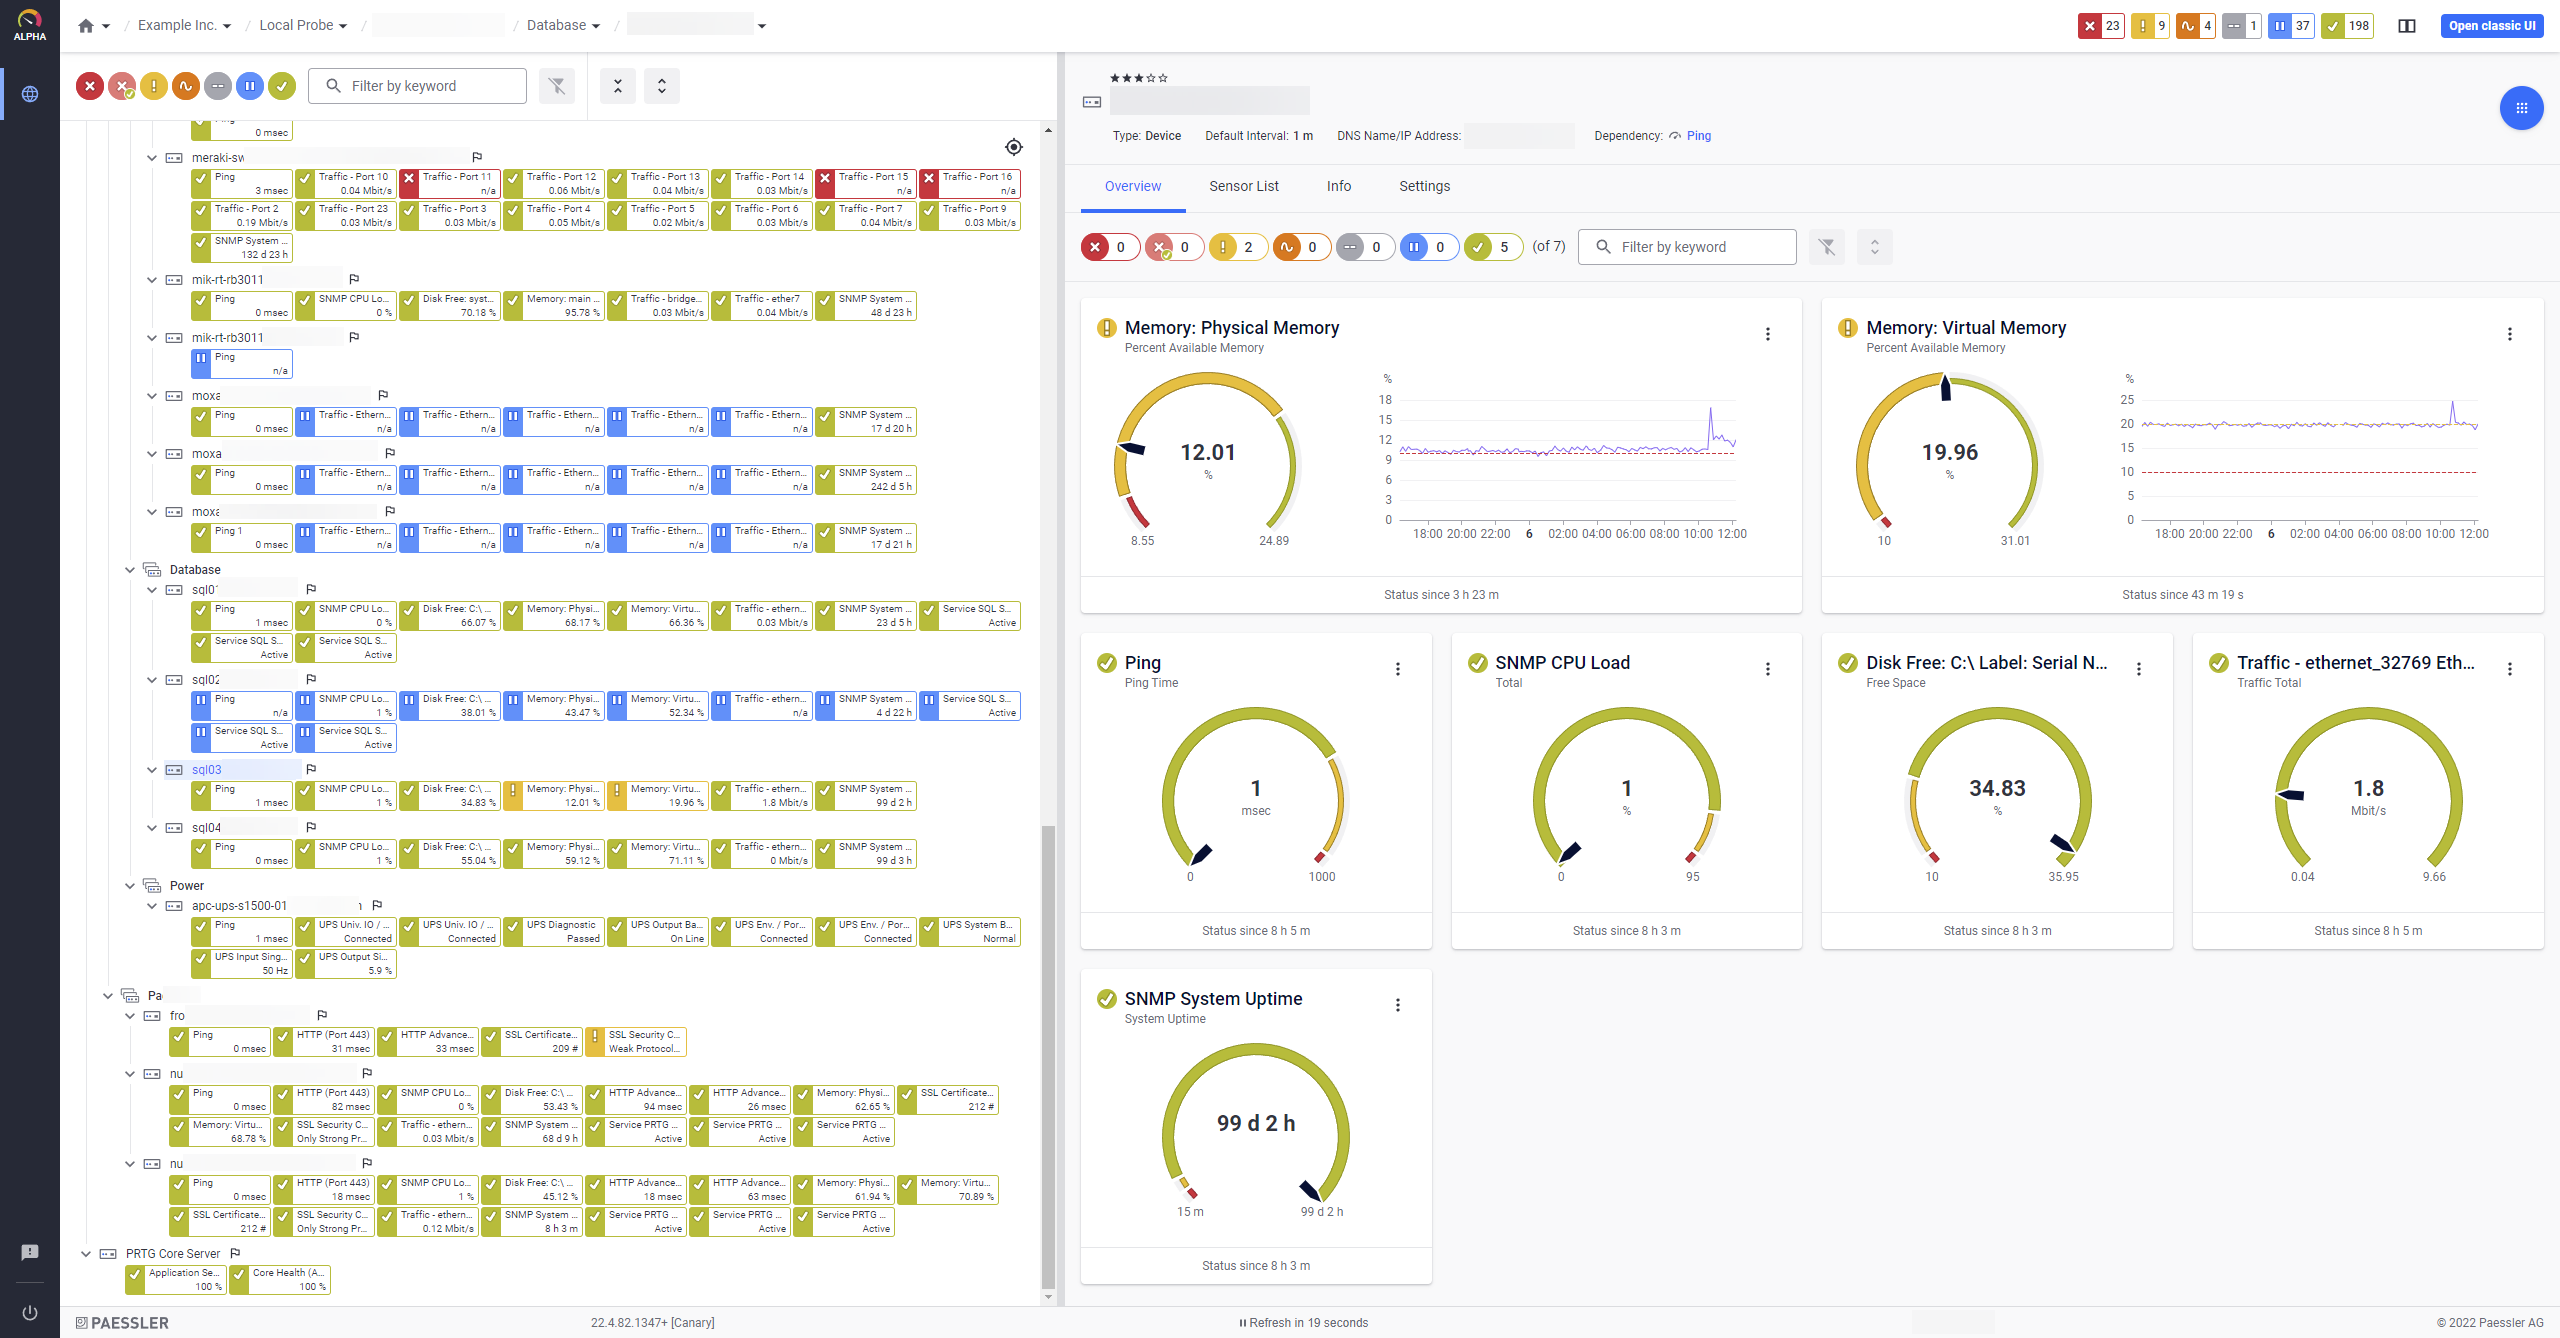
Device overview in the new Paessler PRTG UI
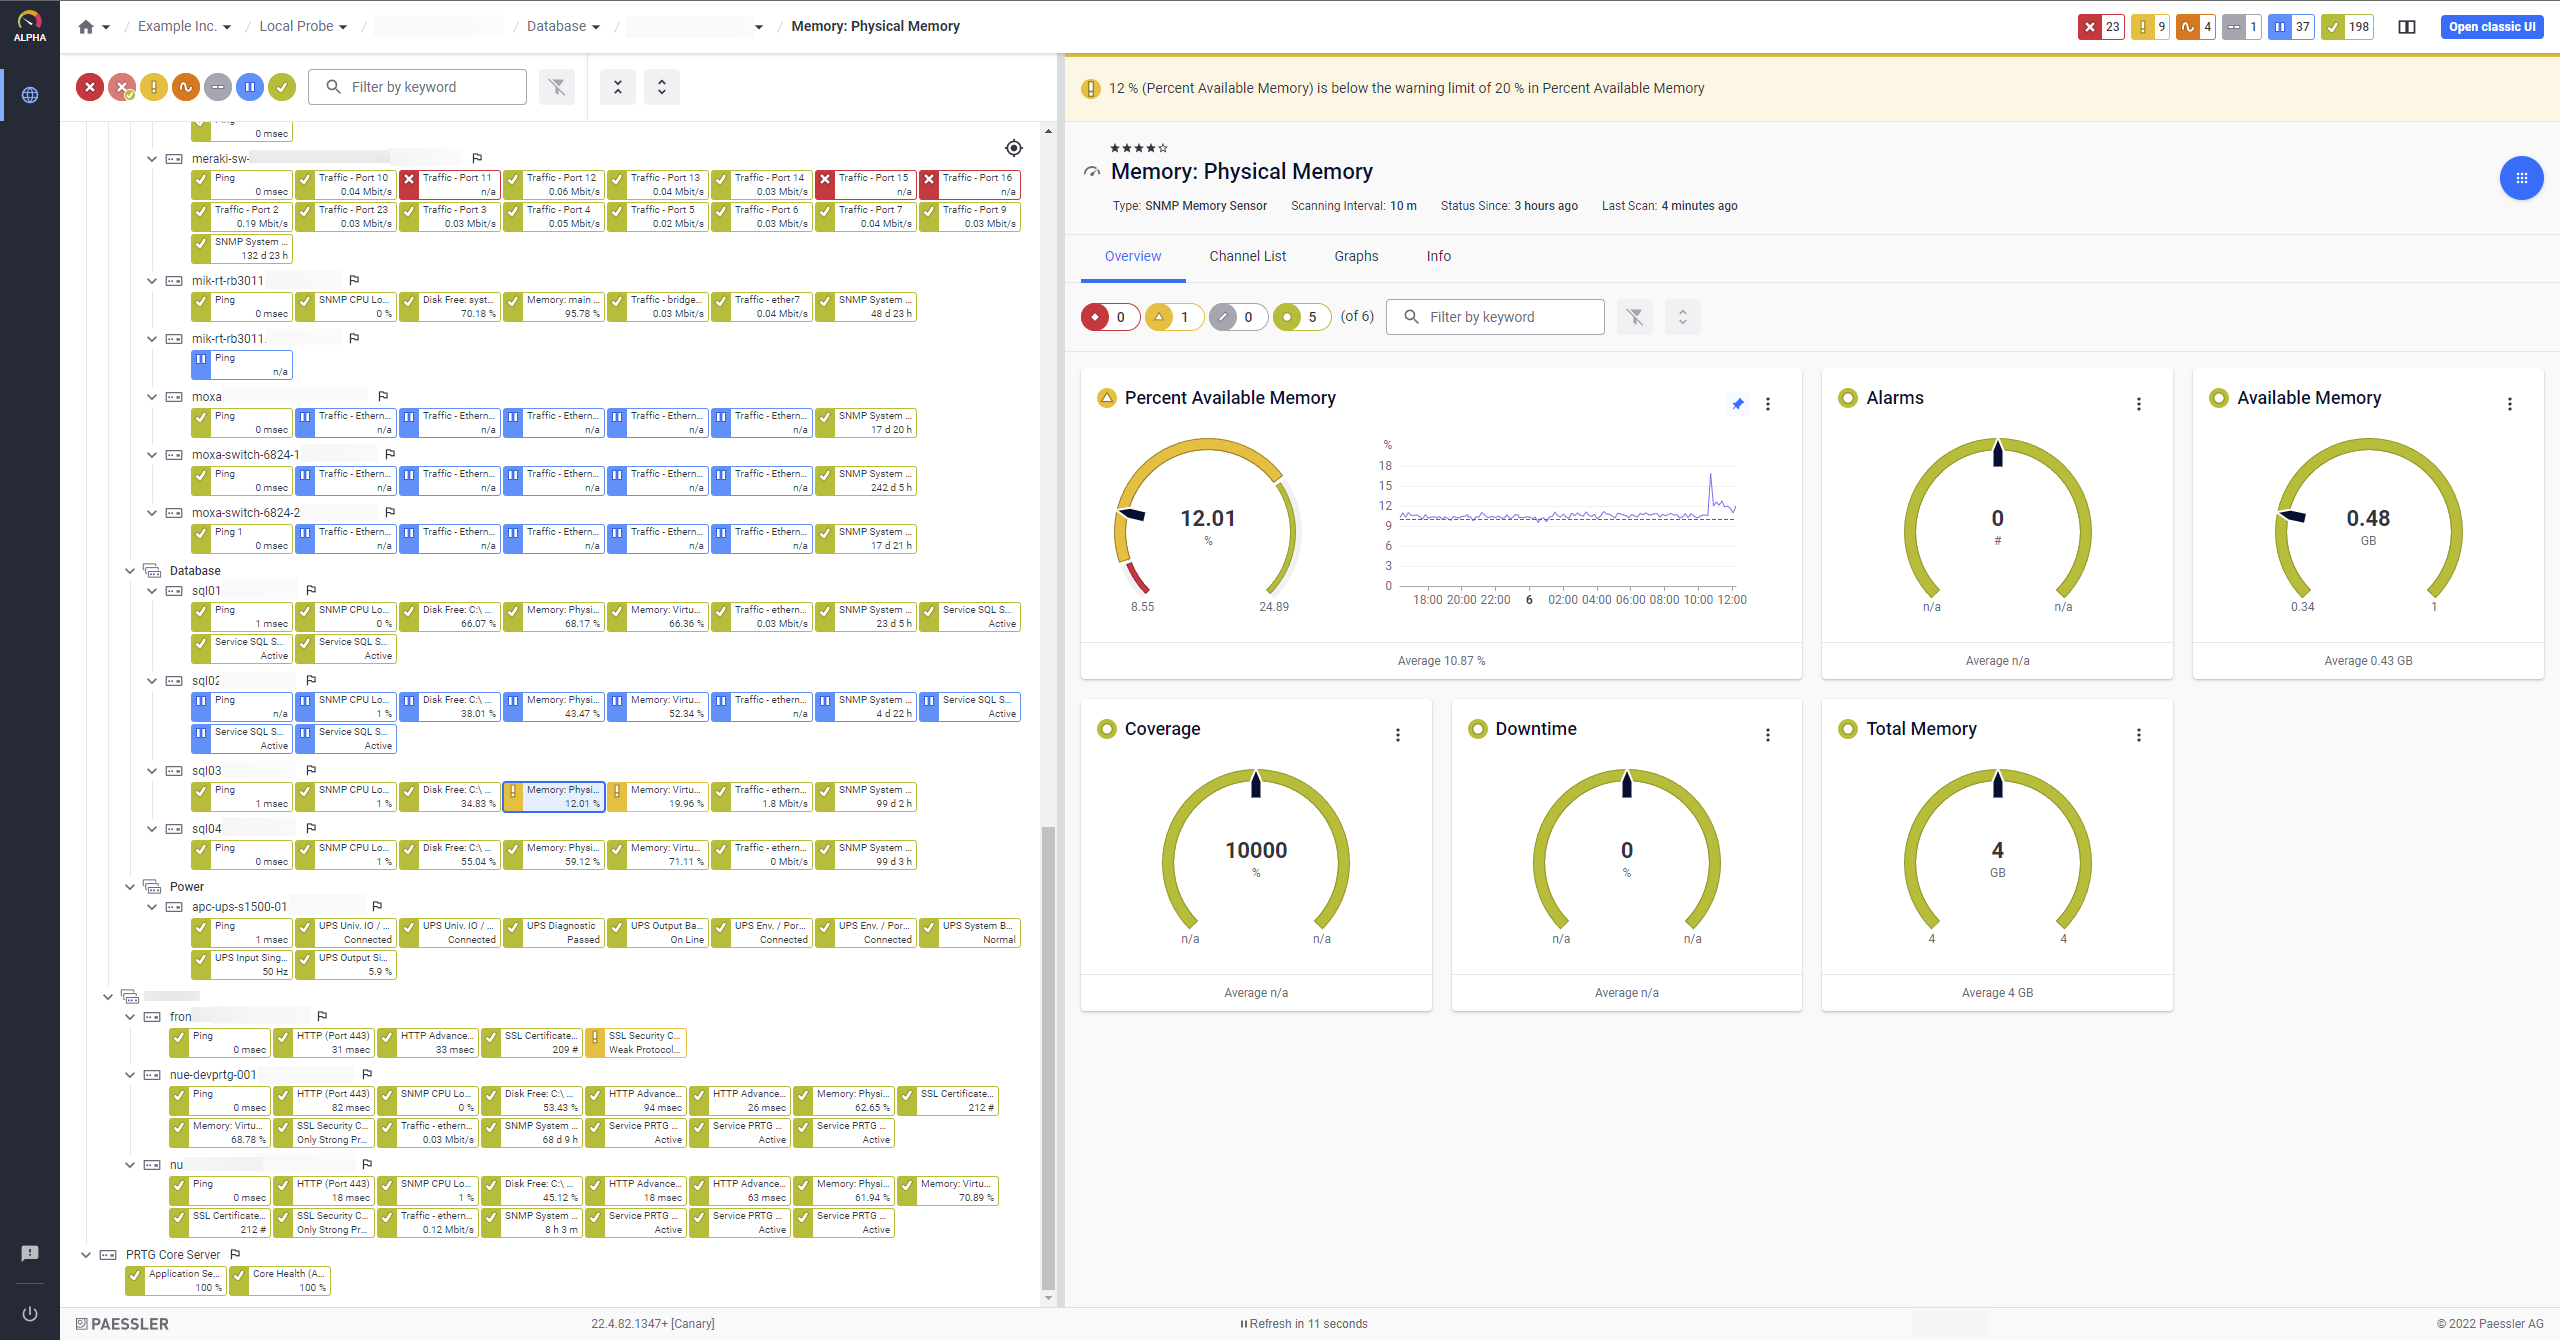
Sensor overview in the new Paessler PRTG UI
Our devs are also working busily on the display of sensor channel details with new visualization to make it easier to see and understand limits. Then there is the new device list, the object info page and much more. Again, it makes sense to keep an eye on our blog to make sure you don't miss any of the new features.
The Multi-Platform Probe (the Linux thingy)
You have probably already tried out the Multi-Platform Probe, which you can install on Windows and Linux systems (Ubuntu, Debian, and CentOS) as well as on ARM-based devices and Docker. This allows the native monitoring function of PRTG to be extended to other platforms.
We added the support for ARM-based devices back in March. For more details check these blog articles.
👉 Have you already tried the Multi-Platform Probe?
👉 The Multi-Platform Probe now supports ARM based devices
With the current release of Paessler PRTG, we have introduced the HTTP v2 Sensor and the Ping v2 Sensor.
The HTTP v2 sensor allows you to send a HTTP request (HEAD, GET or POST) and use placeholders, similar to the REST Custom v2 sensor.
The Ping v2 sensor keeps the basic ping settings to send one single ping or send multiple ping requests and comes with a new setting Inverted Error Status. If you select Enable for this new setting, the sensor shows a Down status if the target device is reachable.
Both HTTP v2 sensor and Ping v2 sensor work with the Multi-Platform Probe. More on this on our Paessler PRTG Release Notes page. So don't wait, grab a Raspberry Pi lying around and test the Multi-Platform Probe together with our new sensors. 😃
PRTG Desktop
Who of you manages their PRTG environment (also) with our Paessler PRTG Desktop? You can run PRTG Desktop on Windows, Mac or Linux. 🤩
Get a short insight into PRTG Desktop here
👉 Centrally manage one or more PRTG installations with PRTG Desktop
👉 5 features you should know about PRTG Desktop
Some of the newly added features are:
Probe Transfer ♨️
It clones probes from the source system to the target system. Probes on the source system are paused so that you do not lose any historic data.
We are looking into extending this feature to cover more than just the probe configuration in the future.
Multi Server Overview ♨️
Discover the new Multi Server Overview feature under Servers | Multi Server | Overview where you can find and manage the device trees of all your configured PRTG servers in a single view.
Please note this feature is only available for users with two or more PRTG sever connections.
Configuration Viewer ♨️
You can now compare PRTG configurations from local and remote servers outside the probe transfer process with the preview feature Configuration Viewer.
* Note that by now the features marked with ♨️ are experimental features and that we might change or remove them from PRTG Desktop at any time.
Plans for 2023, anyone?
Well, at least WE have a lot! Just before Christmas, we updated our PRTG public roadmap. Seems our product managers are planning some pretty neat stuff for next year! 🧐
And most important: Please give us as much of your feedback as possible! You have the opportunity to influence further development and feature implementation!
You rock ❤️!
Riiight! Also at the end of the article, the previous year's article repeats itself! You are still awesome! Because as sysadmins and IT managers, you help keep the IT infrastructures around the globe up and running. Because in my opinion you have made a good choice for monitoring with PRTG. 😉 Because you contribute with your feedback, and also with some critical words, so that we can continuously make PRTG even better. And because you let us know that you love PRTG as much as we do. Thank you! We at Paessler are excited about a great 2023 together!


