Published by Sascha Neumeier
Last updated on December 16, 2025
•
13 minute read
Before we get started, this is part 1 of our two-part series on monitoring AWS environments with PRTG. Whether you're managing a handful of EC2 instances or a complex multi-region AWS infrastructure with microservices, serverless functions, and containerized workloads, comprehensive AWS monitoring is critical for maintaining performance, controlling costs, and ensuring optimal end-user experience.
If you want to skip directly to the hands-on setup guide, just click below.
Part 1 | The Sensor types
Paessler PRTG includes six different sensor types for monitoring your Amazon Web Services (AWS) environment.
It's been a while since I last reviewed new sensors here on the blog. Our developers have been putting significant effort into programming new sensor types for Amazon Web Services (AWS) over the last months. These sensors provide real-time monitoring and observability across your entire AWS environment, helping you track performance metrics, optimize cloud resources, and troubleshoot issues before they impact your business.
I have split the topic into two parts. The first part covers the new AWS sensor types in PRTG, including their features and benefits for monitoring your cloud infrastructure. In part two, I'll show you how to set up the new sensors in PRTG and what you need to consider when configuring AWS account permissions and credentials for seamless integration.
These six AWS monitoring sensors work together to provide full-stack visibility across your Amazon Web Services deployment. Let's explore each sensor type:
- AWS Alarm v2
- AWS Cost
- AWS EBS v2 (Elastic Block Store)
- AWS EC2 v2 (Elastic Compute Cloud)
- AWS ELB v2 (Elastic Load Balancing)
- AWS RDS v2 (Relational Database Service)
At this point in time, one or more of the AWS sensors are still in a Beta state. Since PRTG version 21.1.65, you can enable the Experimental Features setting Beta Sensors. This makes it possible for you to try out upcoming features fresh from our labs and to provide us early feedback. To learn more about our Experimental Features setting, check out our article New handling of beta sensors in PRTG Network Monitor.
Apart from the AWS Cost Sensor (which has been recently developed anyway) all other sensor types have been fundamentally revised and you can recognize them by the suffix "v2". All our AWS sensor types are based on the newest version of the CloudWatch SDK.
We also changed the standard scan interval of the sensors from 15 minutes to 5 minutes. This leads to more frequent updates so that the sensors collect more recent data. You can read about all the sensor-specific innovations below.
AWS Alarm v2 Sensor
The AWS Alarm v2 Sensor replaces the AWS CloudWatch Alarm Sensor
The AWS Alarms feature allows you to monitor CloudWatch metrics and receive notifications when metrics fall outside the thresholds you configure. This enables you to set up automated alerts based on performance issues, cost anomalies, or resource utilization patterns across your AWS services. You can attach multiple alarms to each metric and each one can have multiple actions. If you're interested in more technical details, the AWS News Blog is at your service.
The AWS Alarm v2 Sensor monitors metric and composite AWS alarms by reading data from Amazon CloudWatch in real-time, giving you centralized visibility into alarm states across your entire AWS environment. It will be the successor of the existing Amazon CloudWatch Alarm sensor. The sensor details show the respective alarm status. (PRTG Manual AWS Alarm v2)
Why this matters: When managing complex AWS deployments with multiple services like Lambda, ECS, or EKS, you need a unified monitoring solution that aggregates alarm data from CloudWatch without forcing you to navigate multiple AWS console screens. PRTG brings all your AWS alarms into a single dashboard alongside your on-premises infrastructure monitoring.
Channel-specific differences
While the old sensor monitored the state of alarm, the new sensor can distinguish between composite and metric alarms and monitor them independently.
- Channels of sensors that monitor composite alarms:
- a) Alarm state (also existed in old sensor) shows the overall state of alarms
- b) Composite alarm can have multiple additional channels, one for each alarm it is comprised of.
- Channels of sensors that monitor metric alarms:
- a) Alarm state (also existed in old sensor) shows the overall state of alarms
- b) One additional channel that shows the value of the metric on which the alarm was set
AWS Cost Sensor
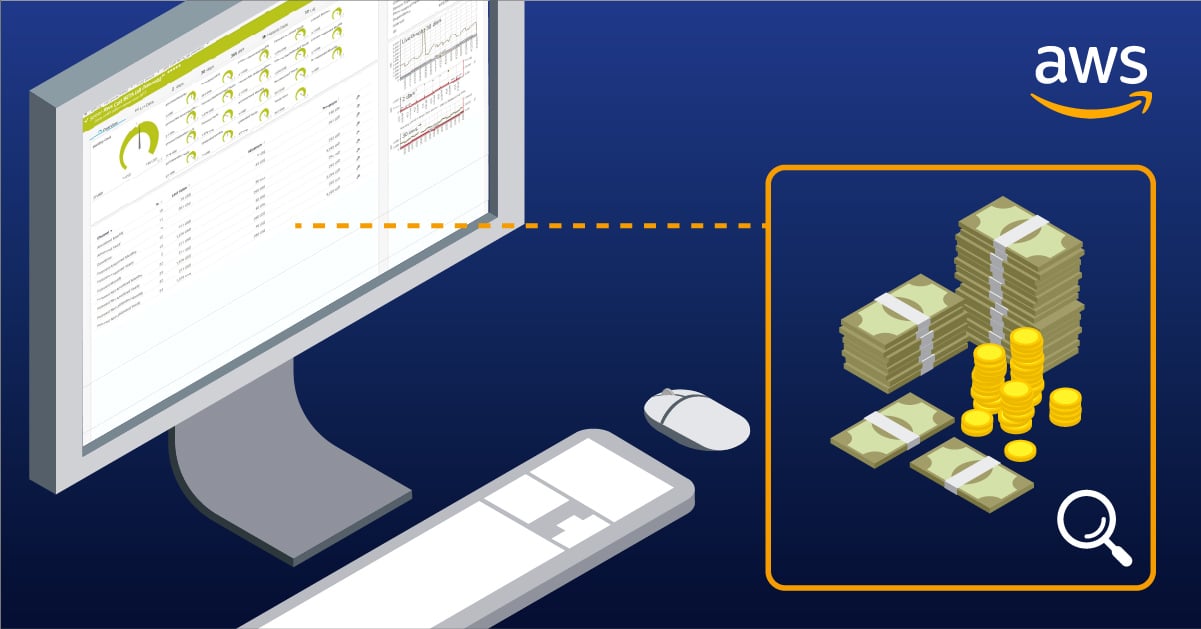
The AWS Cost Sensor in PRTG shows the monthly and yearly costs of an AWS account, as well as cost forecasts. With AWS pricing varying significantly across regions, instance types, and services, this sensor helps you track spending patterns and set up proactive alerts before costs spiral out of control. This helps you to keep an eye on your company's AWS account spending, as well as on the spending for single purpose AWS accounts. With channel limits, the sensor can individually notify you if your AWS account costs become too high (PRTG Manual AWS Cost).
The sensor is particularly valuable for organizations running multiple AWS accounts or managing complex cloud environments where costs can quickly escalate. You can monitor spending across compute resources (EC2 instances), storage (EBS volumes), databases (RDS), and serverless workloads (AWS Lambda) all from a single view.
Besides the included channels, you can optionally add additional types for costs and forecasts like:
- Unblended and net unblended costs, monthly and yearly
- Forecast for unblended and net unblended costs, monthly and yearly
- Amortized and net amortized costs, monthly and yearly
- Forecast for amortized and net amortized costs, monthly and yearly
This sensor has been available in PRTG for a while. For a detailed guide on monitoring AWS costs with PRTG, including setup instructions and best practices, check out our comprehensive article by expert Greg Campion.
AWS EBS v2 Sensor
The AWS EBS v2 Sensor replaces the AWS CloudWatch EBS Sensor
Amazon Elastic Block Store (EBS) is an easy-to-use, scalable, high-performance block-storage service designed for Amazon Elastic Compute Cloud (Amazon EC2). EBS volumes provide persistent storage for your EC2 instances, making performance monitoring critical for applications that depend on consistent disk I/O. It is commonly used to build your SAN in the cloud, run relational or NoSQL databases or right-size your big data analytics engines just to name a few use cases. Find out more on how it works at aws.amazon.com.
The AWS EBS v2 sensor monitors the status and performance of an AWS Elastic Block Store (EBS) volume and will be the successor of the existing Amazon CloudWatch EBS sensor.
The AWS EBS v2 sensor supports various metrics, including BurstBalance (Average), VolumeIdleTime (Sum), VolumeQueueLength (Average), VolumeReadBytes (Sum) and more. Find the full list here: PRTG Manual AWS EBS v2
Channel-specific differences
The new sensor provides two additional channels called 'Burst balance' and 'Volume state', with 'Volume state' being the primary channel of the sensor.
Key metrics to watch: The 'Burst balance' channel is especially important for gp2 and gp3 volumes, as it indicates whether your storage is consuming I/O credits faster than they're being replenished. Low burst balance can lead to performance degradation, affecting application performance and end-user experience. The 'Volume state' channel provides immediate visibility into whether your EBS volumes are healthy, in use, or experiencing issues.
We renamed these channels (old → new):
- Total read time → Average read latency
- Total write time → Average write latency
- Queue length → Average queue length
- Disk read → Read bandwidth
- Read Ops → Read Throughput
- Disk write → Write bandwidth
- Write ops → Write throughput
- Idle % → Time spent idle
The old channels 'Total read time' and 'Total write time' showed the sum of the values between two scans. We changed this, so the new channels 'Average read latency' and 'Average write latency' now show the average values between two scans.
AWS EC2 v2 Sensor
The AWS EC2 v2 Sensor replaces the AWS CloudWatch EC2 Sensor
Amazon Elastic Compute Cloud (Amazon EC2) is a web service that provides secure, resizable compute capacity in the cloud. As the foundation of most AWS deployments, EC2 instances require continuous monitoring to ensure optimal performance, track CPU and memory utilization, and identify potential bottlenecks before they impact your applications. It is designed to make web-scale cloud computing easier for developers. Find out more on how it works at aws.amazon.com.
The AWS EC2 v2 sensor monitors the status and performance of an AWS Elastic Compute Cloud (EC2) instance and will be the successor of the existing Amazon CloudWatch EC2 sensor.
The AWS EC2 v2 sensor is essential for monitoring both traditional virtual machines and containerized workloads running on EC2. Whether you're running web servers, databases, or microservices architectures, this sensor provides the performance metrics you need to optimize resource allocation, plan capacity, and maintain SLA compliance.
The AWS EC2 v2 sensor supports various metrics, including CPUUtilization (Average), DiskReadBytes (Sum), DiskReadOps (Sum), DiskWriteBytes (Sum) and more. Find the full list here: PRTG Manual AWS EC2 v2
Channel-specific differences
The new sensor provides one additional channel called 'Instance state', which is also the primary channel of the sensor.
We renamed these channels (old → new):
- CPU usage → CPU utilization
- Disk read → Disk read bandwidth
- Disk write → Disk write bandwidth
- Network in → Network in bandwidth
- Network out → Network out bandwidth
AWS ELB v2 Sensor
The AWS ELB v2 Sensor replaces the AWS CloudWatch ELB Sensor
AWS Elastic Load Balancing (ELB) is a load balancing service for Amazon Web Services (AWS) deployments. ELB automatically distributes incoming application and network traffic across multiple targets—including EC2 instances, containers, and IP addresses—and scales resources according to demand. Monitoring your load balancers is critical for ensuring high availability, tracking latency, and maintaining optimal end-user experience. Find out more on how it works at aws.amazon.com.
The AWS ELB v2 sensor monitors the status and performance of an AWS Elastic Load Balancing (ELB) load balancer and will be the successor of the existing Amazon CloudWatch ELB sensor.
Modern load balancing: The v2 sensor supports both Application Load Balancers (ALB) and Network Load Balancers (NLB), giving you comprehensive visibility into how traffic flows through your AWS infrastructure. This is particularly important for microservices architectures, containerized applications running on ECS or EKS, and serverless backends using AWS Lambda.
The AWS ELB v2 sensor supports various metrics, including ActiveConnectionCount (Sum), ConsumedLCUs (Average), HealthyHostCount (Average), HTTPCode_ELB_4XX_Count (Sum) and more. Find the full list here: PRTG Manual AWS ELB v2
Channel-specific differences
The new sensor provides one additional channel called 'Load balancer state', which is also the primary channel of the sensor.
We renamed these channels (old → new):
- Backend connection errors → Target connection error count
- HTTP 4xx (back end) → HTTP code target 4XX count
- HTTP 5xx (back end) → HTTP code target 5XX count
- HTTP 4xx (load balancer) → HTTP code ELB 4XX count
- HTTP 5xx (load balancer) → HTTP code ELB 5XX count
- Latency → Target response time
- Request count → Request count
- Healthy host count → Healthy host count
- Unhealthy host count → Unhealthy host count
AWS RDS v2 Sensor
The AWS RDS v2 Sensor replaces the AWS CloudWatch RDS Sensor
Amazon Relational Database Service (RDS) makes it easy to set up, operate, and scale relational databases in the cloud. The AWS RDS v2 sensor monitors the performance and health of your RDS database instances, tracking critical metrics like CPU utilization, database connections, storage capacity, and query performance. Find out more on how it works at aws.amazon.com.
The AWS RDS v2 sensor monitors the status and performance of an AWS Relational Database Service (RDS) database instance and will be the successor of the existing Amazon CloudWatch RDS sensor.
The AWS RDS v2 sensor supports various metrics, including BinLogDiskUsage (Average), BurstBalance (Average), CPUUtilization (Average), DatabaseConnections (Average) and more. Find the full list here: PRTG Manual AWS RDS v2
Channel-specific differences
The new sensor provides one additional channel called 'Database instance state', which is also the primary channel of the sensor.
We renamed these channels (old → new):
- CPU usage → CPU utilization
- Connections → Database connections
- Free storage → Free storage space
- Free memory → Freeable memory
- Swap usage → Swap usage
- Read latency → Read latency
- Write latency → Write latency
- Read throughput → Read throughput
- Write throughput → Write throughput
- Read IOPS → Read IOPS
- Write IOPS → Write IOPS
Why Monitor AWS with PRTG?
While Amazon CloudWatch provides native monitoring for AWS services, many organizations need a unified monitoring solution that bridges cloud and on-premises infrastructure. Here's why IT teams choose PRTG for AWS monitoring:
Unified visibility: Monitor your AWS resources alongside your on-premises servers, network devices, and applications in a single dashboard. No more switching between CloudWatch, your network monitoring tool, and separate application performance monitoring solutions.
Cost-effective: Unlike SaaS monitoring tools that charge per metric or per host, PRTG uses a straightforward sensor-based pricing model. Monitor your entire AWS environment without worrying about unexpected bills as your infrastructure scales.
Hybrid cloud support: If you're running workloads across AWS, Azure, Google Cloud, or maintaining on-premises infrastructure, PRTG provides centralized monitoring across all platforms. This is critical for organizations in the middle of cloud migration or operating hybrid cloud monitoring environments.
Customizable alerts and notifications: Set up intelligent thresholds based on your specific requirements. Receive notifications via email, SMS, push notifications, or integrate with your existing ITSM tools to automate incident response workflows.
No vendor lock-in: Your monitoring data stays in your control. PRTG can be deployed on-premises or in your own cloud environment, giving you full ownership of your monitoring infrastructure and historical data.
Conclusion
These six AWS sensors provide comprehensive monitoring coverage for the most common AWS services. In Part 2, you'll learn exactly how to configure these sensors, set up AWS IAM permissions, and create custom dashboards that give you real-time visibility into your cloud infrastructure.
Whether you're monitoring a single AWS account or managing multi-region deployments with hundreds of resources, PRTG's AWS sensors help you maintain performance, control costs, and troubleshoot issues faster.
For organizations also using S3 storage, understanding Amazon CloudWatch S3 metrics completes your AWS monitoring strategy.