Published by Sascha Neumeier
Last updated on April 08, 2026
•
9 minute read
Before you start reading the article: This is part six of a six-part blog series. If you already know the previous parts, feel free to read on below. Otherwise, let me briefly explain the structure.
Each blog post in the series builds on the last one. The practical examples refer to our fictional company Example Inc.. I described the structure of the company at the beginning of part 1.
👉 Part 1/6 – The right IT monitoring solution for your cloud-first approach
👉 Part 2/6 – Cloud Monitoring with Paessler PRTG Hosted Monitor
👉 Part 3/6 – How to migrate your on-premises IT to the cloud step by step
👉 Part 4/6 – Monitor OT and IIoT with a cloud-based monitoring solution
👉 Part 5/6 – Stay on top of your digital business processes with Paessler PRTG
Good. Now that you know the setting, let's get started! 😊
Part 6 – Adding the “ultimate” to our cloud and hybrid IT guide
Glad you joined us for the last part of our guide to cloud and hybrid IT infrastructures.
The last part of our guide is the cherry on the cake. 🍒 I locked myself in the archives for weeks digging through all our assets, looking for tips and tricks on how to use PRTG Hosted Monitor.
As a result, I'll present you with helpful use cases from practical experience and other resources you can dive into. With all this, monitoring your cloud or hybrid infrastructure really becomes a piece of cake.
This is what we're about to take a closer look at:
- Monitoring SSL certificates from the cloud
- Using HTTP monitoring to ensure availability
- Finally, a fierce collection of further information
Get a drink of your choice, it's going to get wild! 🧃
Monitoring SSL certificates from the cloud
We don't have to tell you how important it is to make sure your websites are all using valid SSL certificates. And if you've done your homework, you're already working with certbot, acme.sh, or some other solution that automatically issues SSL certificates for you.
Our Example Inc. is using certbot to renew certificates for a host when they are 30 days from expiring.
But what if something goes wrong? What if there's an issue with the certbot configuration or you hit your account's rate limit?
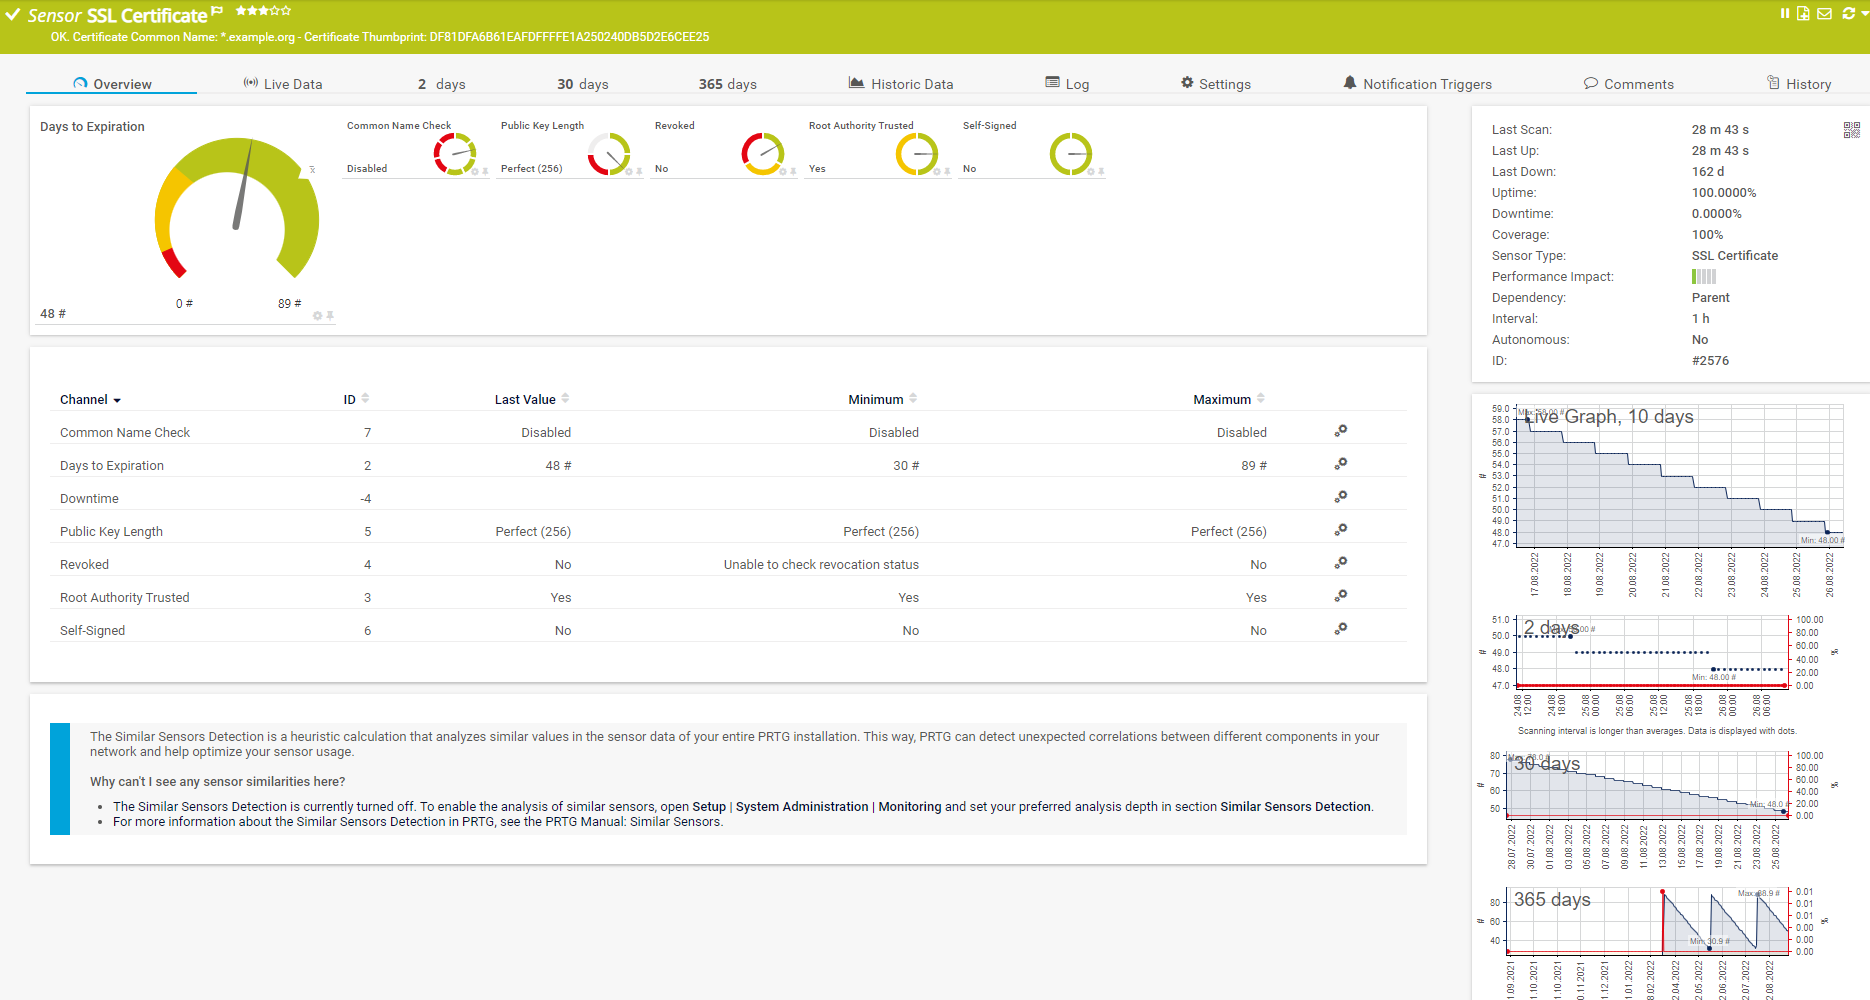
No worries, because PRTG has got you covered. The default limits of the SSL Certificate Sensor ensure that you never see an alert when certbot is working as expected. But you will definitely get an alert if something doesn't go according to plan!
🚨 SSL Certificate Sensor default limits
Enters warning status 28 days before expiry and error status 7 days before expiry
The screenshot below shows the information provided by the sensor.
Using HTTP monitoring to ensure availability
Ensuring the availability of the infrastructure used is one of the core tasks of a sysadmin. The target audience can be employees (internal) as well as customers and partners (external).
Check if users can access the intranet
Earlier in our guide, Example Inc. migrated their intranet server from an on-prem server to the cloud. You as an admin want to make sure that your users on both sites (Nuremberg and Malaysia) can access the intranet.
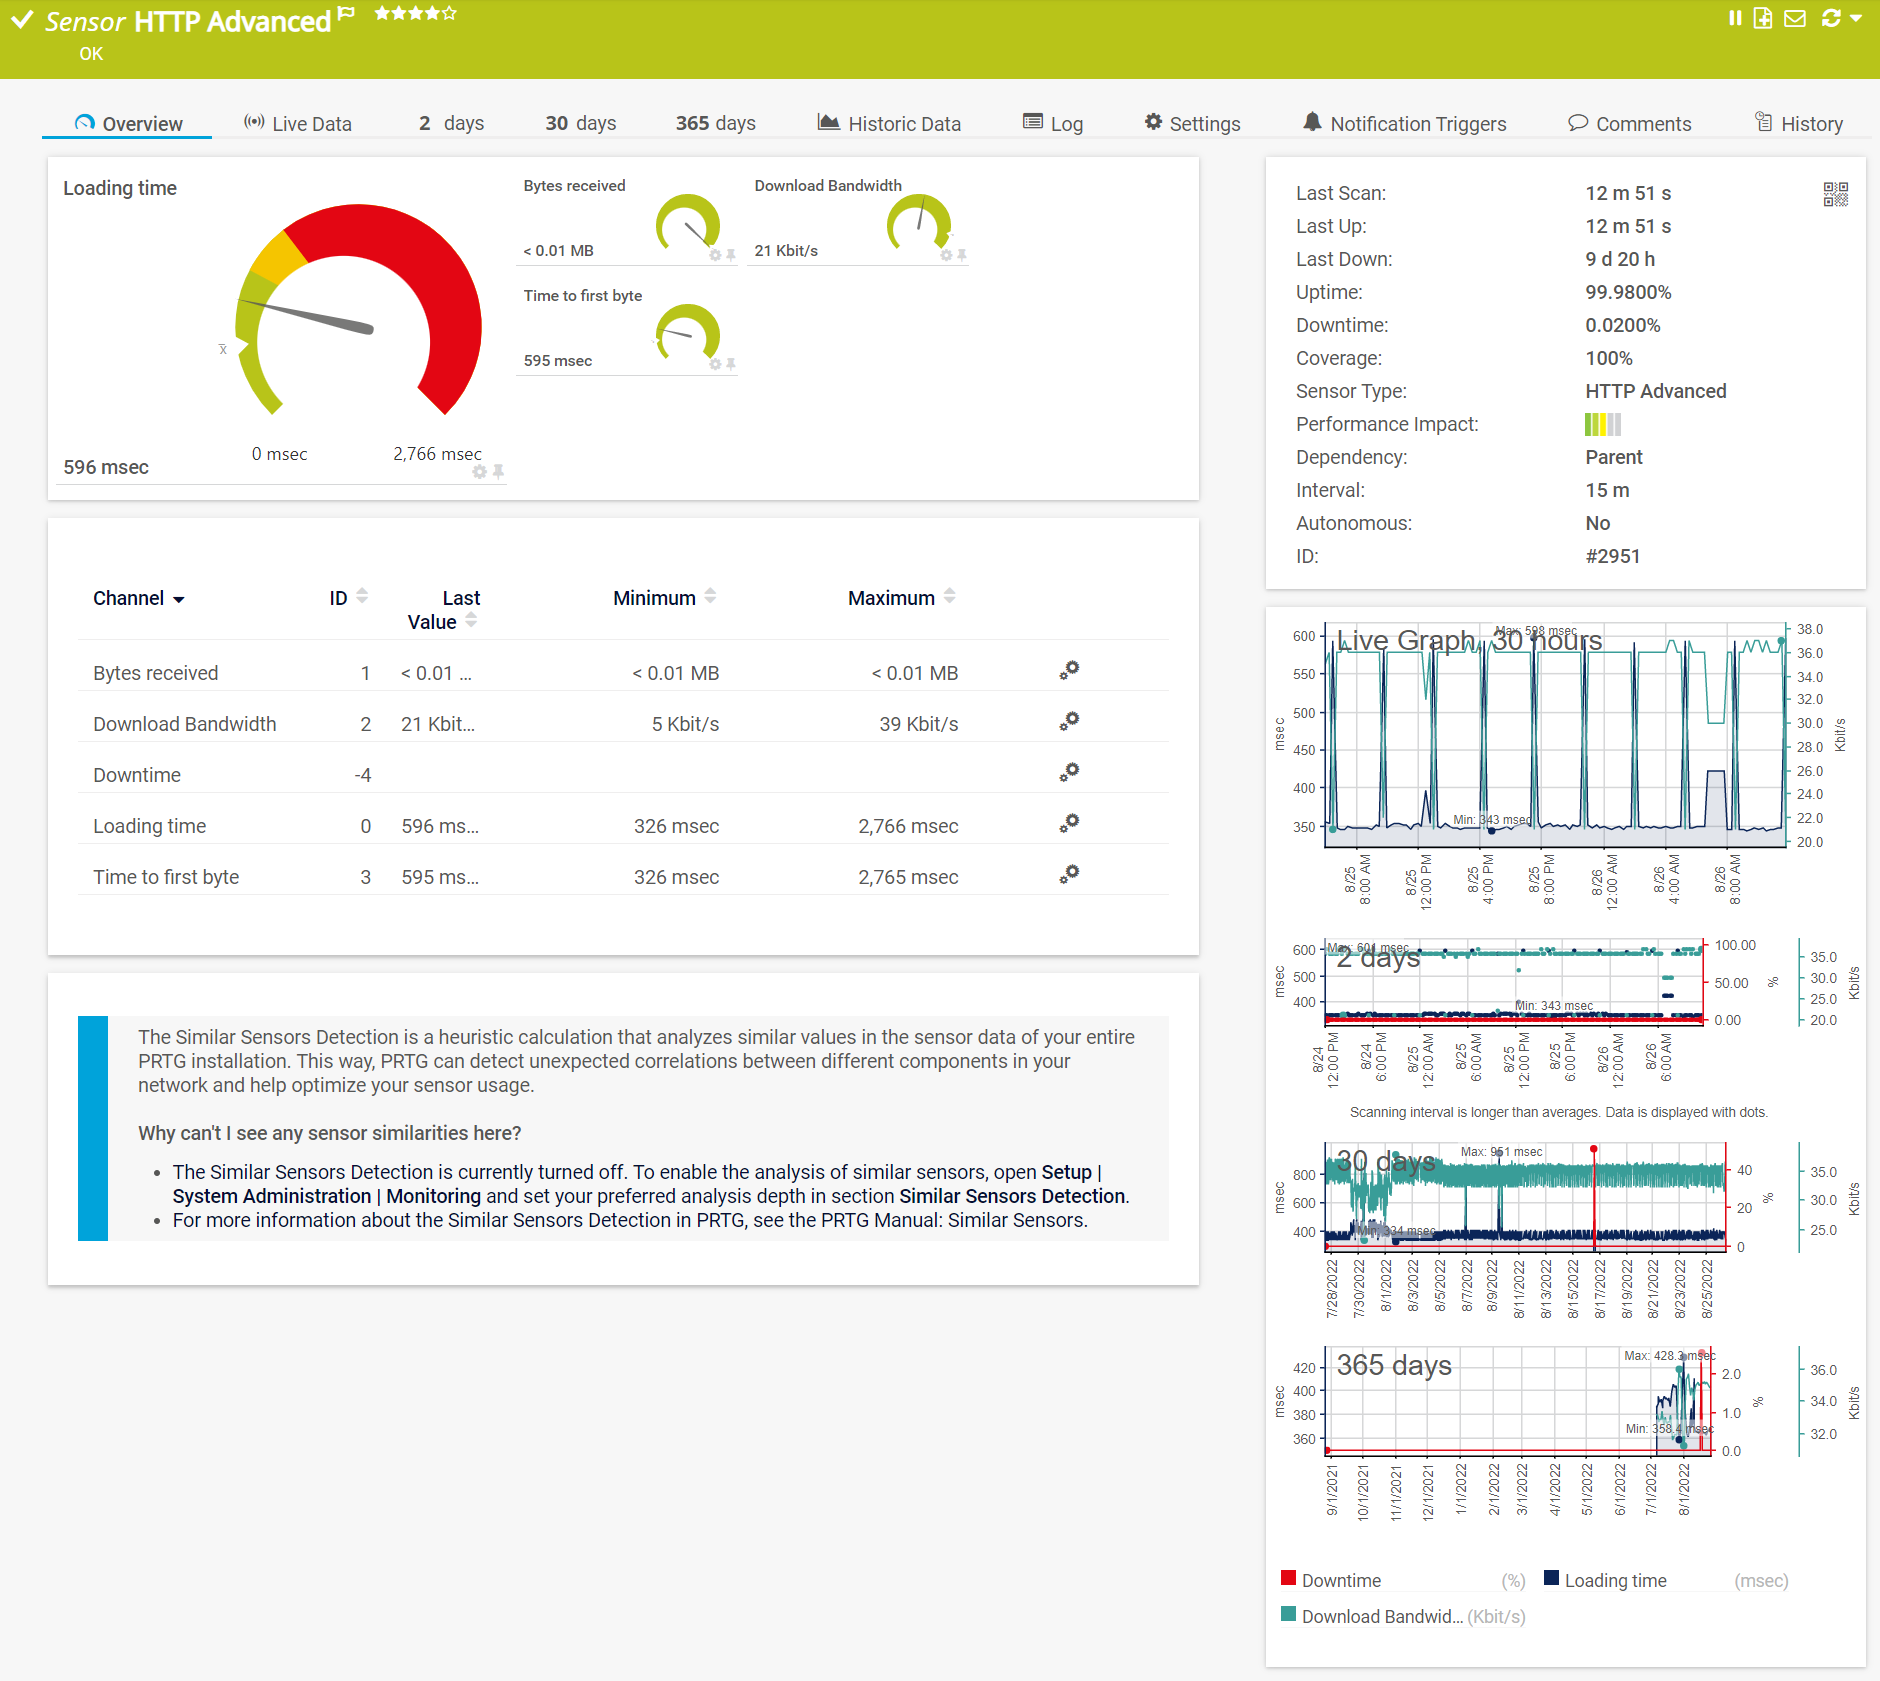
Since we have remote probes on both sites of Example Inc., we create the device "intranet.example.org" on both probes, and deploy the same HTTP Advanced Sensor there. This HTTP sensor in PRTG will be doing a lot of heavy lifting; from DNS resolution, HTTP traffic, to the operation of the webserver at intranet.example.org.
The reason why we can't use the Cloud HTTP v2 Sensor is that the intranet is only accessible internally for users working via the corporate VPN.
But let us have a look at a different example where our audience is external.
Check if customers / partners can access the online shop
The users of shop.example.org are our customers and partners who must use the web-shop exclusively to place their orders. This means that if this site is not accessible or user experience is bad, it directly impacts the sales conversion of Example Inc.
This is where the Cloud HTTP v2 Sensor comes into play. For this particular sensor type, it doesn't matter where we deploy the sensor, it can be on the hosted probe, the Nuremberg probe, or the Malaysia probe.
🤔 Why?
Since this is a cloud-based sensor, queries are made directly in the cloud infrastructure at Paessler and the probe that the sensor is deployed on only fetches the results.
Once the sensor is deployed, it works similarly to the HTTP sensor from the previous use case about checking intranet availability. The sensor helps you make sure that the website is reachable, shows you the latency, and more.
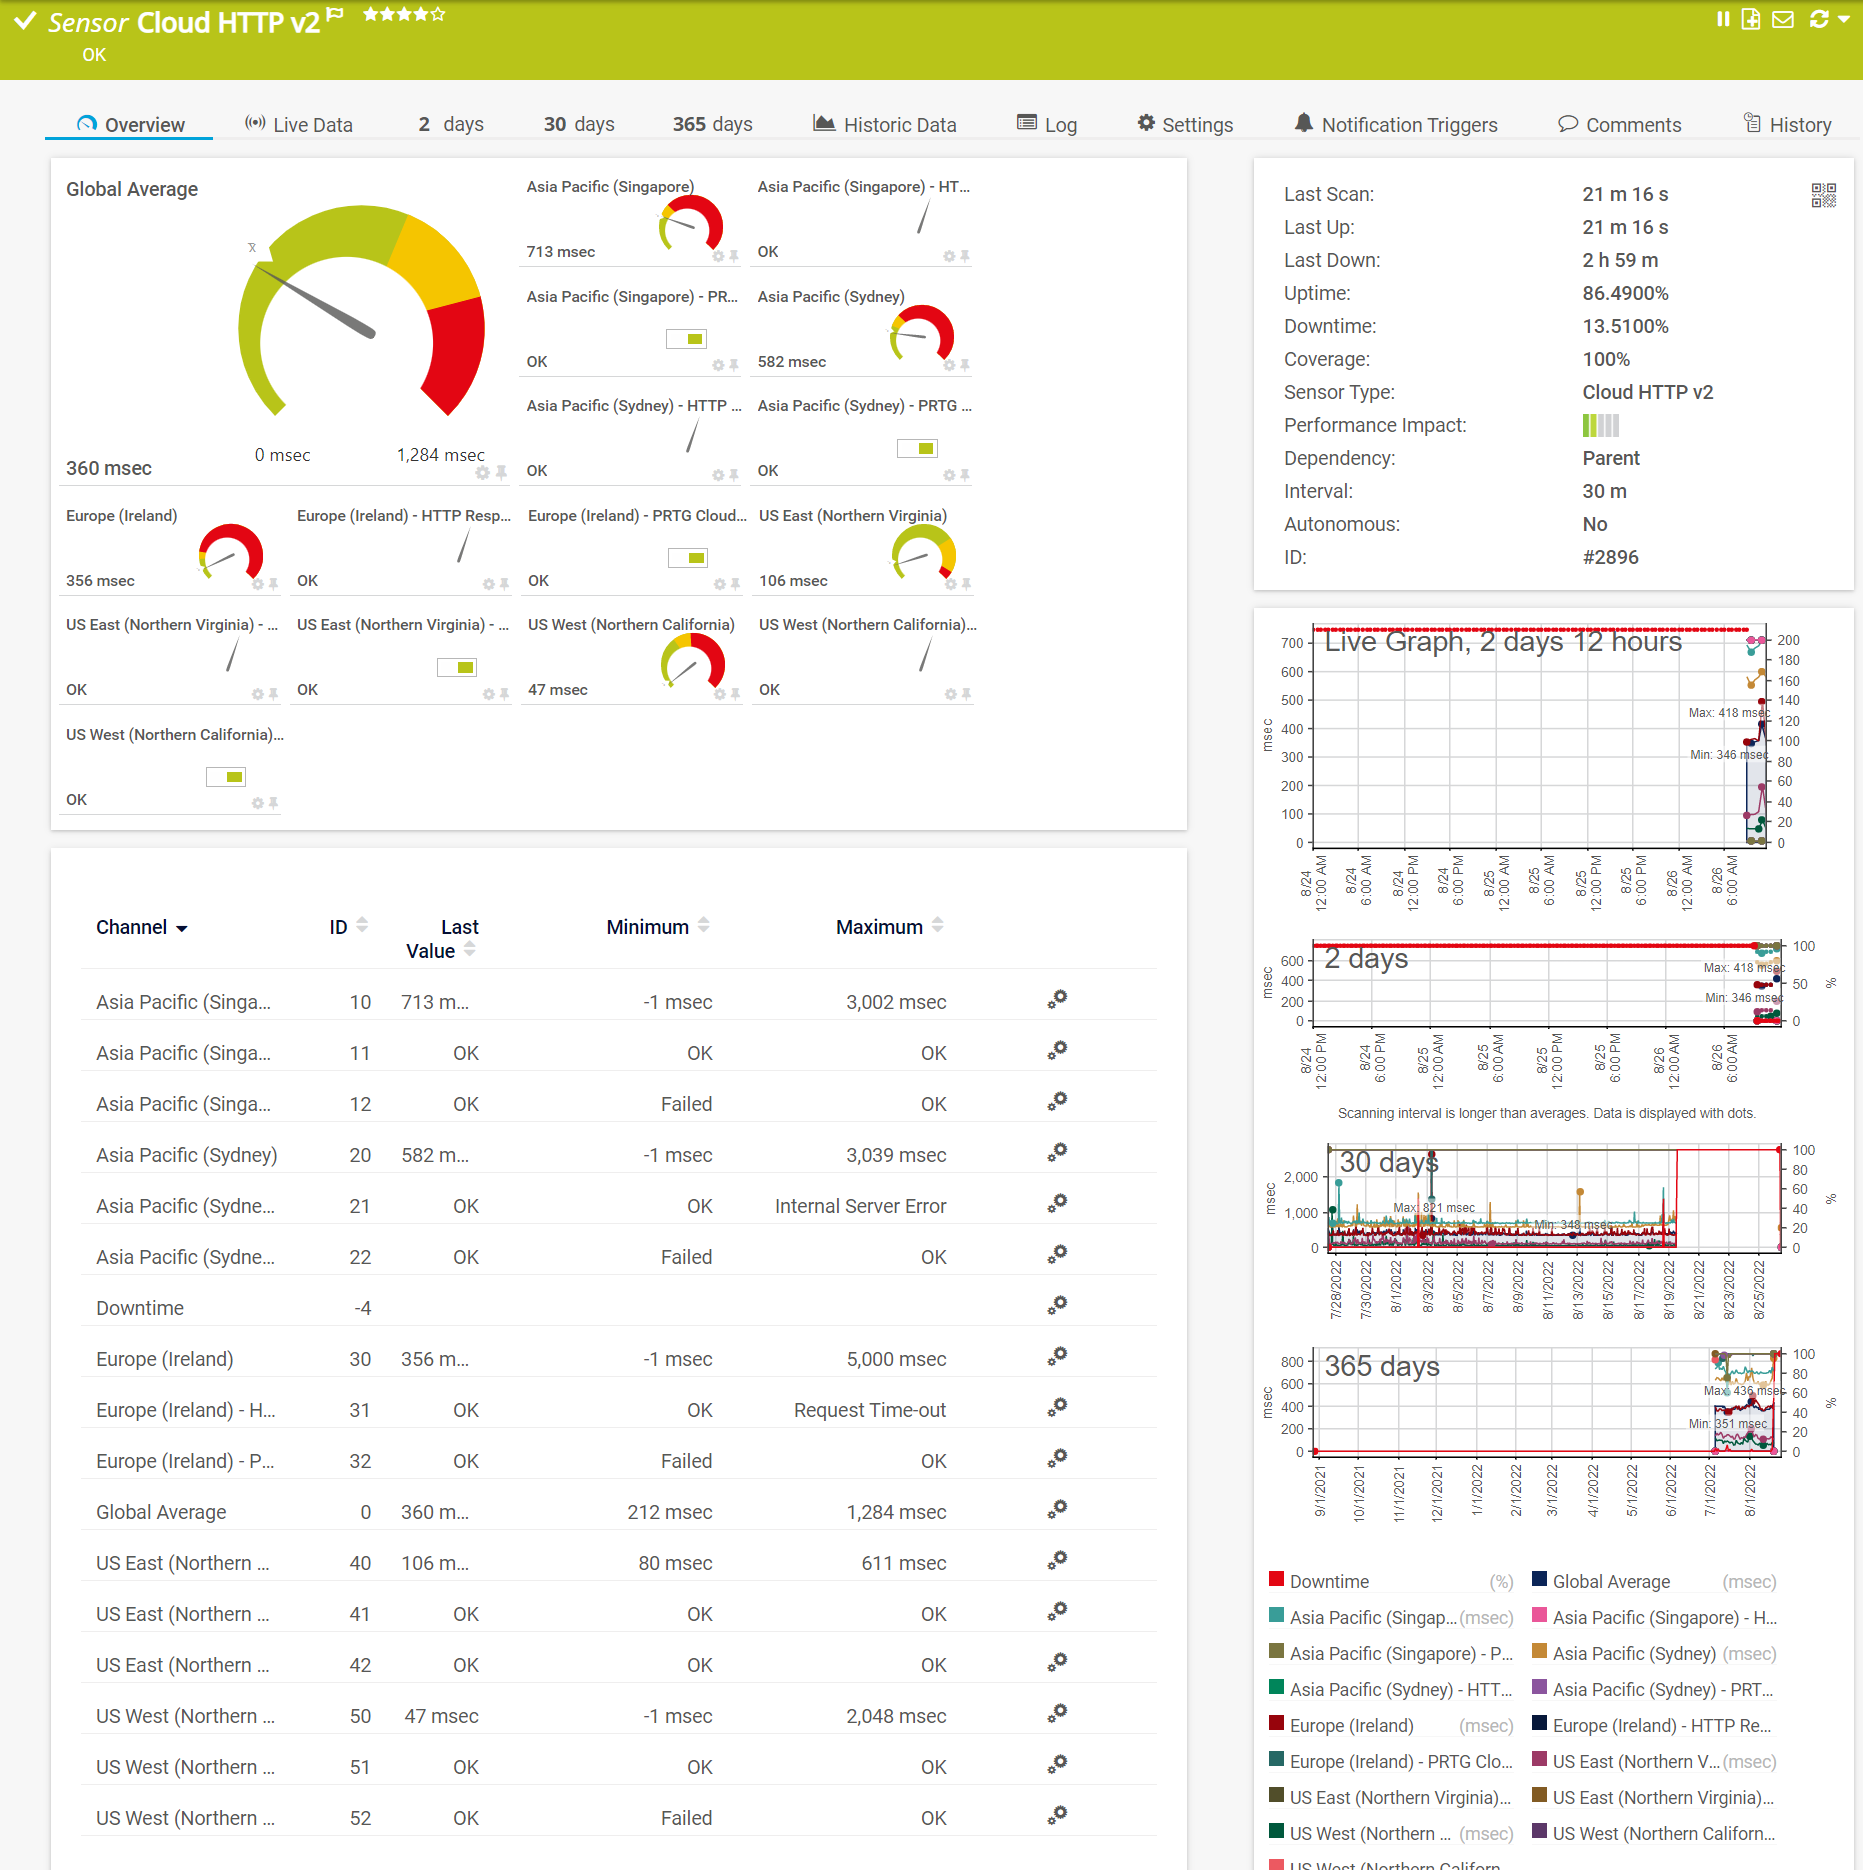
The difference is that we can check all this not only from the locations where we have probes installed, but also from every location where Paessler provides its cloud infrastructure. At the time of writing the list consists of:
- Asia Pacific (Singapore)
- Asia Pacific (Sydney)
- Europe (Ireland)
- US East (Northern Virginia)
- US West (Northern California)
The sensor gives you a pretty good idea whether users in that country or continent can access the website and what the latency is. You will also get alerts if one of the regions can't access the website; and you can configure individual limits for the response time from any of these regions.
Check out where else you might want to look and browse around
If you want to find out how the Carbon Drawdown Initiative uses PRTG Hosted Monitor to collect weather data such as solar radiation, the precipitation amount, and the temperature of the soil and air, check out this case study:
🌍 Carbon Drawdown Initiative monitors ground data with PRTG Hosted Monitor
Maybe you'd like to take a look behind the scenes of PRTG Hosted Monitor. Some time ago, my colleague Greg, together with AWS, explained which components make up the infrastructure we require at Amazon, how the communication between the individual gateways works, and on which basis we provide the individual cloud formation stacks with the necessary speed. Sounds interesting? Then click the link below:
🧱 How We Use Lambda and Step Functions to Create PRTG Instances in AWS
In addition to our various Paessler products, we provide free network monitoring tools from our labs. The set of free network tools includes our flagship product PRTG Network Monitor, as well as small but useful helpers for your daily work. Don't miss it!
🧰 Explore all our free Paessler Tools
If you want to start with our free trial version of PRTG Hosted Monitor, just click here or on the image below. The trial is non-binding, free of charge, and you don't need to sell your soul.

🤝🏻Meet peers in our Linkedin group
Although this guide is coming to an end, it is definitely not the last time I will cover topics related to cloud-based monitoring. Stay tuned for more practical use cases around PRTG Hosted Monitor in the future.
To better understand what's going on out there in your infrastructures, we're looking forward to your input. Tell us about your real use cases and edge cases from the business world.
You are welcome to comment here, but I also invite you to join our growing PRTG user group on Linkedin.
It's completely free, you will find thousands of peers, and we can have a good time together there. 🥳 I would be happy to see you there!
Glad you accompanied me through the six parts of this guide. I enjoyed sharing it and hope you were able to take something with you! 🙌