Before you start reading the article: This is part two of a six-part blog series. If you already know the previous parts, feel free to read on below. Otherwise, let me briefly explain the structure.
Each blog post in the series builds on the last one. The practical examples refer to our fictional company Example Inc.. I described the structure of the company at the beginning of part 1.
Good. Now that you know the context, let's get started! 😊
Part 2 – Cloud Monitoring with Paessler PRTG Hosted Monitor
In this part of our guide to monitoring your cloud IT and hybrid IT infrastructure, I'll show you how our cloud-based monitoring solution Paessler PRTG Hosted Monitor works.
Paessler PRTG Hosted Monitor at a glance
With PRTG Hosted Monitor, you get an all-in-one SaaS monitoring solution for your entire IT and OT infrastructure. We host the solution for you on reliable Amazon AWS servers, and constant backups are a given.
The setup is quick and straightforward, and you don’t need dedicated server hardware. PRTG Hosted Monitor is agentless, and you can start monitoring from your browser right away. That’s it. Nothing to be scared of.🥰
All you need in your network is a so-called remote probe. Its job is to collect the monitoring data in your network and transfer it to the hosted instance via an encrypted connection.
15 minutes until you monitor your first devices!
No longer. Promised! ✌️ Now let's just look at the steps necessary to do this.
- Create your very own PRTG Hosted Monitor instance
- Deploy a remote probe in your local network
- Start PRTG auto-discovery or manually add devices
- Sit back and enjoy 🍿
The instance
My colleague Sebastian shows you how to create the instance in the video below. The first three minutes Sebastian explains the monitoring-as-a-service approach. If you want to jump directly to the start of the installation, just fast forward to 2:45.
At minute 6:30, the setup is already complete, and Sebastian tells you what the so-called “probes” are all about.
📚 If you prefer to read the installation process instead of watching a video, our manual has you covered! PRTG Manual: Create a PRTG Hosted Monitor Instance
The probe
This an application/process running on a Windows/Linux based device that collects all monitoring results and passes them on to the PRTG server.
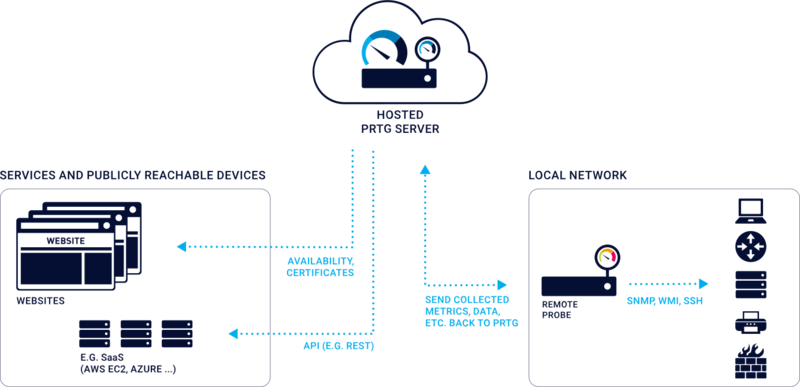
If you want to monitor services and publicly accessible devices from your PRTG Hosted Monitor instance, you can do that with the hosted probe.
To gather monitoring data in your local network, you have to deploy a remote probe.
The visualization below shows distributed monitoring with remote probes.
📚 We have put together the necessary steps here: How to install a remote probe for PRTG in 4 steps
The discovery
Now that your instance and the probe are running, you can start monitoring.
One way is to start PRTG auto-discovery. It helps you discover devices and automatically creates suitable sensors.
Optionally, you can also switch directly to the device tree, and create groups, devices, and sensors to start monitoring.
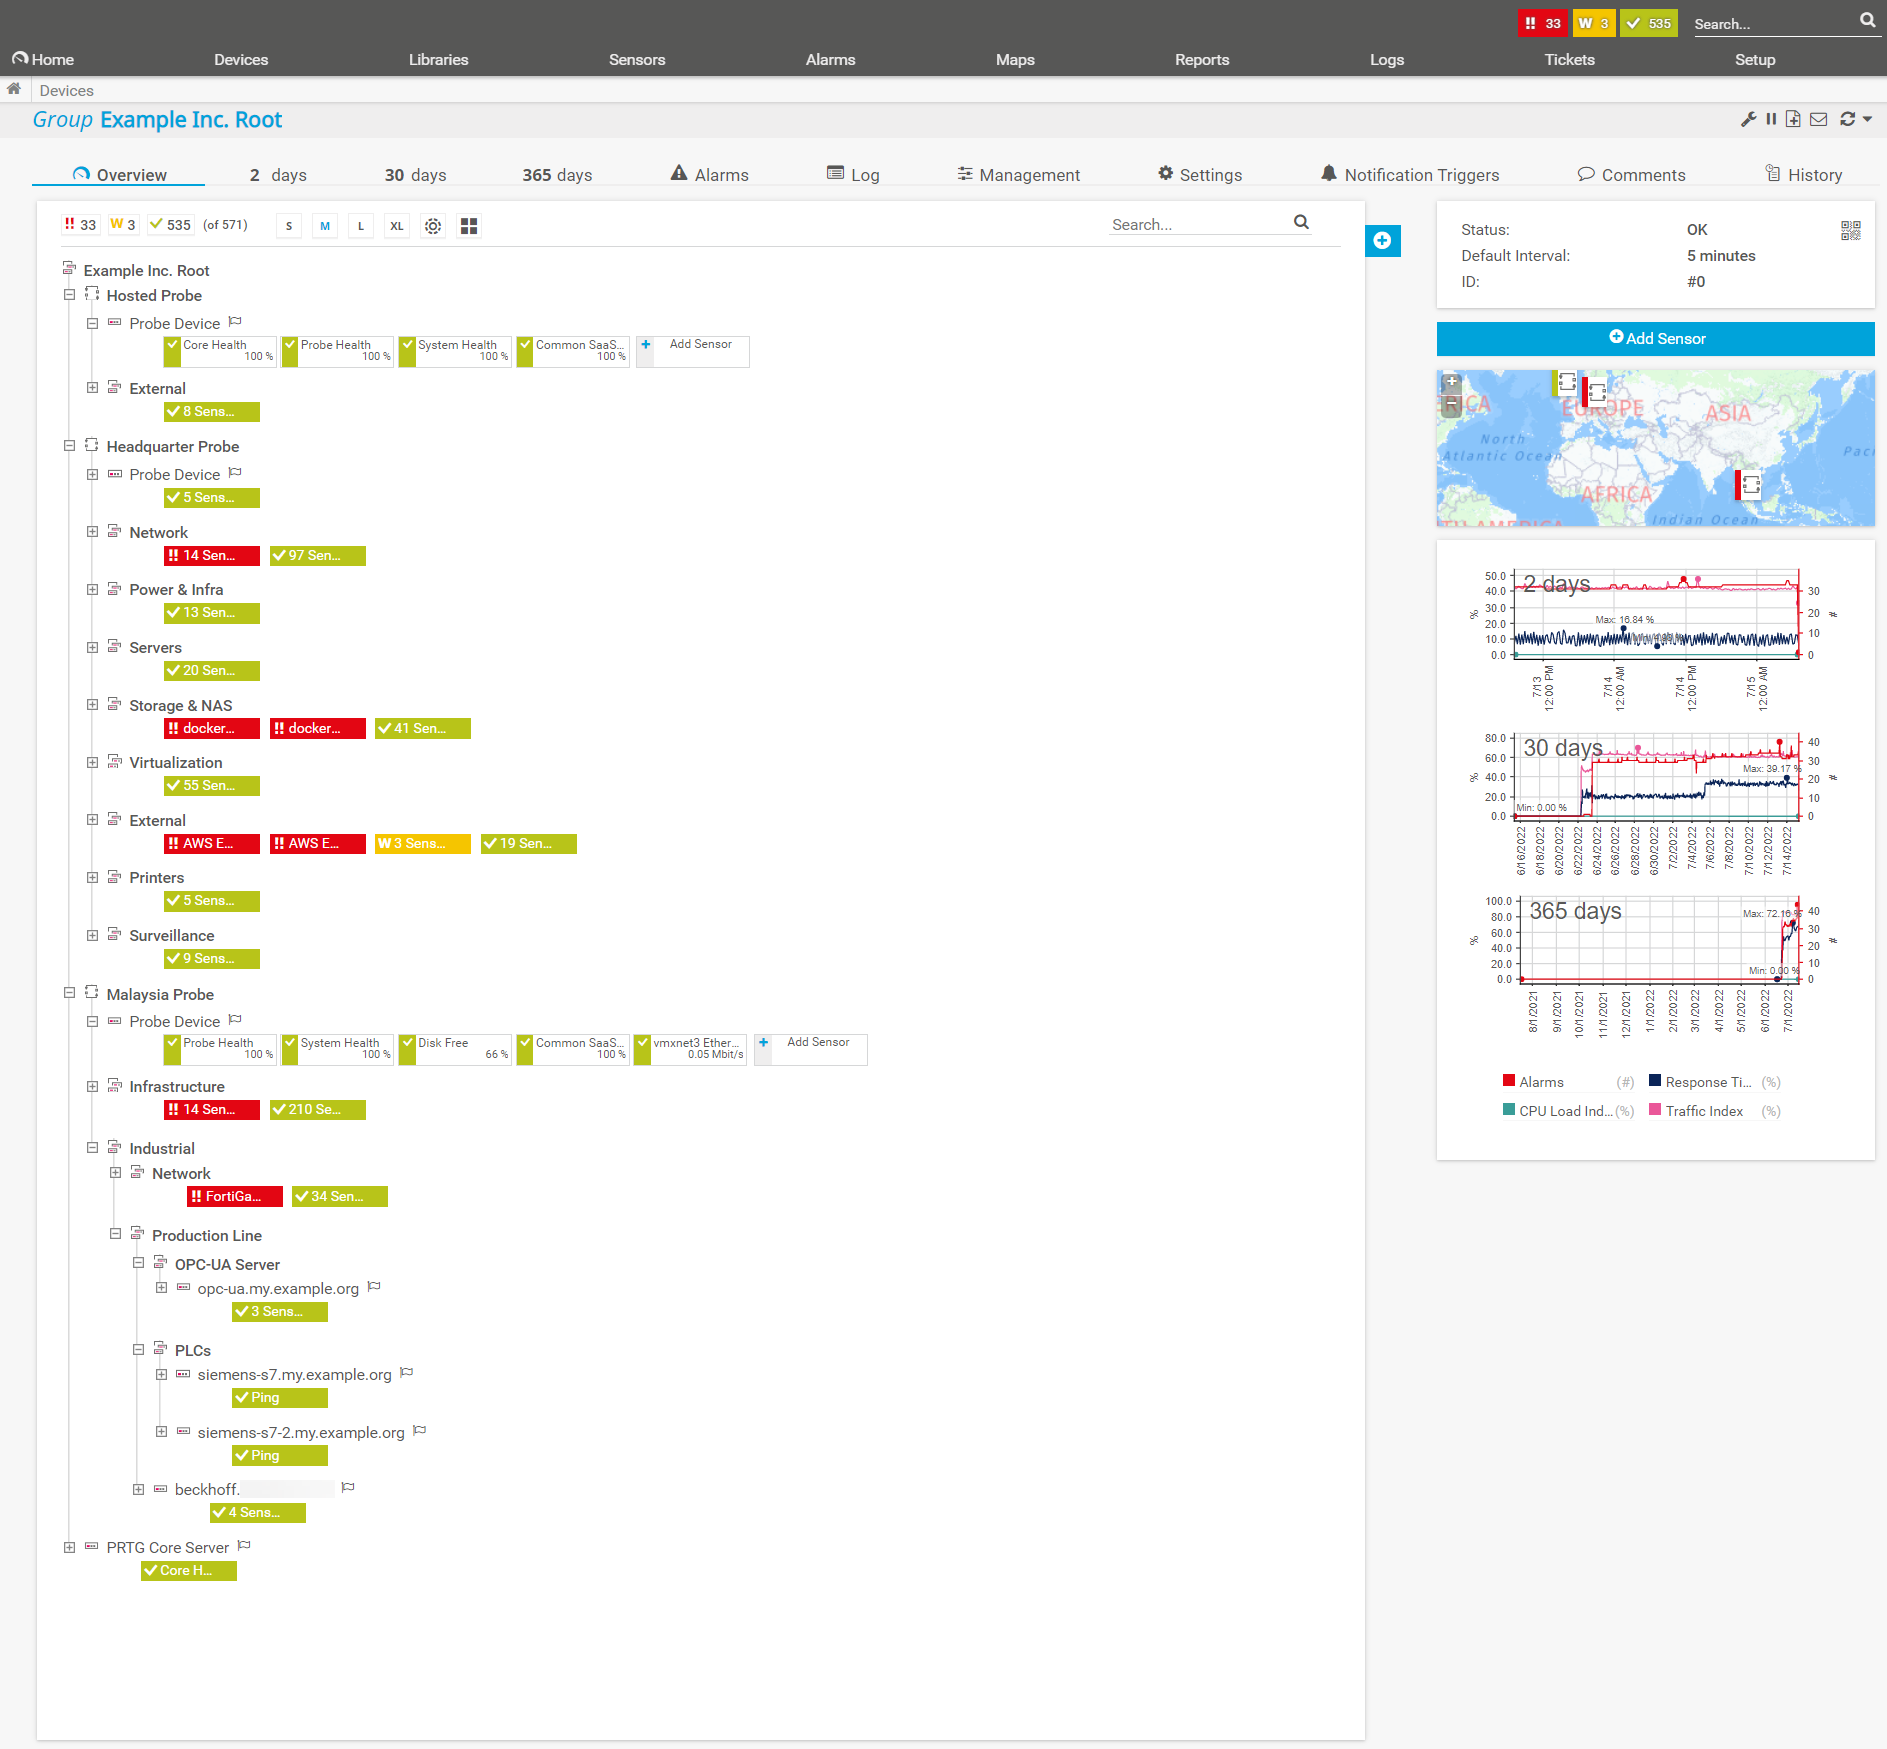
This is what it looks like for our fictional company Example Inc.
You didn't start the trial at the end of the first part of our blog series? If you click below, it will take you a maximum of 15 minutes to monitor the first devices in your network.
And of course you can test it without obligation and free of charge. After testing, you can still decide whether you want to use the full version.
Let me summarize again
✔️ We considered the important requirements of a cloud-based monitoring tool.
✔️ After that I showed you how to install Paessler PRTG Hosted Monitor to start monitoring right away.
⏭️ Now our company Example Inc. will make its big appearance. We will walk through some typical scenarios that are also commonplace for you out there in companies.
But more on that in the third part of our series. There I show you how monitoring supports you when shifting your infrastructure to the cloud using our fictional company Example Inc.
I'm really excited for it, and I so hope you are too! 🤩
 Published by