.jpg) Published by Jasmin Kahriman
Published by Jasmin Kahriman
Last updated on August 25, 2025
•
9 minute read
The first time I had the opportunity to play with Fortinet devices, I asked myself: “How did I miss this? “ Fortinet provides quality hardware, user-friendly UIs, and easy-to-read documentation. They manufacture different products including FortiWifi, FortiAP, FortiAnalyzer, FortiDDoS, FortiGate, and others. This article is about FortiGate, powerful next-generation firewalls.
FortiGate monitoring is critical for maintaining network security and performance. With PRTG's specialized FortiGate sensors, you can track system health, VPN connections, and security metrics in real-time. This guide shows you exactly how to set up FortiGate monitoring with PRTG Network Monitor, including configuration steps, best practices, and troubleshooting tips.

With more than 14.3% of the market share, Fortinet has a strong presence in the security appliances market. They share the stage with big vendors such as Palo Alto, Cisco, Check Point, and others.

Why Choose PRTG for FortiGate Monitoring?
PRTG offers native FortiGate sensors specifically designed for Fortinet devices. Here's what sets PRTG apart:
- Native REST API Integration: Direct connection to FortiGate devices via REST API for accurate, real-time data
- Low Performance Impact: Minimal resource usage on your PRTG core server
- Comprehensive Metrics: Monitor conserve mode, CPU usage, memory utilization, session counts, and VPN status
- Cost-Effective: No per-device licensing - monitor unlimited FortiGate devices with a single PRTG license
- Easy Setup: Configure monitoring in minutes with pre-built sensors and templates
FortiGate is used by our customers, so naturally we decided to create native sensors for monitoring FortiGate devices. Paessler PRTG provides you with two sensors, FortiGate System Statistics and FortiGate VPN Overview.
If you are running PRTG Network Monitor version 20.4.64 or later, you need to enable experimental features under Setup > System Administration > Monitoring > Experimental Features > Beta sensors > Enable, as shown in the screenshot below.
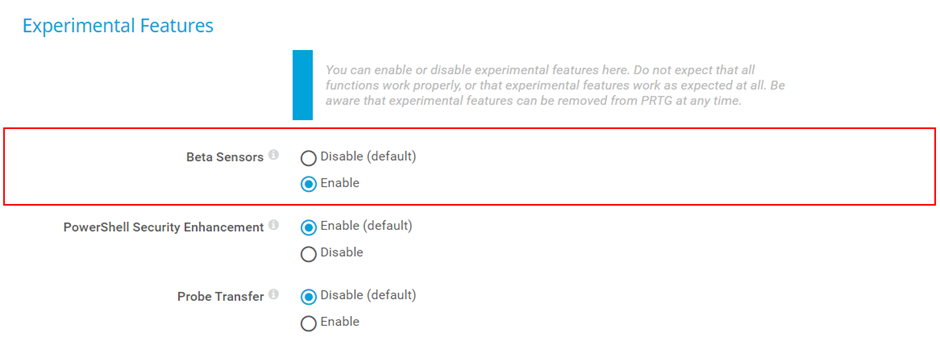
Enable Beta sensors
FortiGate System Statistics and FortiGate VPN Overview require an API token for monitoring the FortiGate. Firstly, you need to create a new REST API user by navigating to System > Administrators > Create New > Rest API Admin.
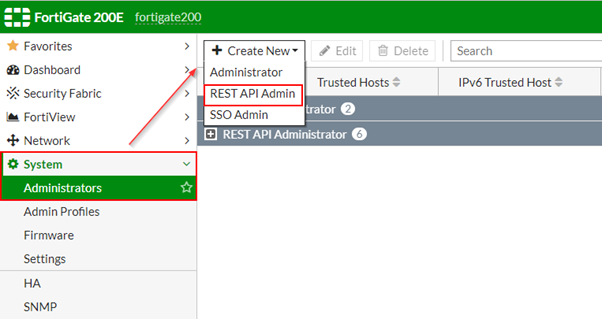
Create a Rest API Admin user
Fill out the information (Username, Administrator profile), disable PKI Group (if there are no any), and add the subnet to restrict logins to trusted hosts.
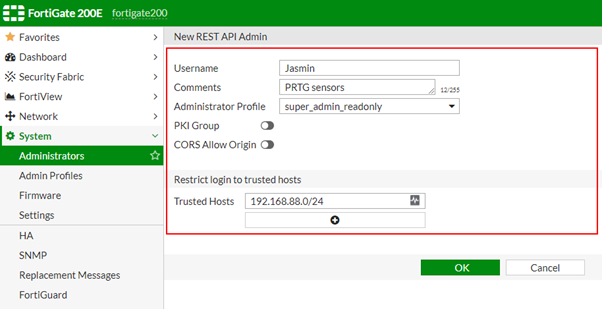
Define user parameters
Once you clicked OK, FortiGate will create the user and generate an API token. Copy the key and proceed with the second step.
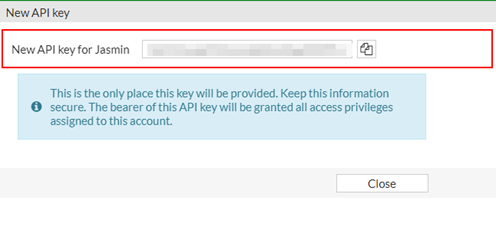
A new API key is generated
Secondly, you need to add an API token in FortiGate´s settings that are higher in the object hierarchy, for example, in the settings of the parent device. The example is shown in the screenshot below.
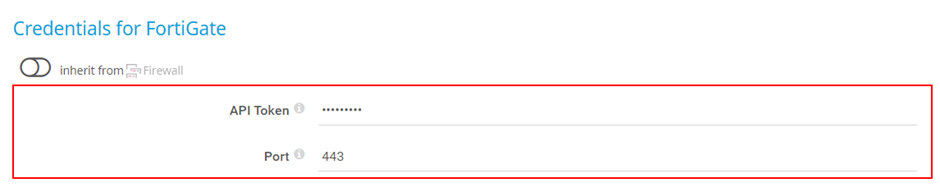
Add API token to FortiGate
For testing purposes, I use the FortiGate 200E firewall. It is powered by Intel® Celeron® CPU G1820 @ 2.70GHz 2 cores, 4 GB RAM, and 15331 MB of compact flash size. However, these sensors work on any FortiGate device. If you are interested in other details for this device, check them out here.
FortiGate 200E
Let´s now evaluate these two sensors. Oh, before I forget, both sensors support IPv4 and IPv6 and have a very low-performance impact on the PRTG core server.
For writing this article, I ran my workloads on a powerful mini PC – Intel NUC powered with the latest generation CPU i7, with 64 GB RAM DDR4, 256 M.2 SSD. Intel® NUC Mini PCs with Windows 10 are fully complete and ready to work out of the box. You can learn more here Intel® NUC Products.
FortiGate System Statistics Sensor: Monitor CPU, Memory & Sessions
The FortiGate System Statistics sensor monitors the system health of a Fortinet FortiGate firewall via REST API. This sensor type measures whether the conserve mode is active or inactive. The conserve mode is a self-protection measure when the system detects memory shortage. Besides that, it also measures CPU and memory usage, number of sensors, session rate, and system uptime status. Key metrics include:
System Health Indicators:
- Conserve Mode Status: Monitors memory conservation mode (Inactive=Up, Active=Down, Unknown=Unknown)
- CPU Usage: Real-time processor utilization
- Memory Usage: RAM utilization
- Session Statistics: Current session count and session rate monitoring
- System Uptime: Device availability and uptime tracking
Technical Specifications:
- Minimum scanning interval: 1 minute
- Recommended interval: 5 minutes
- Performance impact: Very low
- Protocol: REST API via HTTPS
- Multi-platform probe support: Yes
This sensor uses lookups to determine the status values of one or more channels. This means that possible states are defined in a lookup file. You can change the behavior of a channel by editing the lookup file that the channel uses.
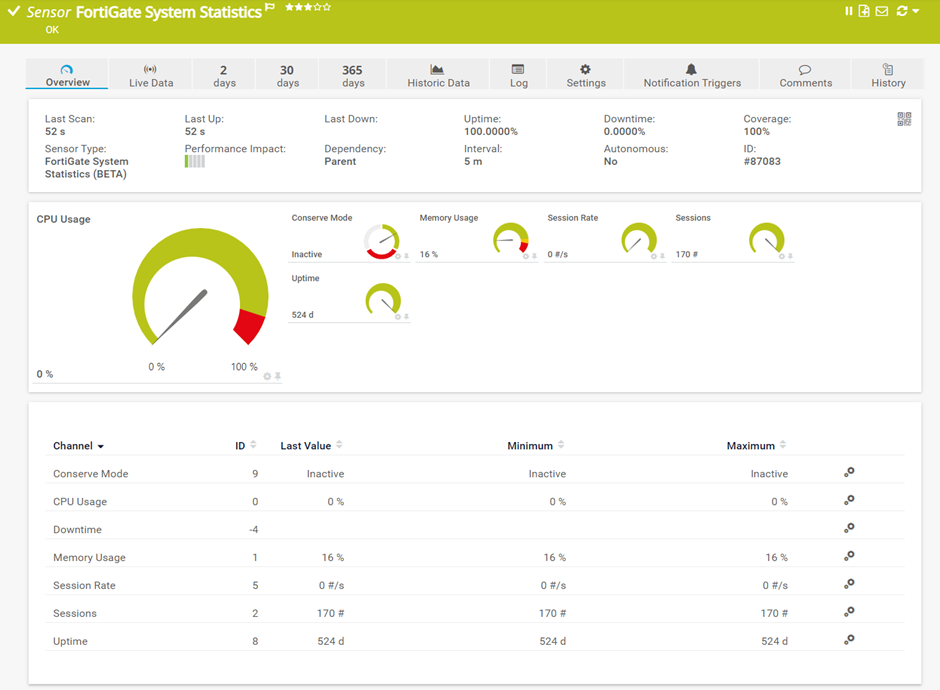
FortiGate System Statistics
FortiGate VPN Overview Sensor: Track SSL & IPsec Connections
The FortiGate VPN Overview sensor delivers detailed VPN connection monitoring for both SSL and IPsec tunnels via REST API. Essential for organizations relying on secure remote access:
VPN Monitoring Capabilities:
- Connected SSL Clients: Number of active SSL VPN connections
- IPsec Tunnels "Up": Count of active IPsec tunnels
- IPsec Tunnels "Down: Count of inactive IPsec tunnels
Configuration Options:
- VDOM Support: Monitor specific Virtual Domains (VDOMs)
- Ignored VPNs: Exclude specific VPN connections from monitoring (case-sensitive, one per line)
- Integration with PRTG's notification system for VPN status changes
This sensor helps you track your VPN connections. If one of them goes down, you will know it.
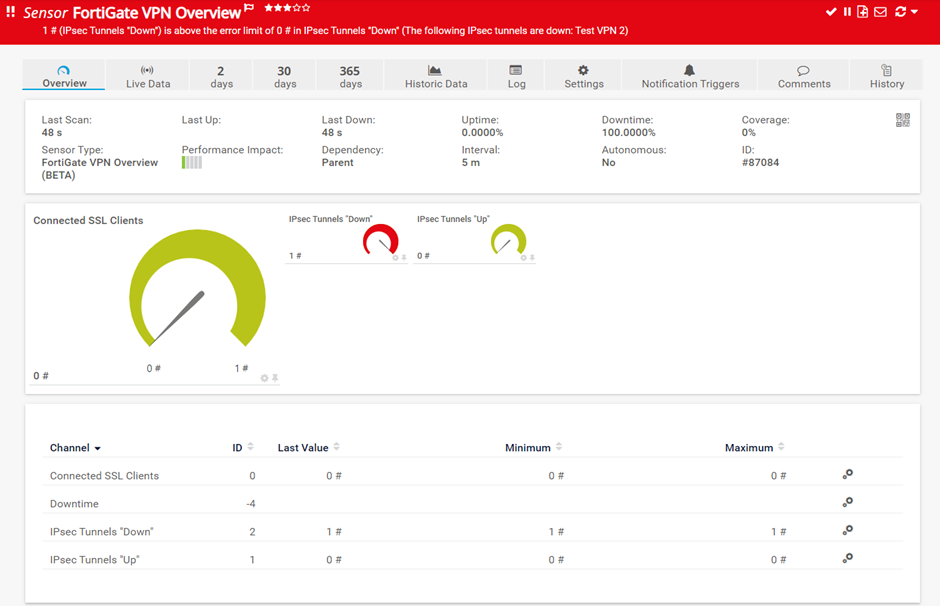
FortiGate VPN Overview
You want to know more about the Fortigate sensors and see how to set them up? Then don't miss this video tutorial:
Start Monitoring Your FortiGate Today
Don't wait for network issues to impact your business. PRTG's FortiGate sensors provide the visibility you need to maintain optimal network performance and security. Start your free trial today and see real-time FortiGate system statistics and VPN connection data in minutes.
I hope you enjoyed reading this article. I welcome you to read my blog TechwithJasmin.com and I’m looking forward to connecting with you via LinkedIn.