.jpg) Published by Jasmin Kahriman
Published by Jasmin Kahriman
Last updated on July 10, 2026
•
12 minute read
This is my fourth article about monitoring physical servers with Paessler PRTG. The first three articles were about Dell PowerEdge, IBM System X and Fujitsu servers.
In today's article, I will talk about HPE ProLiant servers. ProLiant is a brand that was originally developed by Compaq and is currently marketed by HPE. There are two form factors available: Modular Line (ML) and Density Line (DL). ML servers are tower based and DL are rack based. The procedure for monitoring ML or DL servers is the same.
PRTG Network Monitor can monitor your HPE ProLiant Gen9, Gen10, and Gen11 servers using five dedicated SNMP sensors that check status of various server components such as system health, physical disks, logical disks, memory controllers and network interfaces. This allows you to detect and fix potential issues before they can cause expensive server downtime.
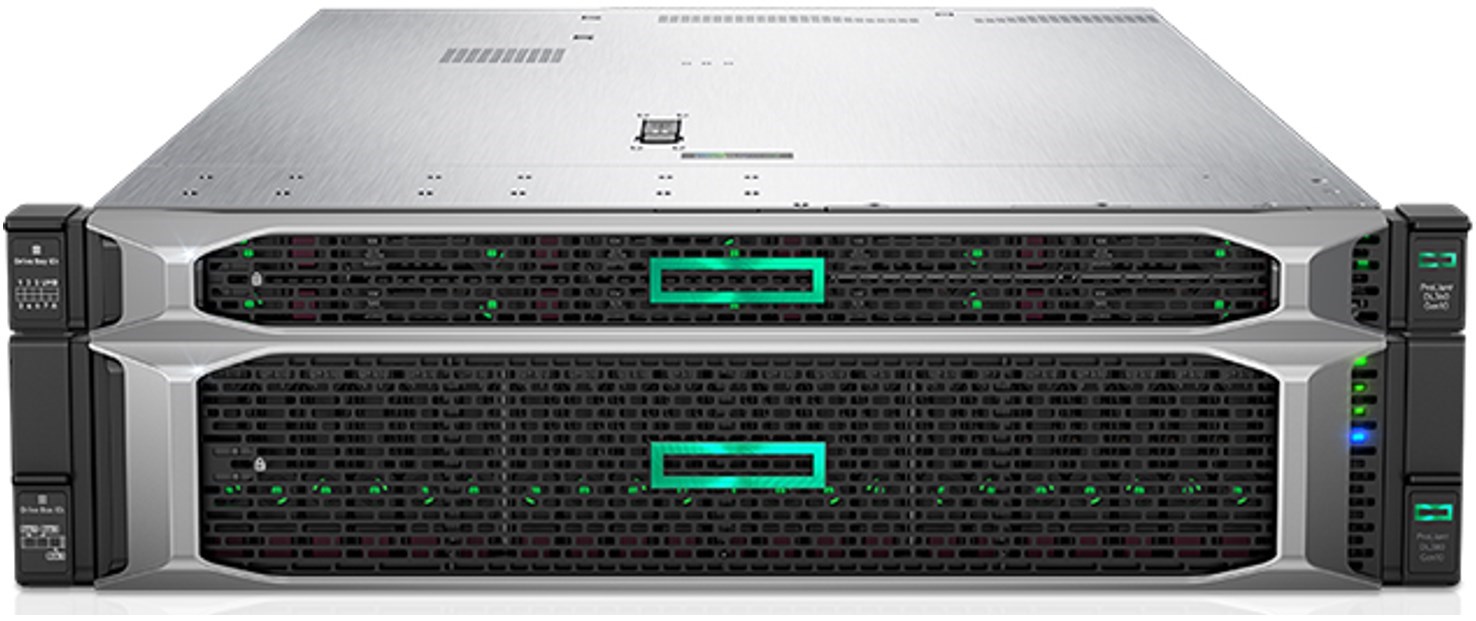 HPE ProLiant DL380 Gen10

Some remarks about PRTG sensors
- PRTG offers five specialized SNMP sensors specifically engineered for HPE ProLiant server monitoring, each optimized for different hardware generations and components.
- If you are running HPE Generation 9 or earlier, you need to install HPE Insight Management Agents and HPE Insight Management WBEM Providers on the target device.
- If you are running HPE Generation 10, you need to install HPE Agentless Management and the HPE Agentless Management Service on on the target device.
- If you are running HPE Generation 10, use iLO interface as a parent device for sensors.
- The HPE ProLiant sensors support iLO v3. We recommend to use at least iLO 4.
- All sensors support IPv4 and IPv6.
- As all sensors are SNMP based, they have very low performance impact.
If you want to jump right into the tutorial video, just click the play button below!
👉 Ready to implement HPE ProLiant monitoring? Download PRTG free trial - no credit card required.
Generation-Specific Requirements
For optimal monitoring performance, ensure these prerequisites are met:
Generation 10 and 11 servers:
- HPE Agentless Management Service installed on target system
- Configure SNMP through iLO interface (Administration > Management > SNMP Settings)
- Use iLO IP address as parent device in PRTG
- iLO 4 or higher recommended for full feature support
Generation 9 and earlier servers:
- HPE Insight Management Agents installed on target system
- HPE Insight Management WBEM Providers configured
- SNMP access via iLO interface for certain OIDs
- Some sensors may require direct iLO device configuration for error-free operation
Universal requirements:
- SNMP v1, v2c, or v3 protocol support
- IPv6 compatibility available
- Low performance impact design (< 1% CPU utilization)
- Supports lookup tables for status determination
Step 1: Enable SNMP via iLO
PRTG sensors for monitoring HPE ProLiant servers are based on SNMP. That means you need to enable SNMP within iLO. iLO stands for Integrated Lights Out and it is a management interface used to configure your HPE ProLiant server and services.
Depending on the version of iLO you use, SNMP settings may be located in a different location on the UI. I use iLO v4.
1. Login to your iLO interface via the web console.
2. Click on IMM Management in the main menu and then click Network.
3. Select Enable SNMP and type community string under Community String.
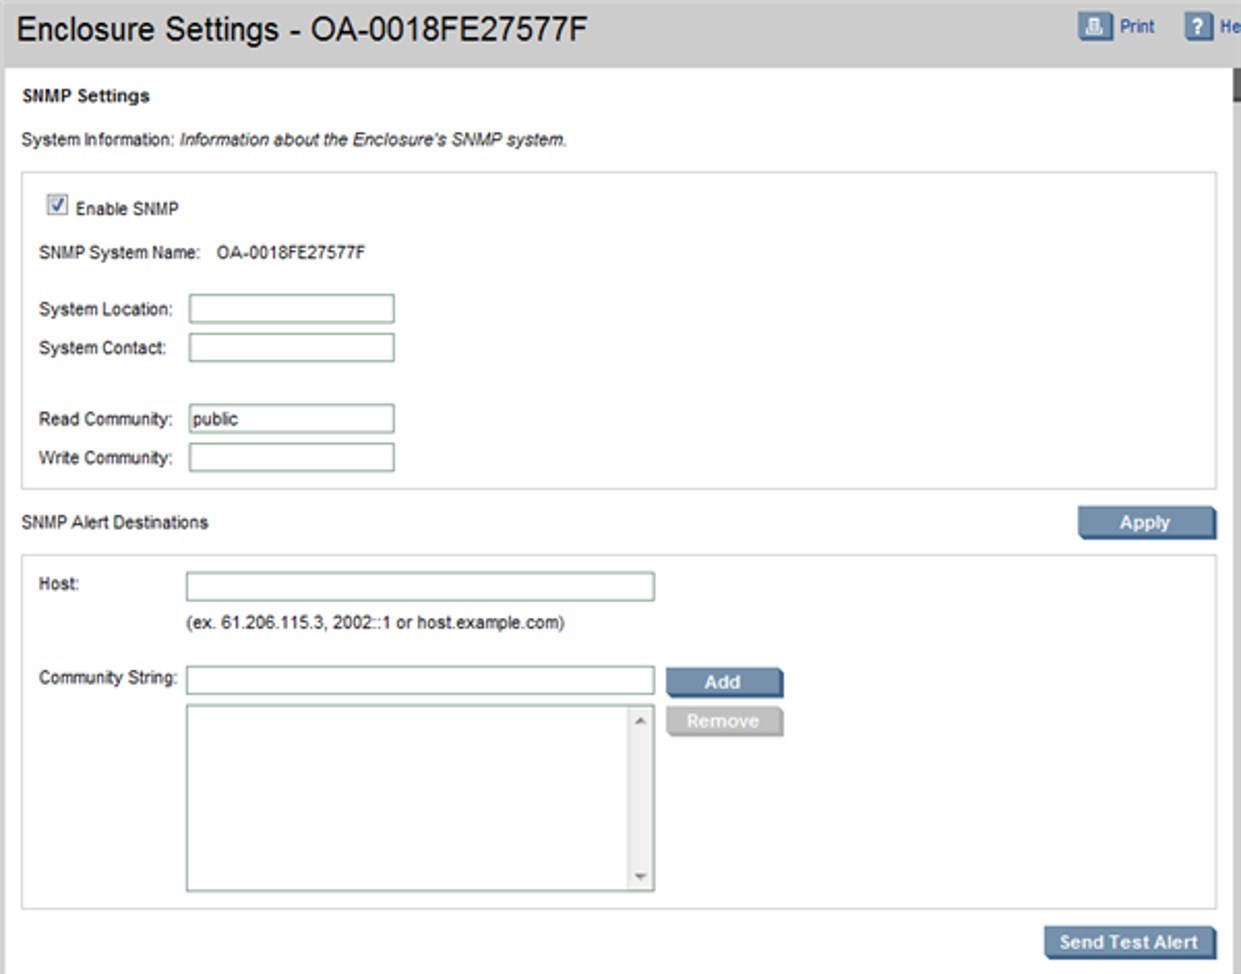
4. Close the UI
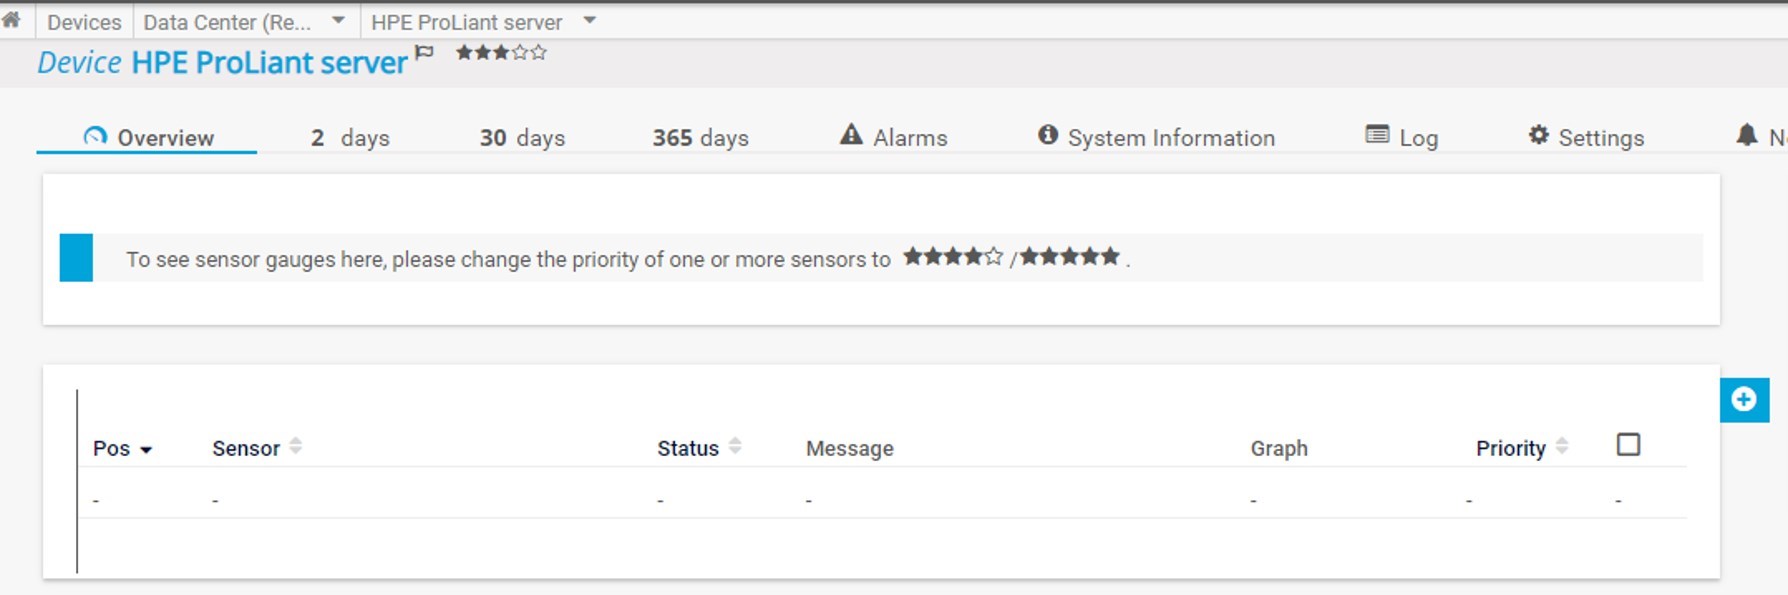
Step 2: Add HPE ProLiant server to PRTG
In the second step, you need to add your HPE ProLiant server to the PRTG device tree. You can use the IP or DNS name of your server.
 Add HPE ProLiant server to PRTG
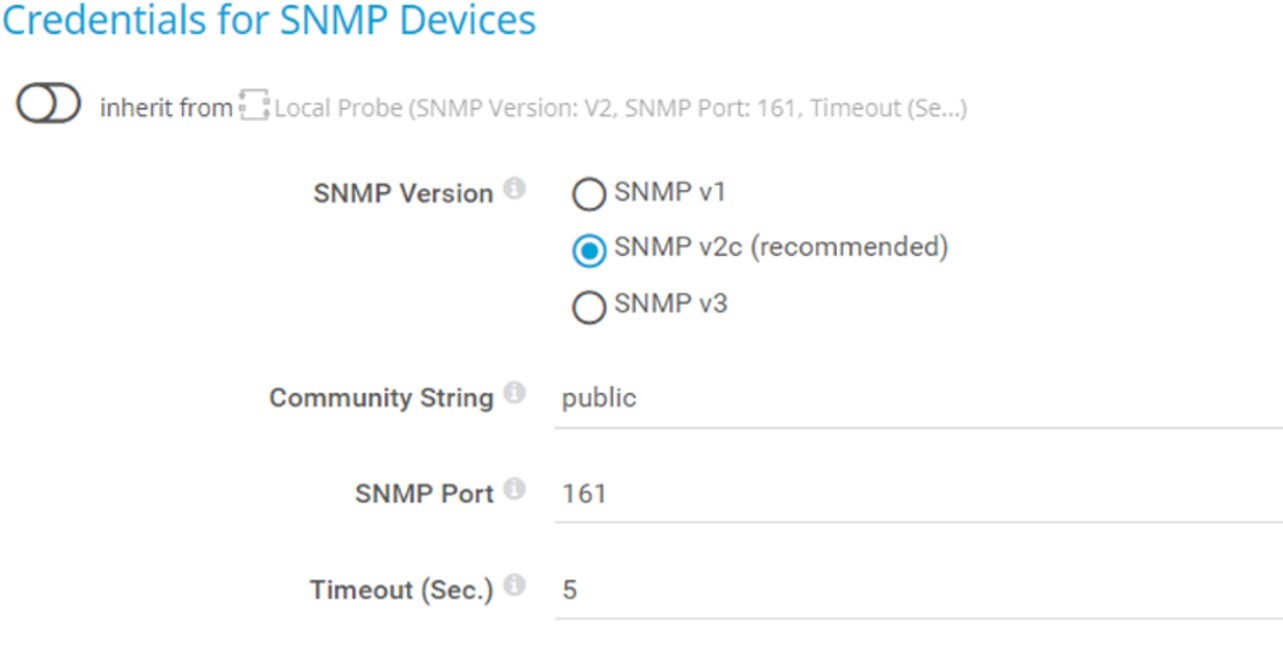
In case you don't use the default SNMP settings (community string and port), you need to configure SNMP settings on the parent device within PRTG („HPE ProLiant" > Settings > Credentials for SNMP Devices).
If you use the default SNMP credentials, there is nothing to change.
 Credentials for SNMP
Step 3: Add sensors
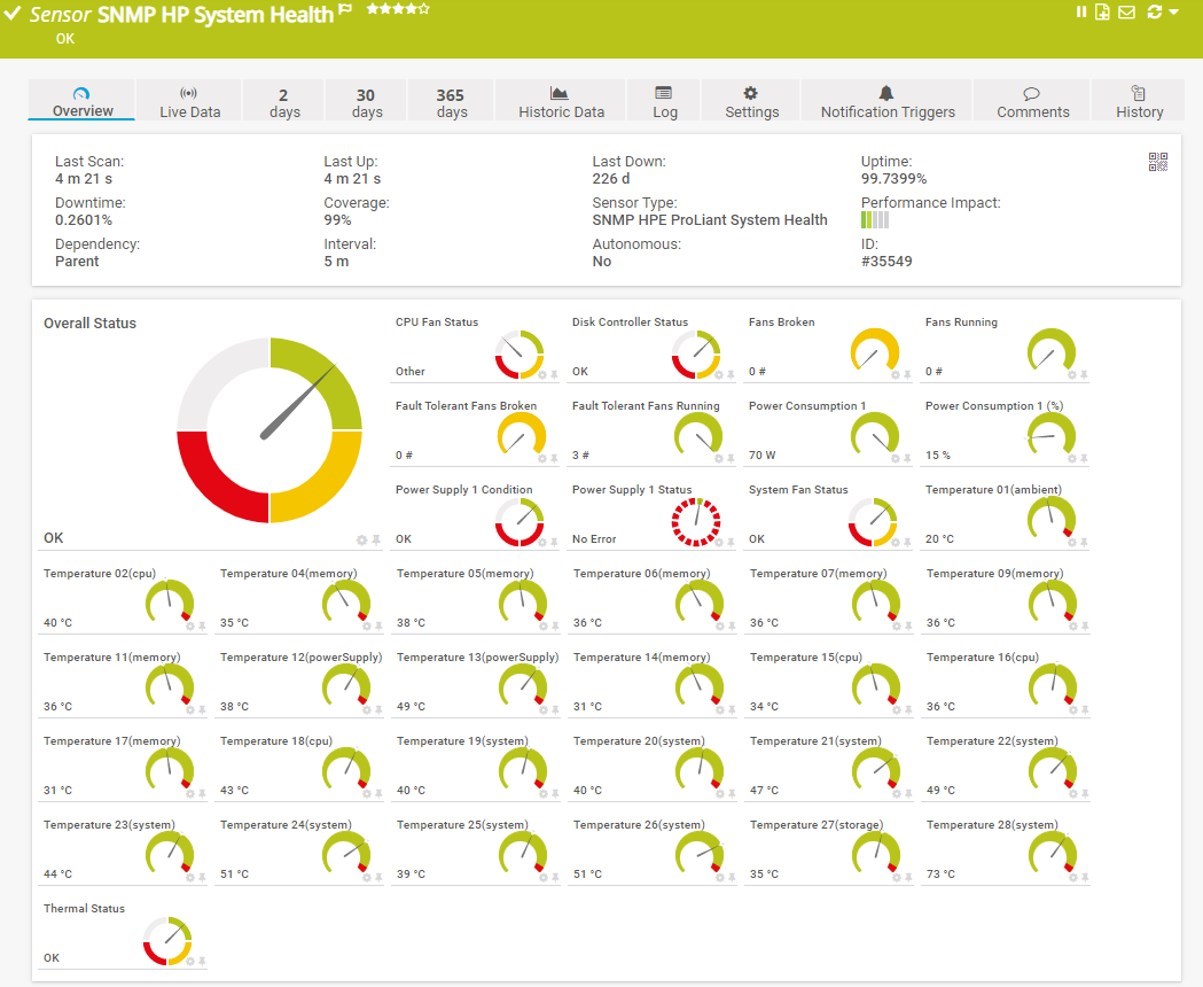
The SNMP HPE ProLiant System Health sensor monitors comprehensive system health including CPU status, power supply units, temperature sensors, voltage levels, and fan operations. This sensor provides real-time status monitoring for critical server components and supports both IPv4 and IPv6 connections with low performance impact
Redundant array of independent disks (RAID) controllers that have no hard disks assigned might cause the Down status. In this case, deactivate the respective controllers in the HPE ProLiant BIOS to avoid sensor errors.
This sensor has predefined limits for temperatures and broken frames. You can change these limits individually in the channel settings.
HPE ProLiant System Health sensor
SNMP HPE ProLiant Physical Disk sensor: Monitors individual physical disks in HPE servers, providing disk status, temperature, and performance metrics. The sensor includes "Limited Monitoring" mode detection and uses lookup tables to determine disk status values. Essential for RAID controller monitoring and predictive disk failure detection
The sensor only shows Disk Status and no other channels if it runs in "Limited Monitoring" mode. For more information, see SNMP HPE ProLiant Physical Disk sensor not showing all information.
This sensor uses lookups to determine the status values of one or more channels. This means that possible states are defined in a lookup file. You can change the behavior of a channel by editing the lookup file that the channel uses. For details, see section Define Lookups.
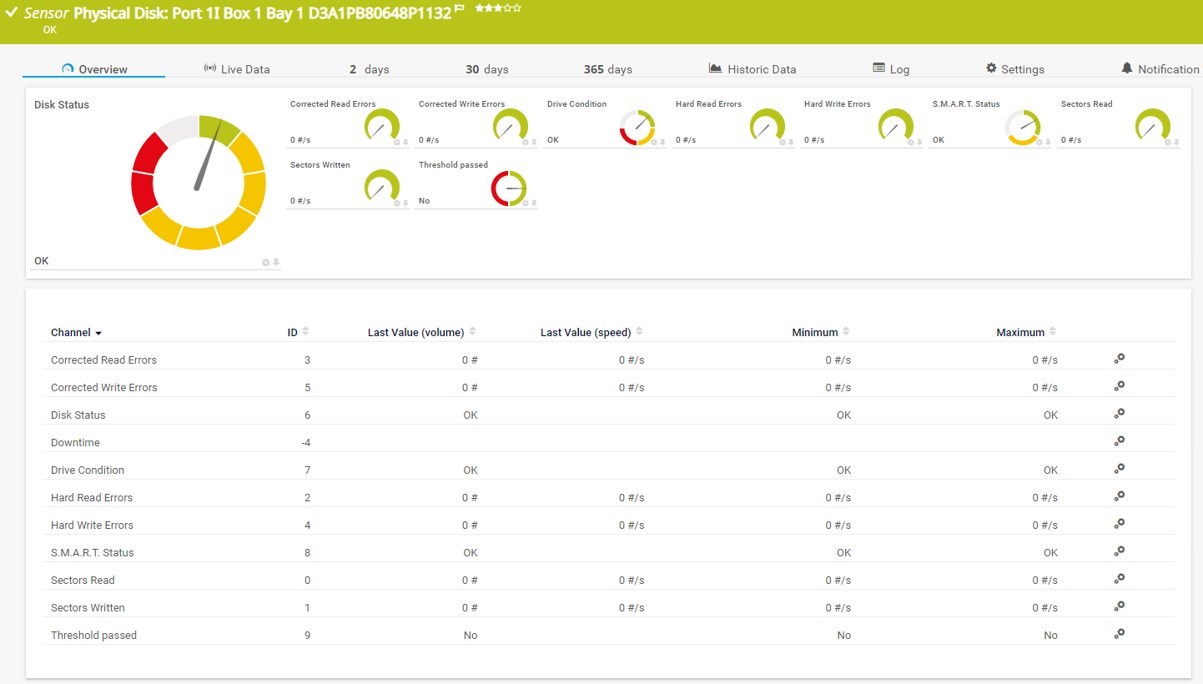
HPE ProLiant Physical Disk sensor
The SNMP HPE ProLiant Logical Disk sensor tracks logical disk arrays and RAID configurations, monitoring logical volume health, capacity utilization, and RAID status. Critical for storage infrastructure monitoring and ensuring data integrity across disk arrays.
This sensor uses lookups to determine the status values of one or more channels. This means that possible states are defined in a lookup file. You can change the behavior of a channel by editing the lookup file that the channel uses. For details, see section Define Lookups.
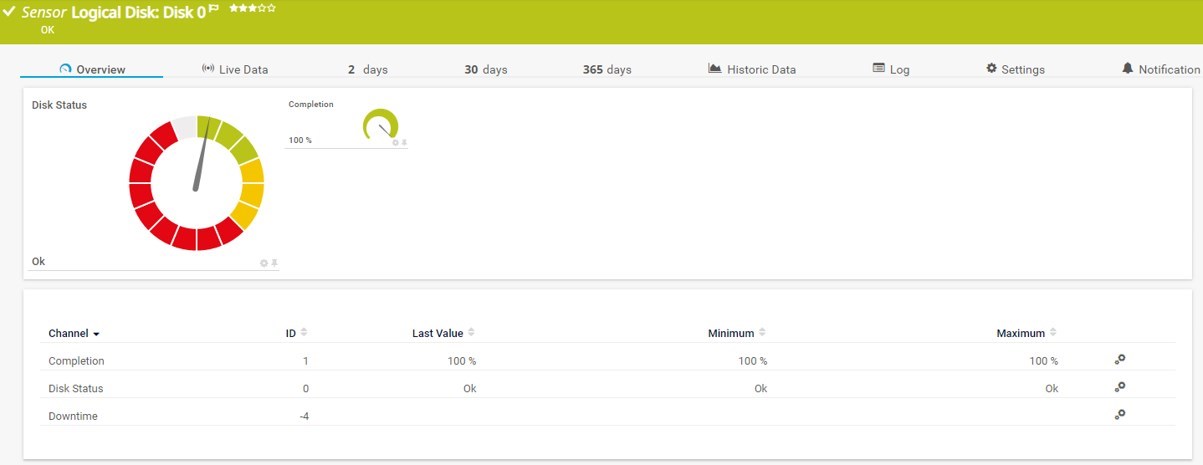
HPE ProLiant Logical Disk sensor
The SNMP HPE ProLiant Memory Controller sensor monitors memory subsystem health including DIMM status, memory controller performance, and error detection. Supports module hot-swapping detection and provides detailed memory utilization metrics.
This sensor uses lookups to determine the status values of one or more channels. This means that possible states are defined in a lookup file. You can change the behavior of a channel by editing the lookup file that the channel uses. For details, see section Define Lookups.
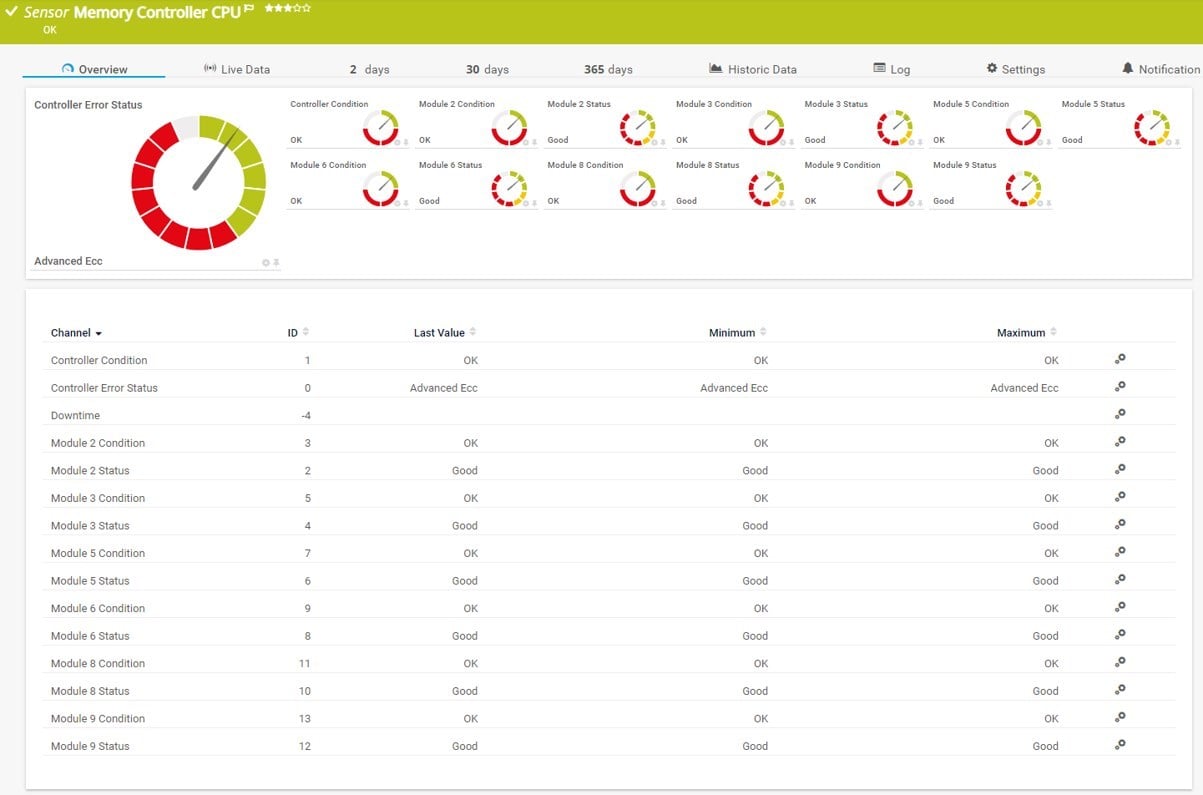
HPE ProLiant Memory Controller

SNMP HPE ProLiant Network Interface sensor: Comprehensive network interface monitoring showing bandwidth utilization, error rates, frame statistics, and collision detection. Monitors both incoming and outgoing traffic with detailed error analysis capabilities.
During sensor creation, the status of each available network interface is shown. If this status is "Link Failure", it is still possible to add a sensor for the respective interface. However, most likely the sensor for this interface does not work correctly. The error message in this case is "No Such Name (SNMP error # 2)".
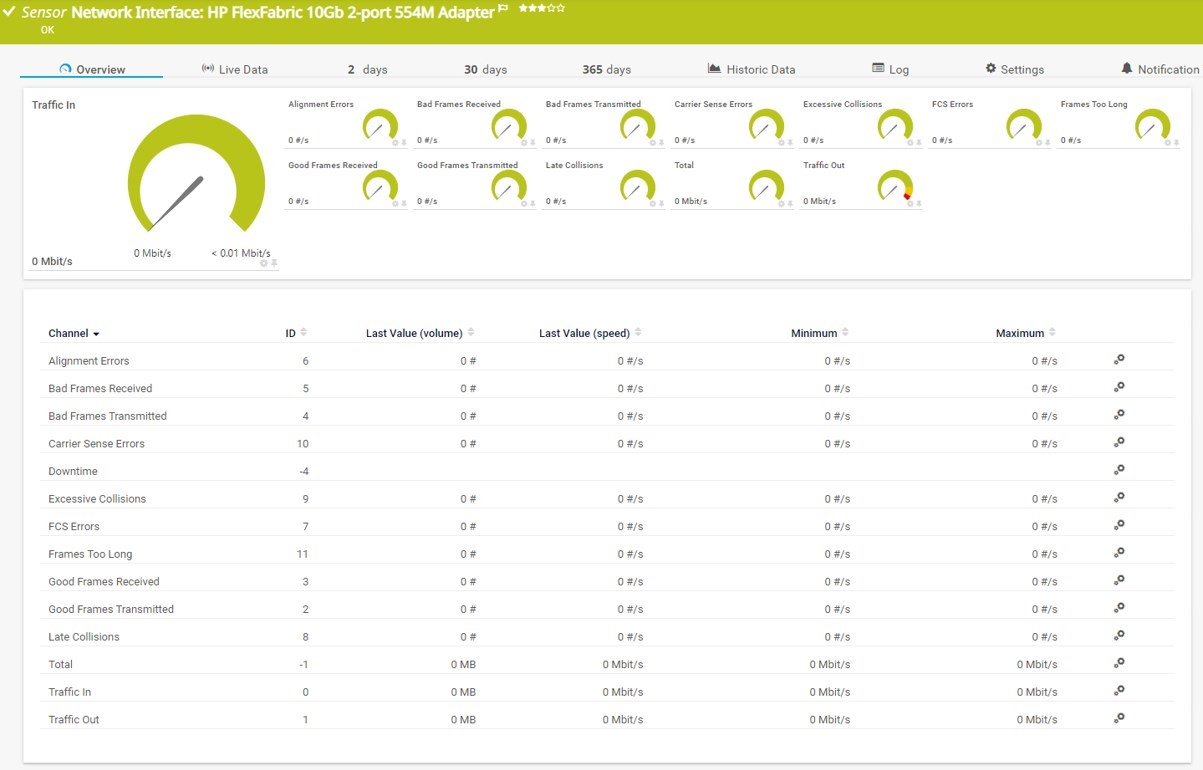
HPE ProLiant Network Interface sensor
👉 Start monitoring your HPE ProLiant servers today with PRTG's specialized sensors. Download your free 30-day trial and set up comprehensive server monitoring in minutes.
You are welcome to connect with me via LinkedIn and check out my tech content on my blog TechwithJasmin.com.