I remember my first physical server I worked with: it was a Fujitsu tower server. It was running Windows Server 2003 and AD DS role. Somehow, I feel sentimental when thinking about it.
If you have followed our blog and my previous two articles, you already learnt how to enable SNMP and monitor Dell PowerEdge and IBM System X using PRTG. Now, in this article, my focus is on the Fujitsu servers.
The sensor used for monitoring might also work on other Fujitsu devices like PRIMEQUEST servers, some storage systems of the ETERNUS product line, and CELSIUS workstations in racks.
Let's do some hands-on together.
Step 1: Enable SNMP via iRMC
Paessler PRTG sensors for monitoring Fujitsu (Primergy) servers are based on SNMP. That means you need to enable SNMP within iRMC. iRMC stands for Integrated Remote Management Controller and it is used to configure Fujitsu Primergy servers and hardware services.
Depending on the version of iRMC firmware you use, SNMP settings may be in a different location within the UI. I use iRMC v5.
1. Login to your iRMC interface via the web console.
2. Click on Settings in the main menu and then click Services > Simple Network Management Protocol (SNMP).
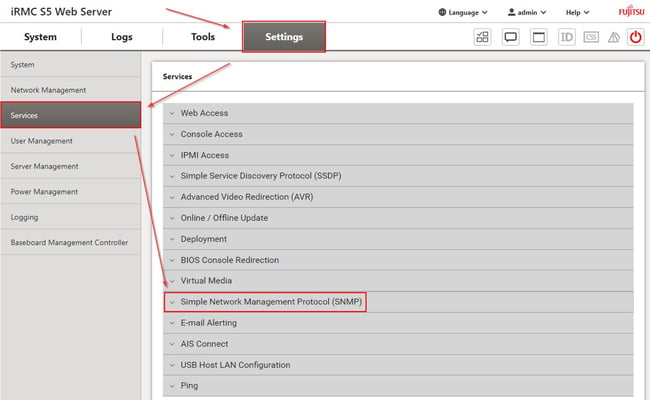 Services > Simple Network Management Protocol (SNMP)
3. Expand Simple Network Management Protocol (SNMP) and then configure the following:
a. Select Enable SNMP checkbox
b. Configure SNMP port, SNMP version and community string. It is configured by default, but change it if you need to.
 Services > Simple Network Management Protocol (SNMP)
4. Click Apply and log out from iRMC session.
Step 2: Add Fujitsu Primergy server to PRTG
In the second step, you need to add your Fujitsu Primergy server to the PRTG device tree. You can use the IP or DNS name of your server.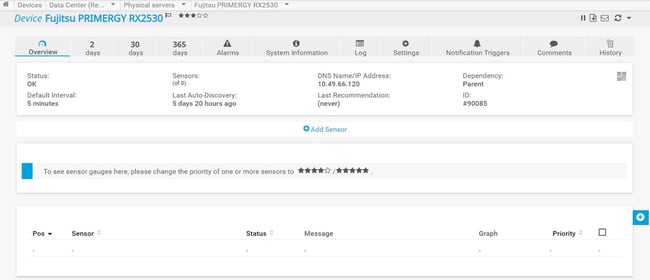
Add Fujitsu Primergy server to PRTG
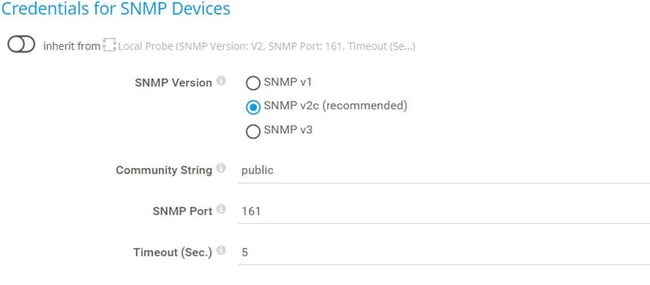
In case you don't use the default SNMP settings (community string and port), you need to configure SNMP settings on the parent device within PRTG („Fujitsu Primergy“> Settings>Credentials for SNMP Devices).
If you use the default SNMP credentials, there is nothing to change.
Step 3: Add SNMP Fujitsu System Health v2 sensor
The SNMP Fujitsu System Health v2 sensor monitors the status of a Fujitsu PRIMERGY server via iRMC and SNMP. As mentioned, the sensor might also work on other Fujitsu devices that have an iRMC available.
Please be aware that this sensor doesn’t support SNMP v1, but rather v2c and v3. This sensor supports IPv4 and IPv6 and it has very low performance impact.
This sensor uses lookups to determine the status values of one or more channels. This means that possible states are defined in a lookup file. You can change the behavior of a channel by editing the lookup file that the channel uses.
When you add sensors to your Fujitsu server, PRTG will do a meta scan and discover all available counters/components. As of iRMC v5, additional counters for physical disks and logical disks are supported.
This is what I see in my case running iRMC v5.
For each counter you select, PRTG will create dedicated sensors. In my case, I will select all available counters and start with the monitoring. Here are the metrics available within the sensors - if you open each of the screenshots, you will see available metrics and their status.
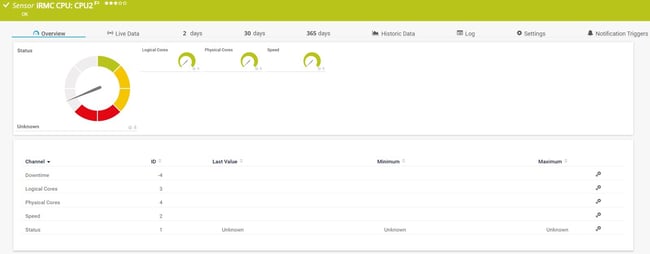 CPU
CPU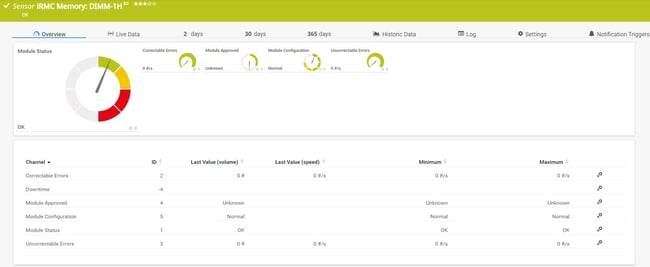 Memory DIM
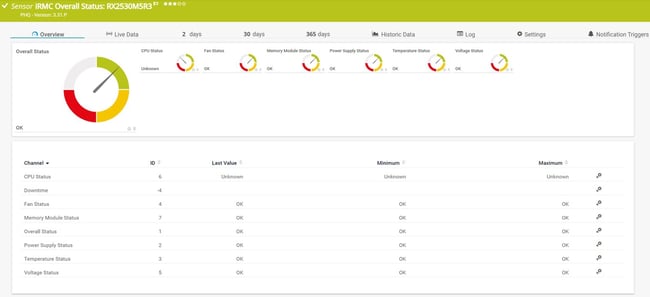 Overall Status
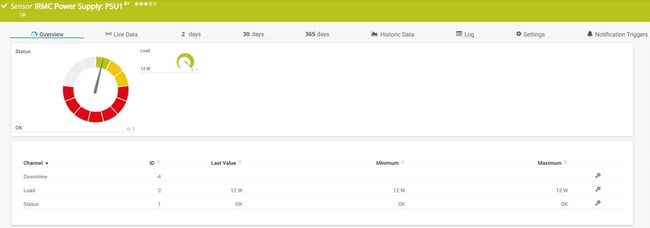 Power Supply Status
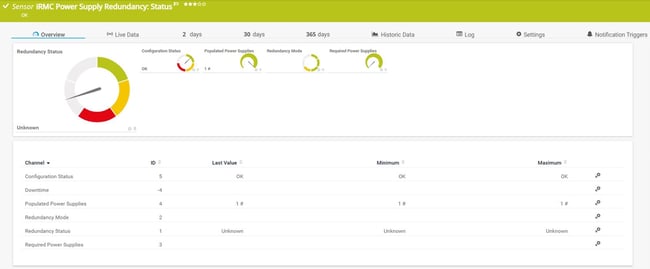 Power Supply Redundancy Status
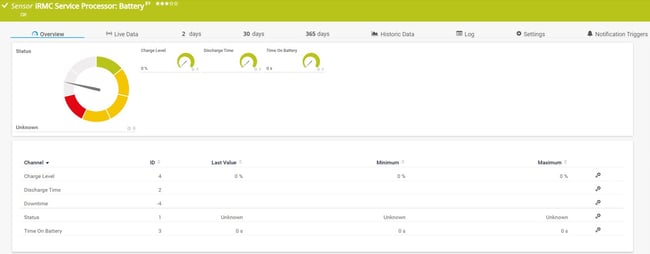 Service Processor: Battery
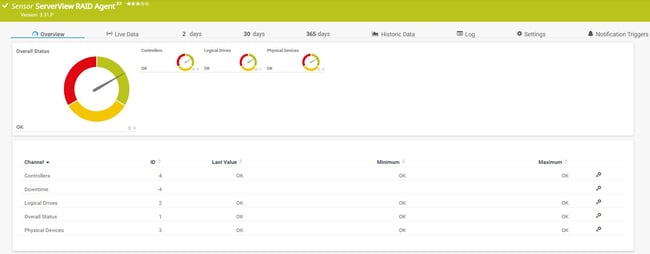 RAID Agent
That was it for this post! Thank you for reading this article. I am curious to know if you use this sensor and if you are happy with what you see.
You are welcome to connect with me via my LinkedIn and check out some tech content on my blog TechwithJasmin.com.
.jpg) Published by
Published by 