.jpg) Published by Jasmin Kahriman
Published by Jasmin Kahriman
Last updated on July 10, 2026
•
8 minute read
I had a chance to get to know Michael Dell, his journey and his achievements through his book Play Nice But Win: A CEO's Journey from Founder to Leader. I'm impressed by his start, evolution, understanding of the market, and what Dell is today.
Dell manufactured some of the most powerful and reliable hardware on the market. Small and big data centers are equipped with Dell servers and storage devices. Big vendors, such as VMware, are developing products on Dell hardware. One of them is VMC on Dell EMC. I wrote an article about it: Delivering cloud to your data center with VMware Cloud on Dell EMC.
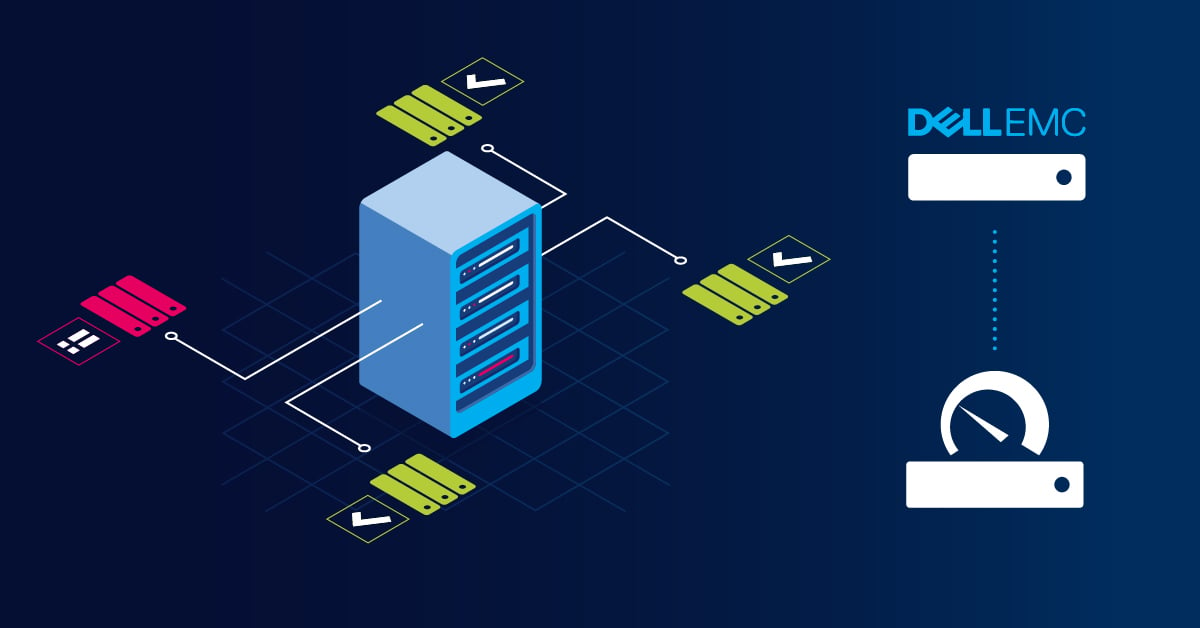
The article you are reading now is about monitoring Dell PowerEdge servers using PRTG. Whether you're managing a single server or an entire data center infrastructure, real-time observability of your server hardware is critical to prevent downtime and optimize performance.
We at Paessler understand how important it is for you to have native sensors that deliver actionable metrics on your Dell PowerEdge system health—from CPU and power supply status to firmware updates and physical disk conditions. This guide covers everything you need to monitor your Dell EMC PowerEdge servers effectively, including troubleshooting common issues.
This article will help you enable SNMP on your Dell PowerEdge, configure PRTG and start monitoring.
Note: You need to be running at least iDRAC 7 (introduced in 2012).

Step 1: Enable SNMP on iDRAC
PRTG Dell PowerEdge sensors are based on SNMP. That means you need to enable SNMP on your Dell PowerEdge via iDRAC. iDRAC is a Dell management interface used to configure your server and services.
iDRAC (Integrated Dell Remote Access Controller) provides remote access to your server hardware, allowing you to manage systems management tasks, monitor hardware metrics, and even reboot servers without physical access. For comprehensive monitoring across multiple Dell servers, you can also use Dell OpenManage Server Administrator (OMSA) or OpenManage Enterprise for centralized automation.
Depending on the version of iDRAC you use, SNMP settings may be located on a different UI path. In my case, I use iDRAC v9 (introduced in 2017).
- Login to your iDRAC via the web console.
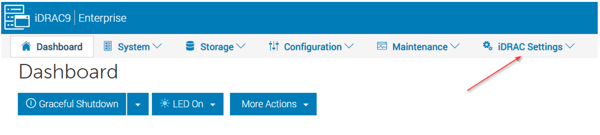
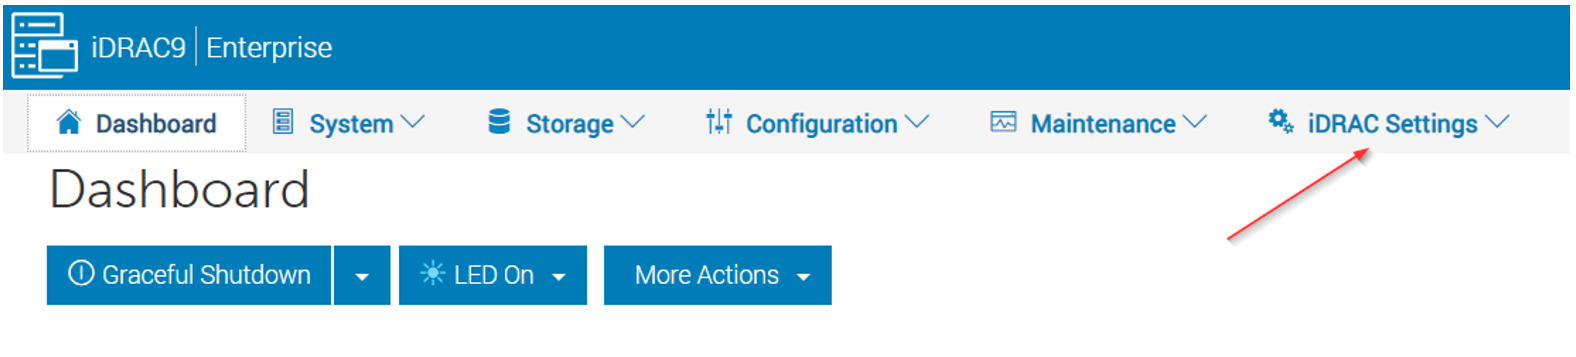
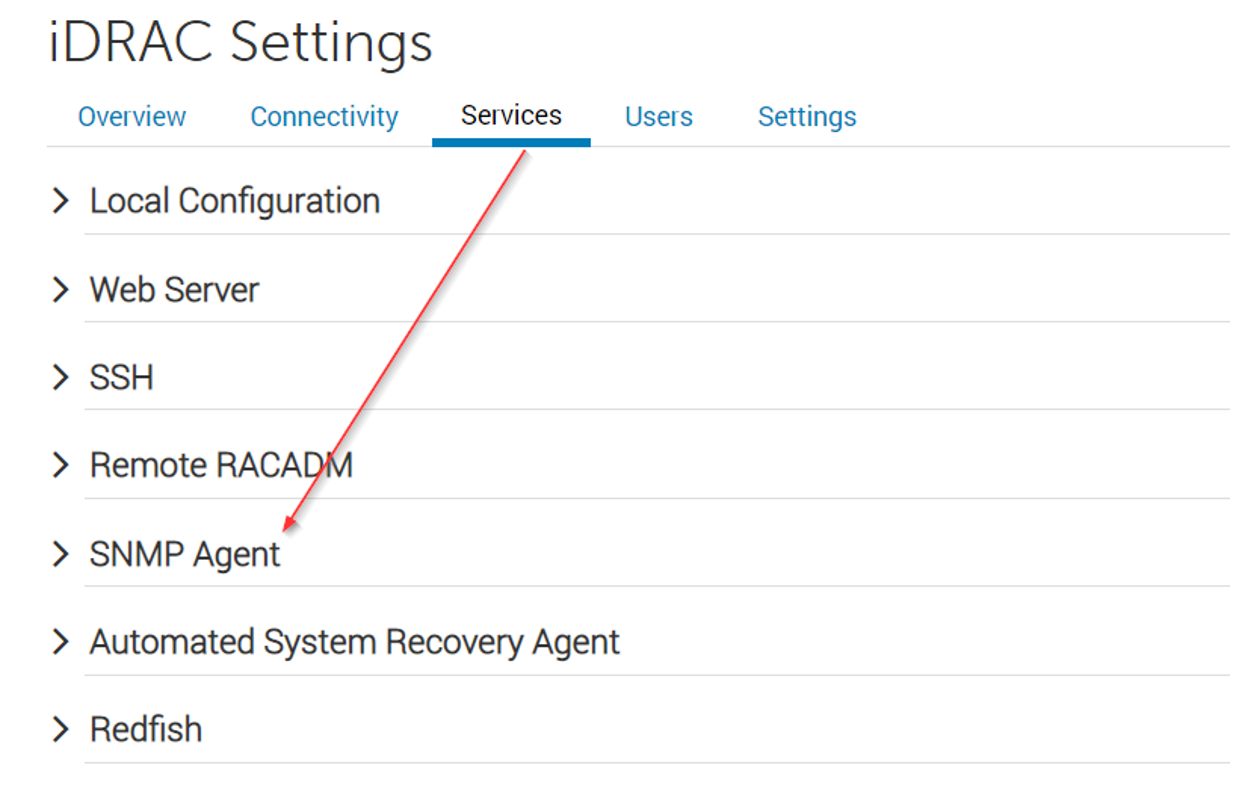
- Click on iDRAC Settings in the menu
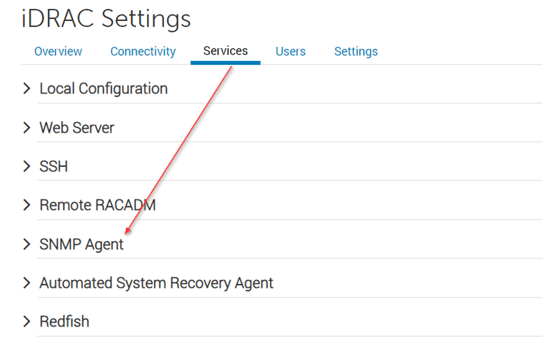
- Click on Services and then expand SNMP Agent.
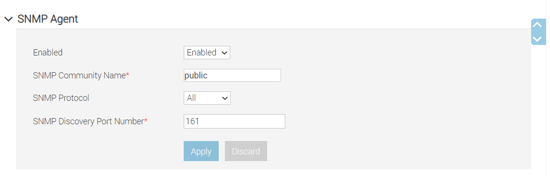
- Enable SNMP, configure SNMP community string, choose SNMP version, and configure SNMP port. iDRAC v9 supports SNMP v3. In my case, I'll go with SNMPv1/SNMPv2c.For enhanced security in production environments, consider using SNMP v3, which supports encryption and authentication. You can also configure SNMP traps to receive real-time alerts when hardware issues occur.
- Click Apply and sign out from your iDRAC web UI.

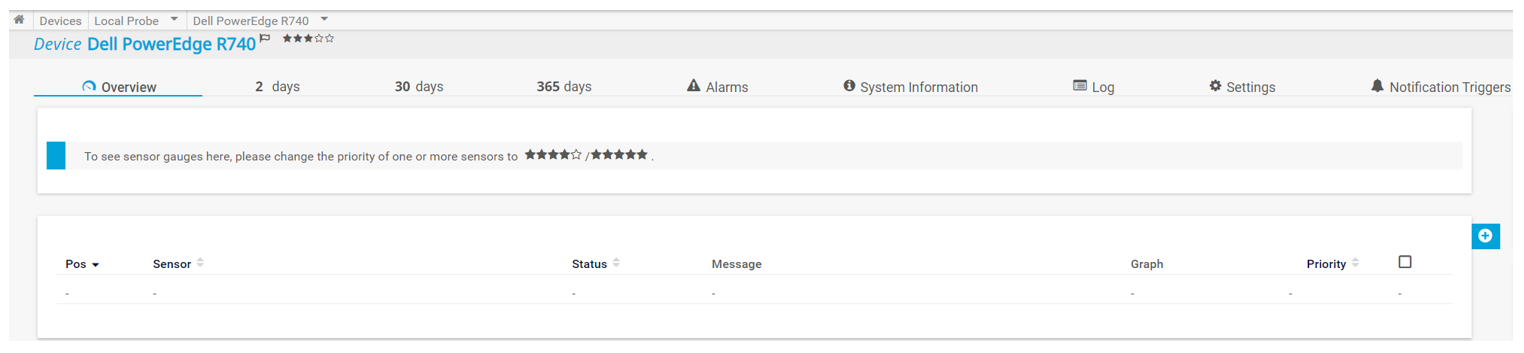
Step 2: Add Dell PowerEdge server to PRTG
In the second step, you need to add your Dell PowerEdge to your PRTG. You can use the IP or DNS name of your server. PRTG supports monitoring Dell PowerEdge servers running Microsoft Windows or Linux operating systems, making it flexible for heterogeneous environments.
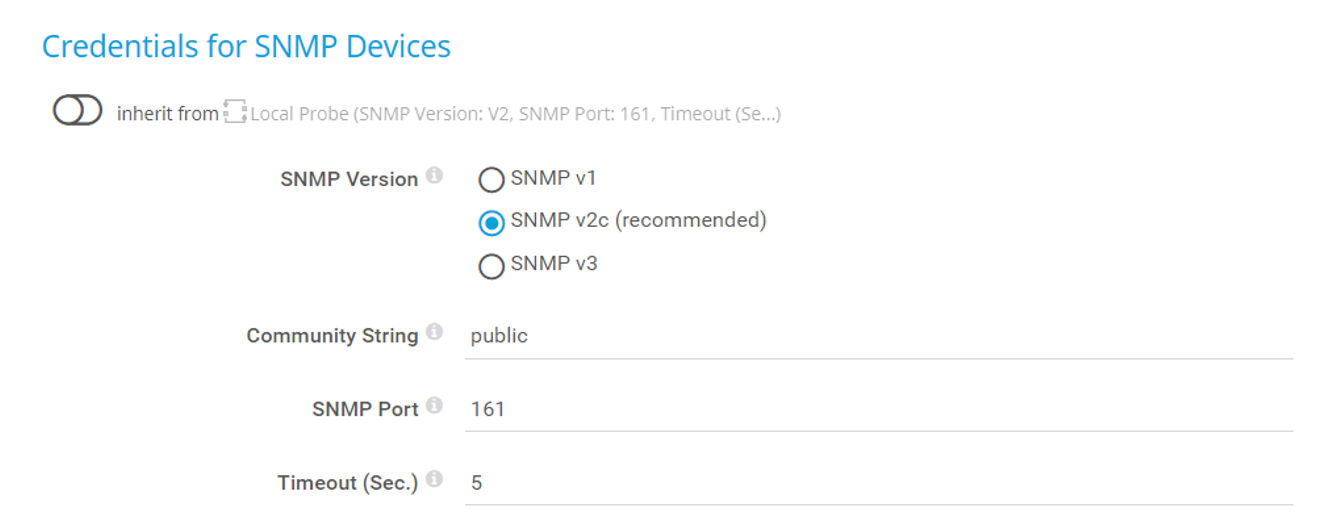
In case you don't use the default SNMP settings (community string and port), you need to configure SNMP settings on the parent device within PRTG („Dell PowerEdge" > Settings > Credentials for SNMP Devices).
If you use the default SNMP credentials, there's nothing to change.
Step 3: Add Dell PowerEdge System Health
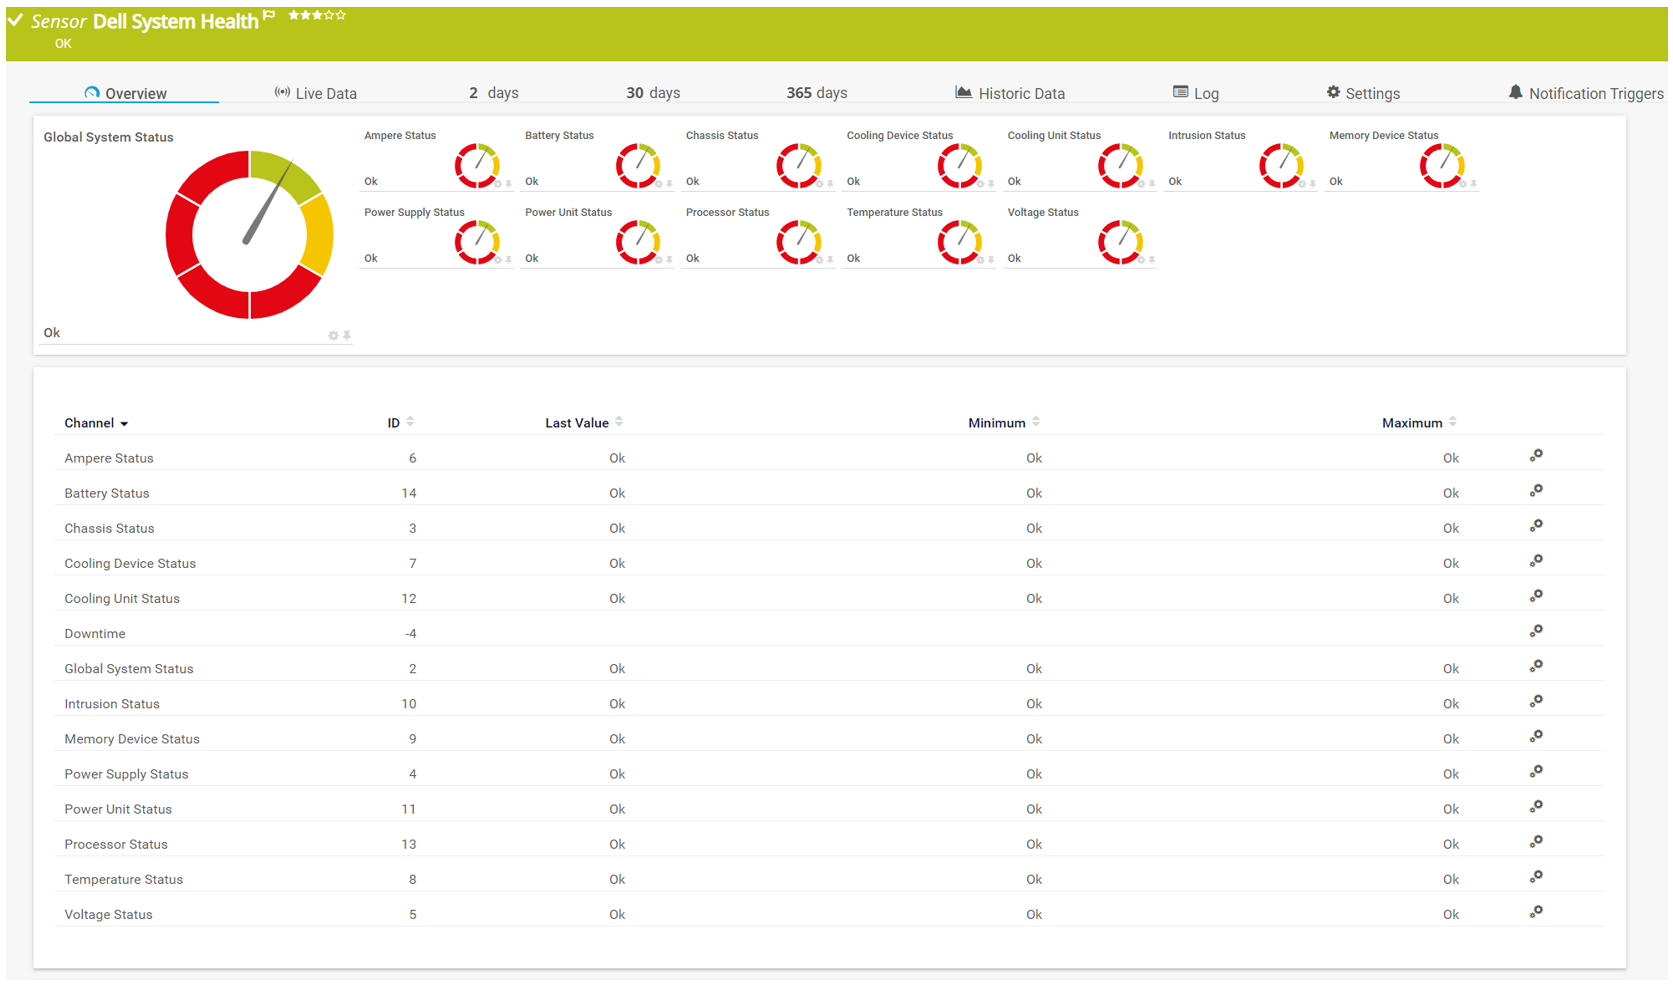
The SNMP Dell PowerEdge System Health sensor monitors the system health of a Dell PowerEdge server via SNMP.
It supports IPv4 and IPv6 and it has a very low performance impact. This sensor has predefined limits for several metrics. You can individually change these limits in the channel settings.
It shows the health state of the following components: processors, memory, power supply, cooling units, chassis, battery, ampere, intrusions, temperature, voltage and global system health.
All monitored metrics are displayed in PRTG's intuitive dashboard, giving you a centralized view of your Dell hardware health. The sensor provides real-time monitoring of critical components, helping you identify issues before they impact your infrastructure lifecycle.
In the ideal environment, you should see OK under the last measured value.
If there are any problems, you will get notified by PRTG.
Step 4: Add Dell PowerEdge Physical Disk
The second sensor you can use to monitor your Dell PowerEdge is Dell PowerEdge Physical Disk sensor. This sensor monitors a physical disk in a Dell PowerEdge server via SNMP.
Like the previous sensor, this one also supports IPv4 and IPv6 and it has a very low performance impact.
Once you add a sensor, PRTG will do a meta-scan and show all available physical disk drives within your servers. Select the ones you want to monitor. In my case, I selected the first three disks.
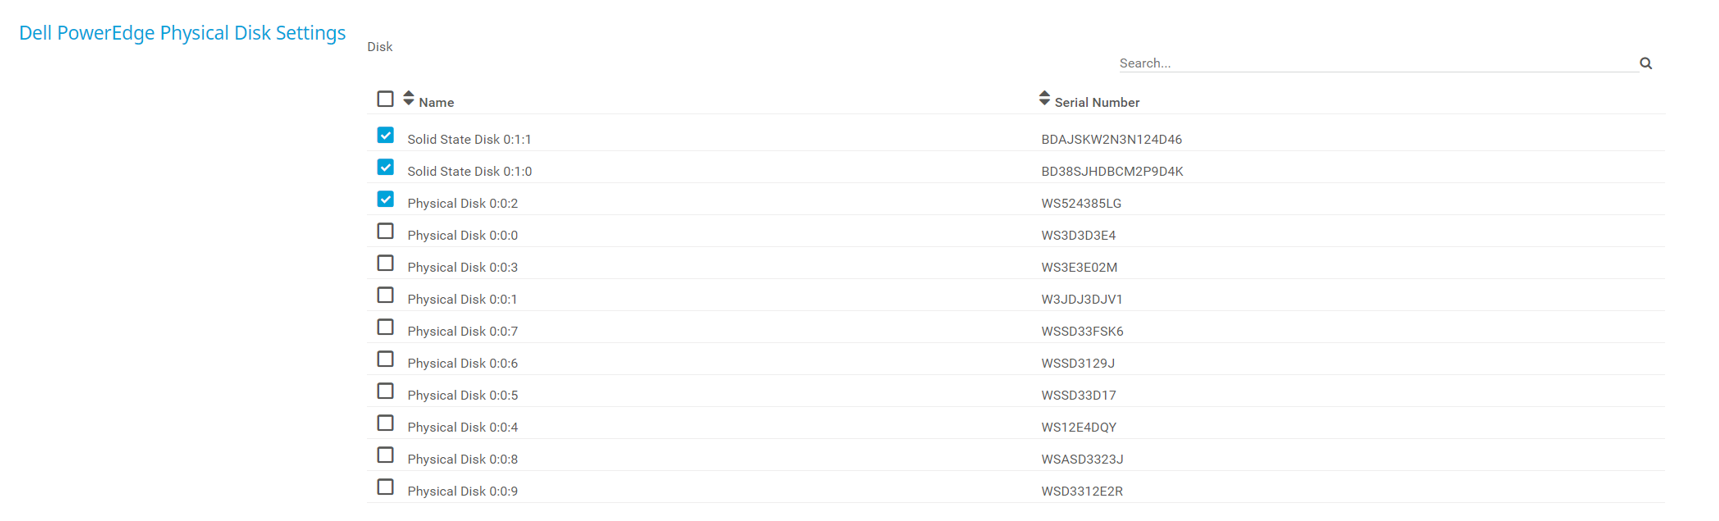
For each disk drive you select, PRTG will create a sensor. In other words, for three selected disk drives, you will have three sensors.
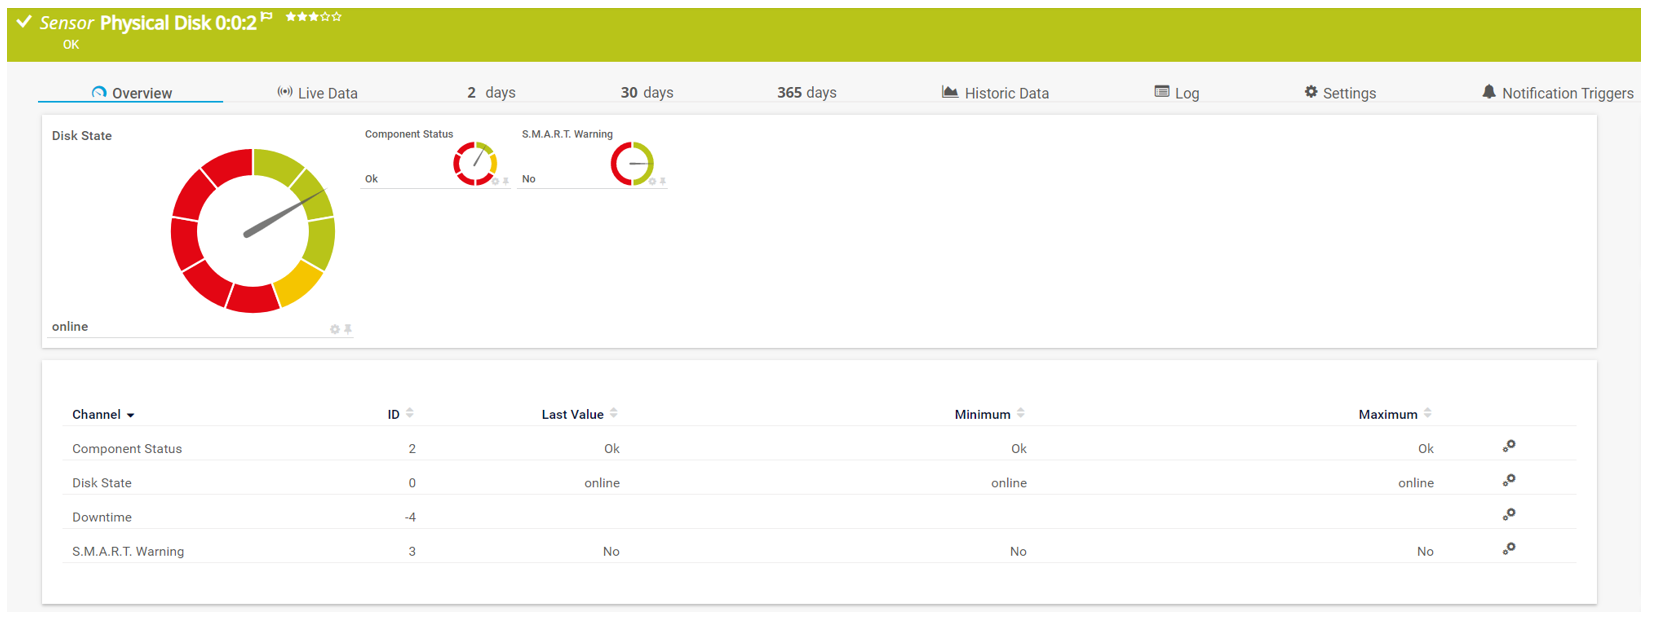
The sensor shows if the component status is healthy, if the disk is online or offline and if there are S.M.A.R.T Warnings.
Troubleshooting Common Dell PowerEdge Monitoring Issues
If you encounter issues while setting up monitoring for your Dell PowerEdge servers, here are common solutions:
SNMP Not Responding
- Verify SNMP is enabled in iDRAC Settings > Services > SNMP Agent
- Check that your firewall allows SNMP traffic (default port 161)
- Confirm the SNMP community string matches between iDRAC and PRTG
- For iDRAC9 and newer, ensure SNMP is enabled for both the iDRAC and the operating system
Sensors Not Discovering
- Ensure you're running at least iDRAC 7 (2012 or newer)
- Verify Dell OpenManage Server Administrator (OMSA) is installed if monitoring via the OS
- Check that the correct IP address is configured in PRTG
- Try using RACADM command-line tool to verify iDRAC configuration:
racadm get iDRAC.SNMP
Missing Hardware Metrics
- Some metrics require specific firmware versions—update your iDRAC firmware to the latest version
- Certain advanced monitoring features may require Dell OpenManage Enterprise for full functionality
- For API-based monitoring, verify that the Redfish API is enabled in iDRAC9
For additional information on monitoring Dell infrastructure, explore our guide on server hardware monitoring.
Frequently Asked Questions About Dell PowerEdge Monitoring
What is the best way to monitor Dell PowerEdge servers?
The most effective approach is using SNMP-based monitoring through iDRAC combined with PRTG's native Dell PowerEdge sensors. This provides comprehensive visibility into system health, physical disks, power supply, CPU, and other critical hardware components without requiring agents on the operating system.
Can I monitor multiple Dell PowerEdge servers from a single dashboard?
Yes, PRTG allows you to monitor your entire Dell infrastructure from a centralized dashboard. You can add multiple Dell PowerEdge servers as devices and apply the System Health and Physical Disk sensors to each one, giving you unified observability across your data center.
Do I need Dell OpenManage to monitor PowerEdge servers with PRTG?
For basic SNMP monitoring through iDRAC, Dell OpenManage Server Administrator (OMSA) is not required. However, installing OMSA provides additional metrics and monitoring capabilities. For enterprise-scale automation and lifecycle management, consider Dell OpenManage Enterprise.

I hope you enjoyed reading this article. I welcome you to read my blog TechwithJasmin.com and I'm looking forward to connecting with you on LinkedIn.