.jpg) Published by Jasmin Kahriman
Published by Jasmin Kahriman
Last updated on April 01, 2026
•
9 minute read
From 2006 to 2018, IBM’s System X architecture has provided the highest performance and reliability out of any x86 servers in the industry. In 2005, IBM sold its x86 server business to Lenovo for $2.3 billion.
We at Paessler still have customers using IBM System X, so this article definitely makes sense. PRTG provides you with four native sensors to monitor the health state of your IBM System X servers. You can monitor the overall health state, the physical and logical disk, and physical memory.
I’ll guide you through how to enable SNMP on your IBM System X, configure PRTG and start monitoring.
In my previous article, I explained how to enable SNMP on Dell PowerEdge and monitor your server with PRTG. This post covers the same thing, but this time for IBM System X servers. Let's dig into it.
Step 1: Enable SNMP via IMM
PRTG sensors for monitoring IBM System X servers are based on SNMP. That means you need to enable SNMP within IMM. IMM stands for Integrated Management Module and it is used to configure your IBM server and services.
Depending on the version of IMM firmware you use, SNMP settings may be located in a different location on the UI. I use IBM IMM 2.
1. Login to your IMM interface via the web console.
2. Click on IMM Management in the main menu and then click Network.
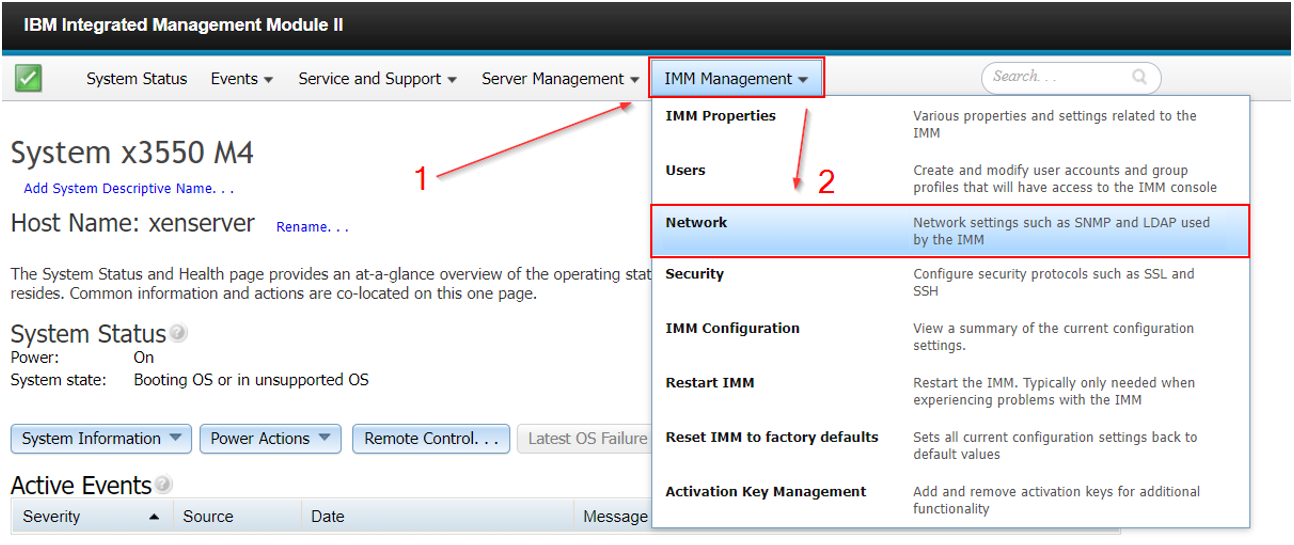 IMM Management > Network
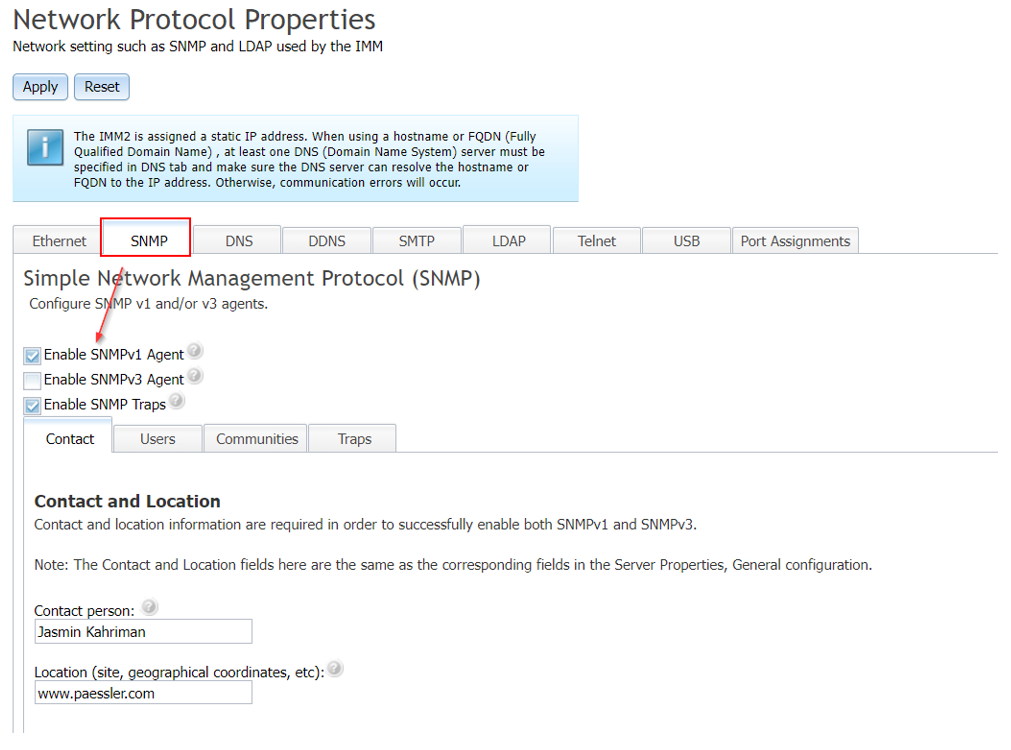
3. Click on SNMP.
4. Enable the SNMP version you want to use. In my case, my server supports SNMP v1 and SNMP v3. I use SNMP v1. Once you are done, click Apply.
 Network Protocols> SNMP
5. Click on Communities to configure the community string and IP. You need to add community name (public is the default one), choose the access type and allow only a specific host to query your IBM System X server (add your PRTG server IP).
Access type includes get, set and trap modes.
In my case, I can enable two more community names. For example, you can use Community 2 if you want to enable SNMP trap.
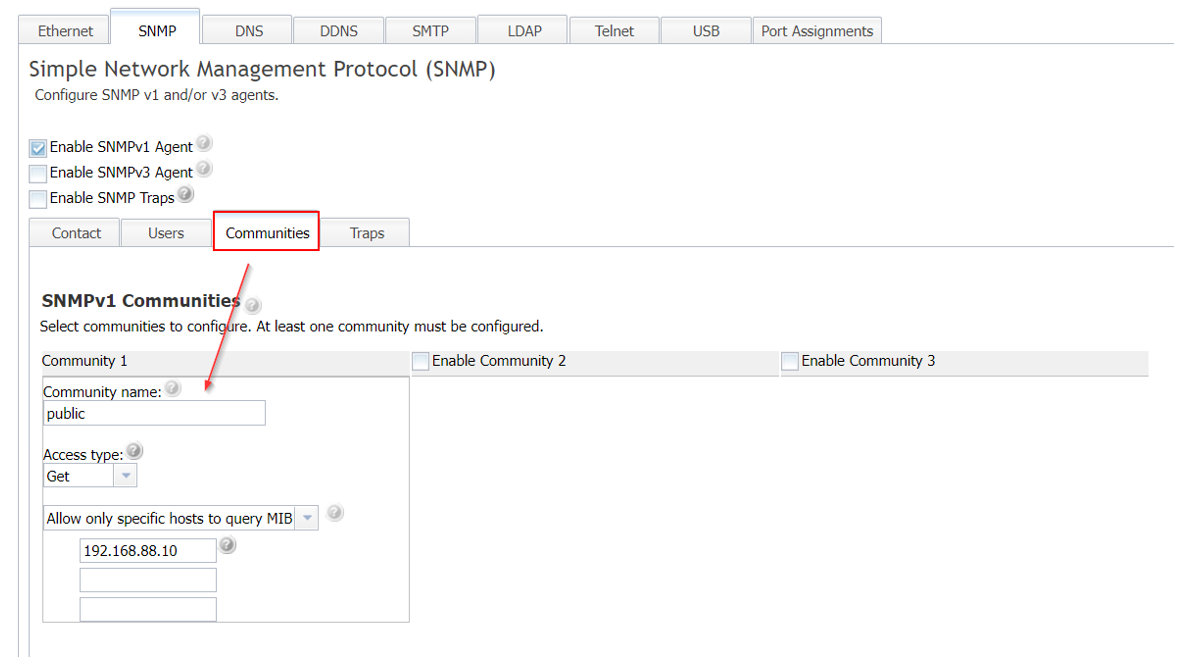
Configure SNMP community string
6. Click Apply and close your IMM web UI.
Step 2: Add IBM System X server to PRTG
In the second step, you need to add your IBM System X server to the PRTG device tree. You can use the IP or DNS name of your server.
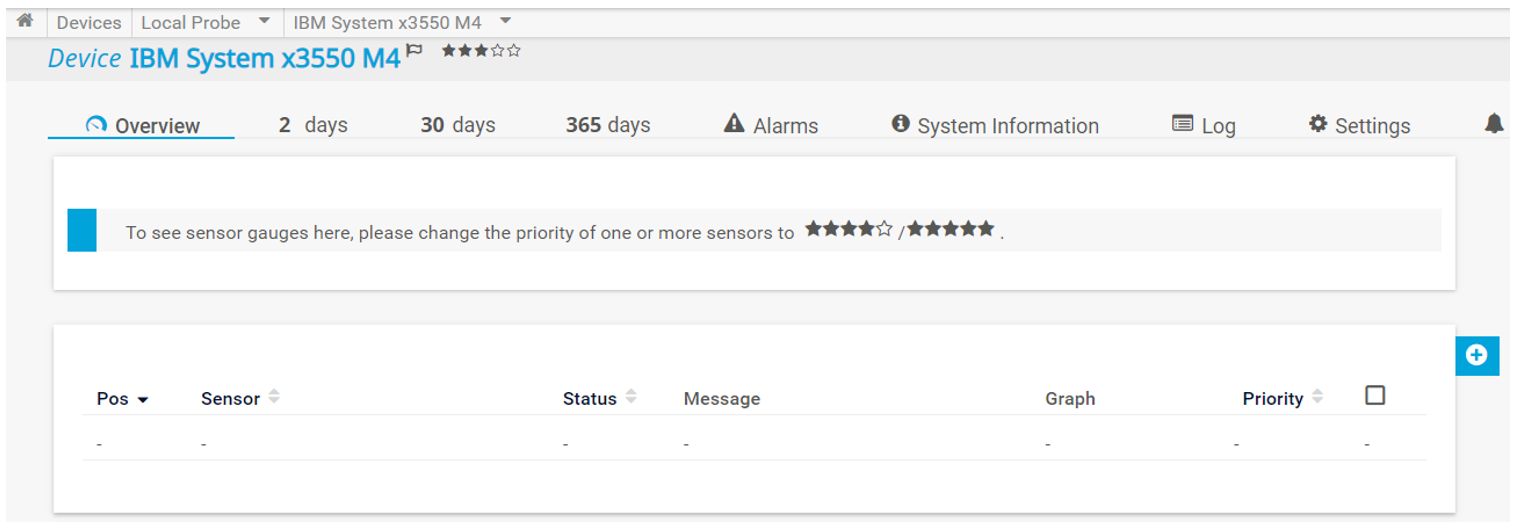
Add IBM System X server to PRTG
In case you don't use the default SNMP settings (community string and port), you need to configure SNMP settings on the parent device within PRTG („IBM System x“ > Settings > Credentials for SNMP Devices).
If you use the default SNMP credentials, there is nothing to change.
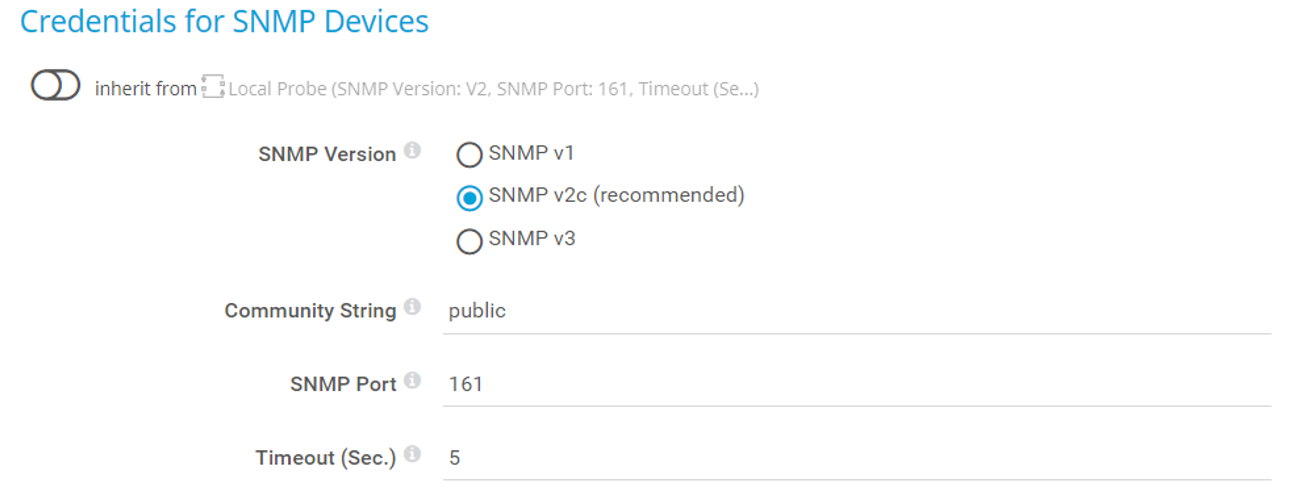
Credentials for SNMP
Step 3: Add the IBM System X System Health sensor
The IBM System X System Health sensor monitors the system health of an IBM device via SNMP.
This sensor requires the IBM Systems Director Platform Agent to be installed on the target device. It can also run directly on an IMM network port and can show the overall health of IMMs.
It support IPv4 and IPv6 and it has a very low performance impact. The SNMP IBM System X System Health sensor monitors the system health of an IBM device via SNMP.
Once you add it to your IBM System X server, PRTG will offer you to select different measurements (depending on your server). In my case, I can choose overall health, voltages, temperature, and fans.
For each measurement you select, PRTG will create a sensor:
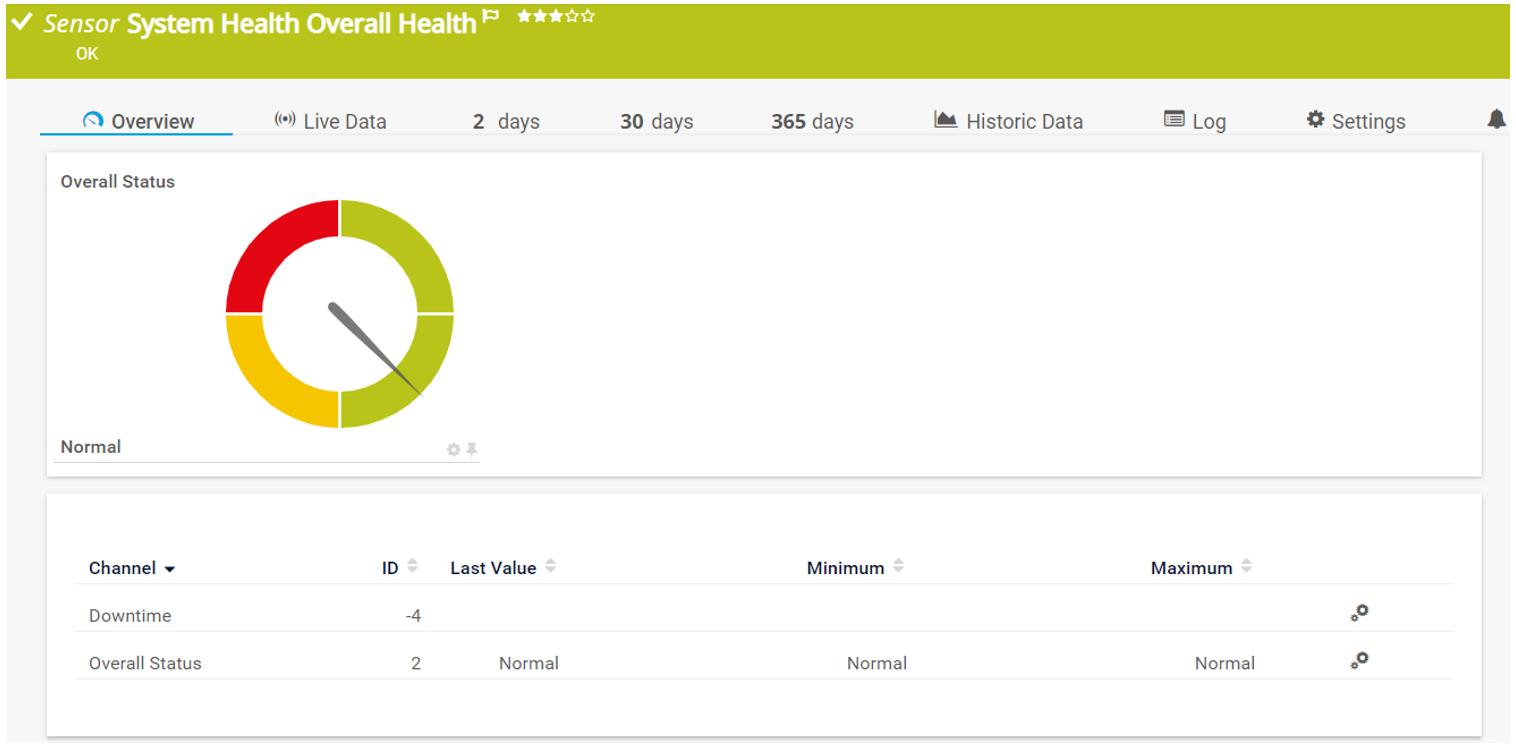
System Health Overall Health
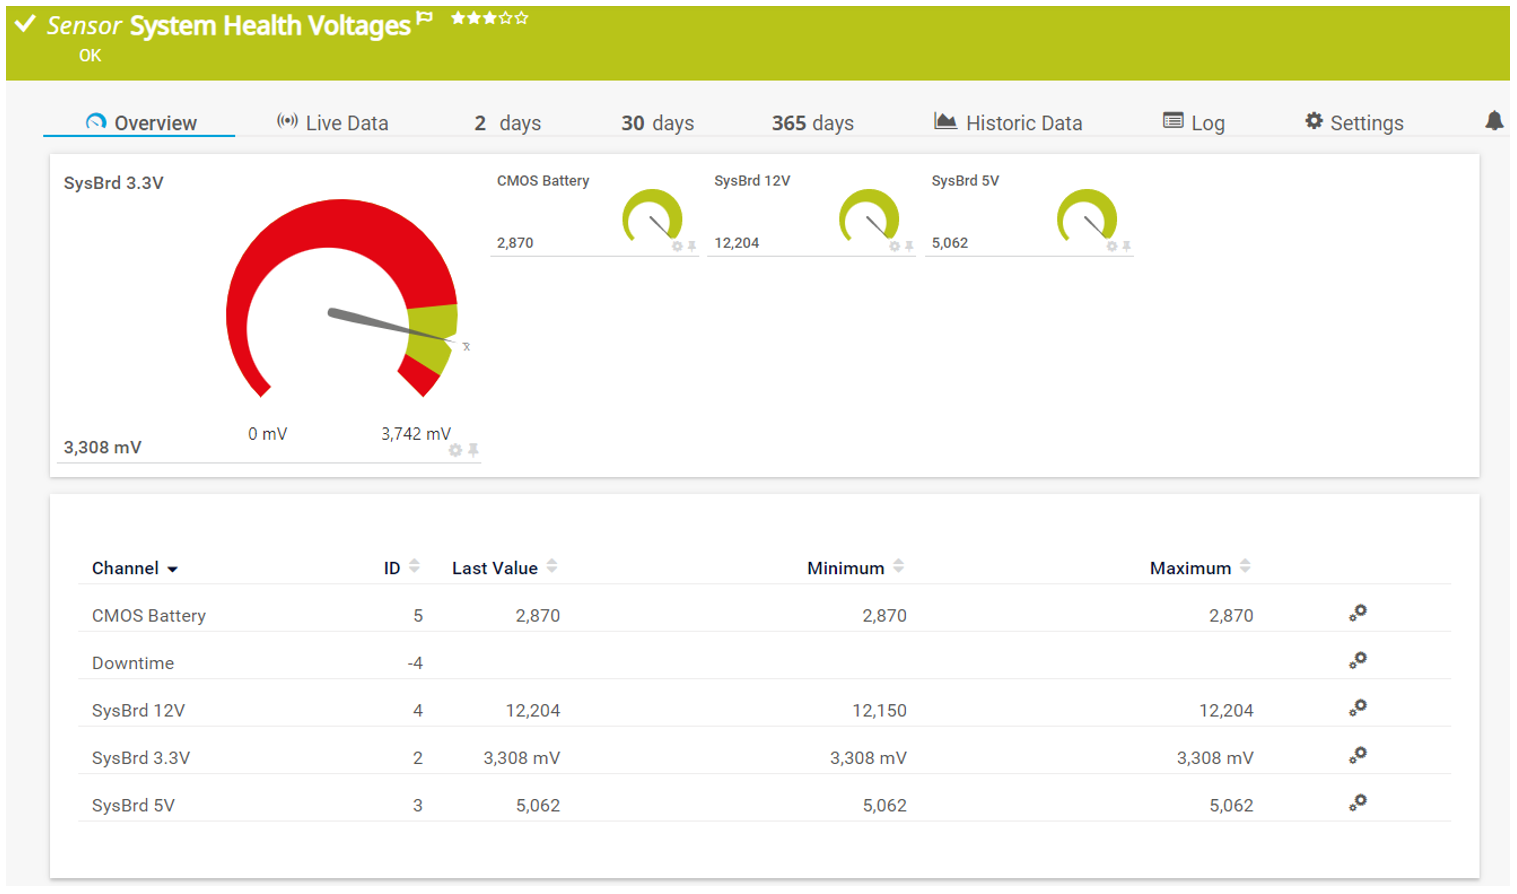
System Health Voltages
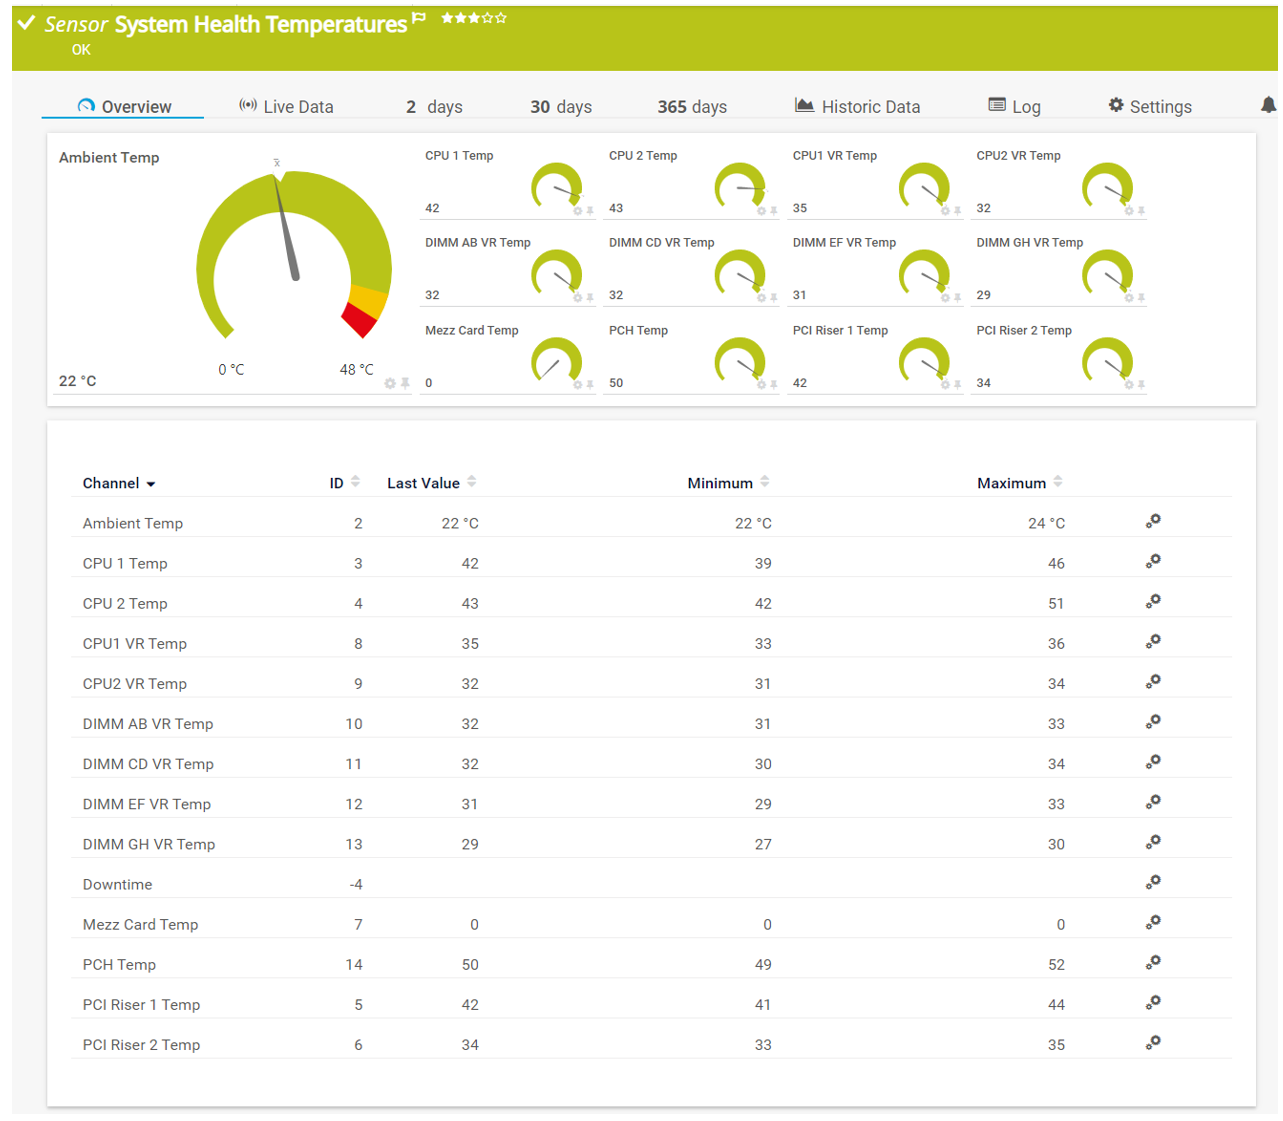
System Health Temperatures
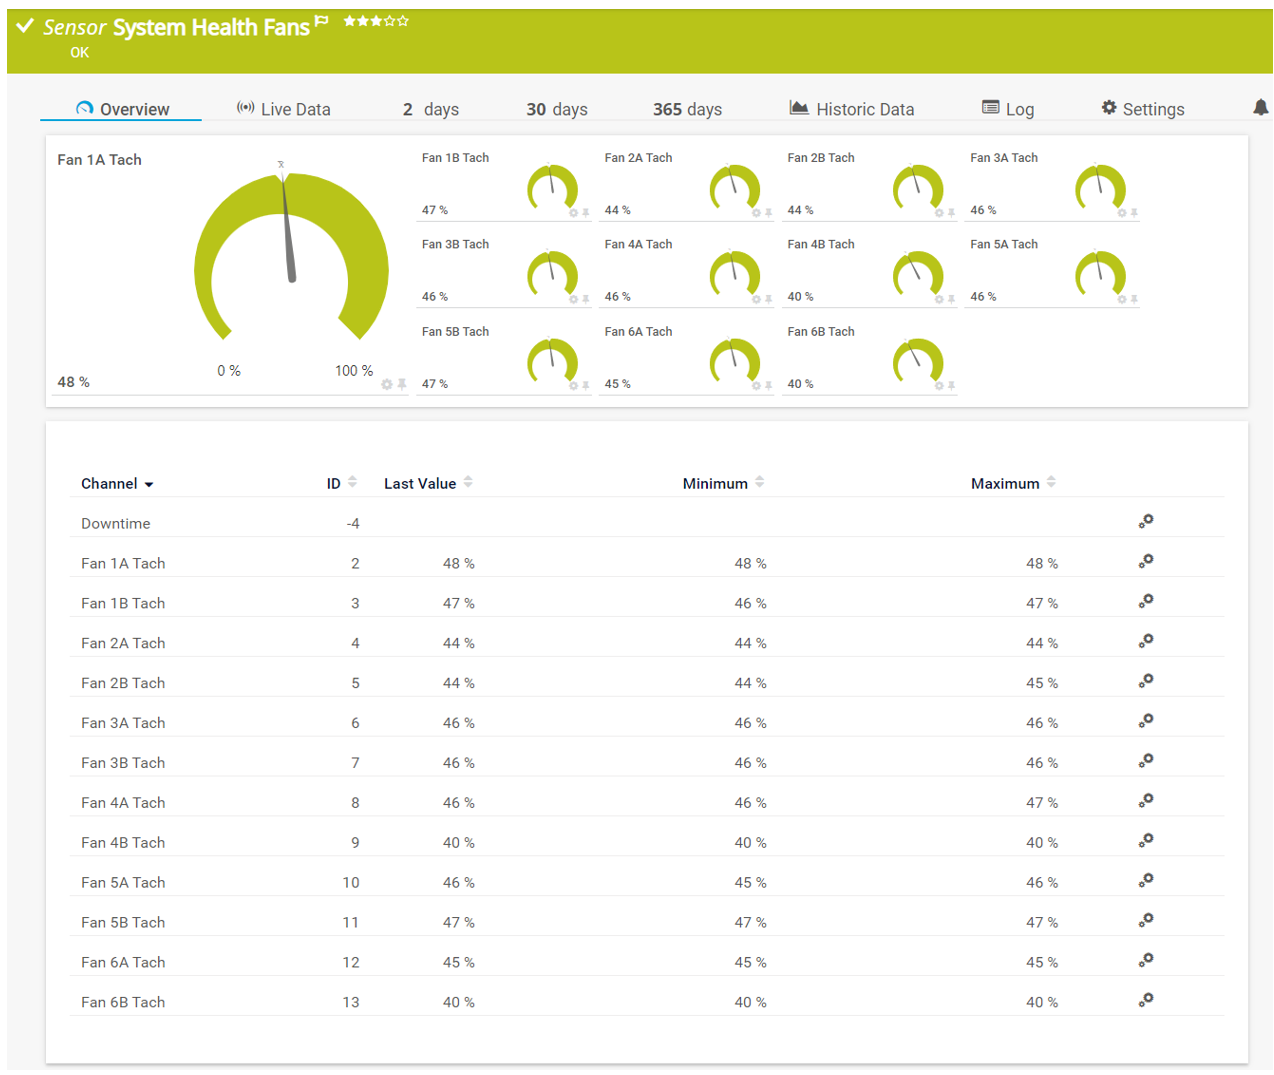
System Health Fans
Step 4: Add the IBM System X Physical Memory sensor
The second sensor you can use to monitor your IBM System X is SNMP IBM System X Physical Memory Sensor. This sensor monitors the memory modules in an IBM server via SNMP.
It requires IBM Systems Director Platform Agent to be installed on the target device.
Like the previous sensor, this one also supports IPv4 and IPv6 and it has a very low performance impact.
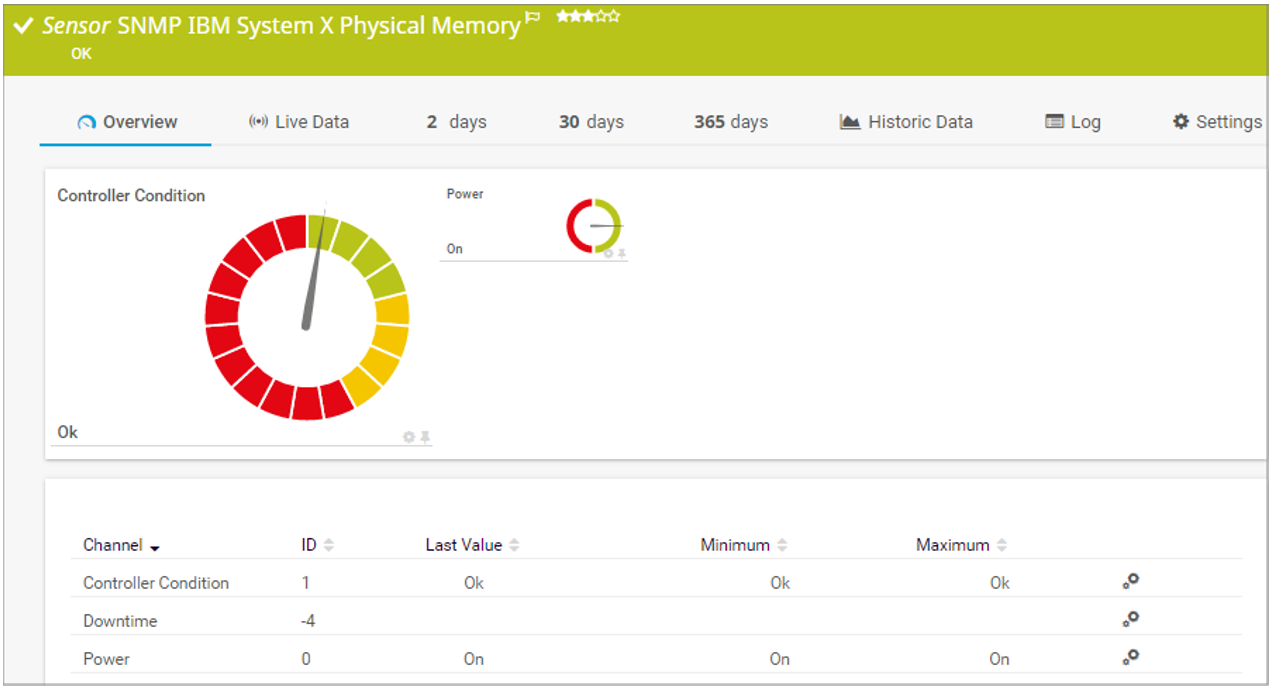
IBM System X Physical Memory sensor
This sensor uses lookups to determine the status values of one or more channels. This means that possible states are defined in a lookup file. You can change the behavior of a channel by editing the lookup file that the channel uses.
Step 5: Add the IBM System X Physical Disk sensor
The IBM System X Physical Disk sensor monitors a physical disk in an IBM server via SNMP.
It requires IBM Systems Director Platform Agent to be installed on the target device.
Like the previous sensor, this one also supports IPv4 and IPv6 and it has a very low performance impact.
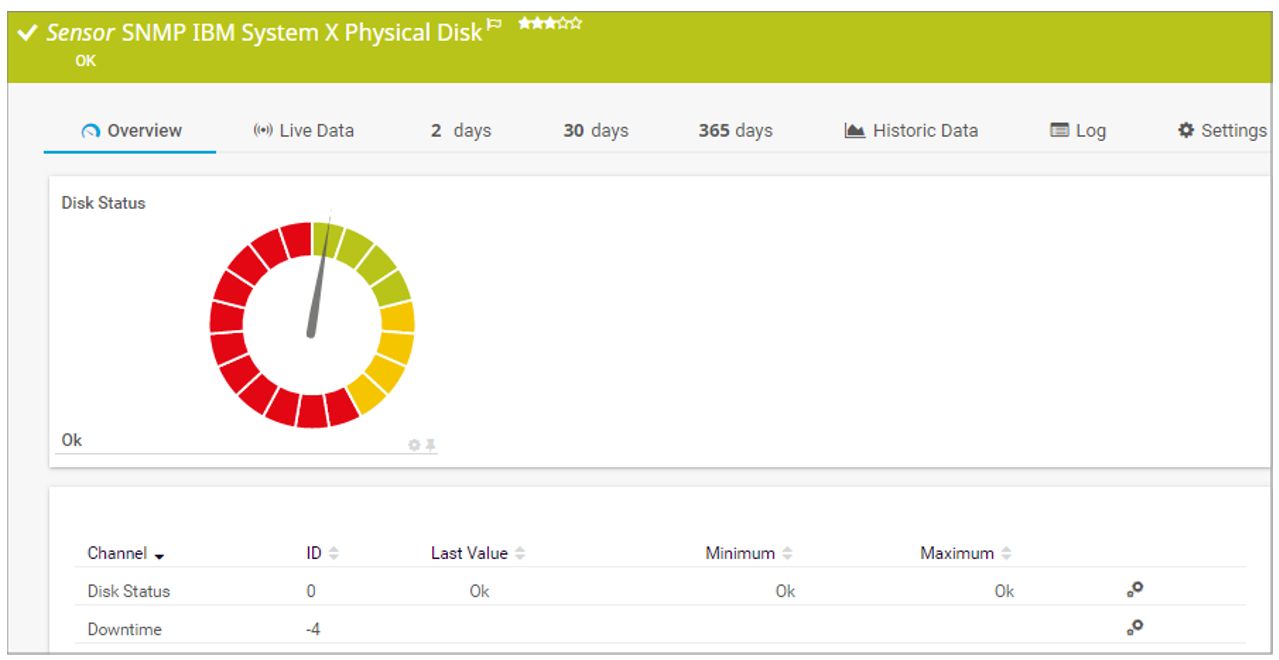
IBM System X Physical Disk sensor
Step 6: Add the IBM System X Logical Disk sensor
The IBM System X Logical Disk sensor monitors a logical disk in an IBM server via SNMP.
It requires IBM Systems Director Platform Agent to be installed on the target device.
Like the previous sensor, this one also supports IPv4 and IPv6 and it has a very low performance impact.
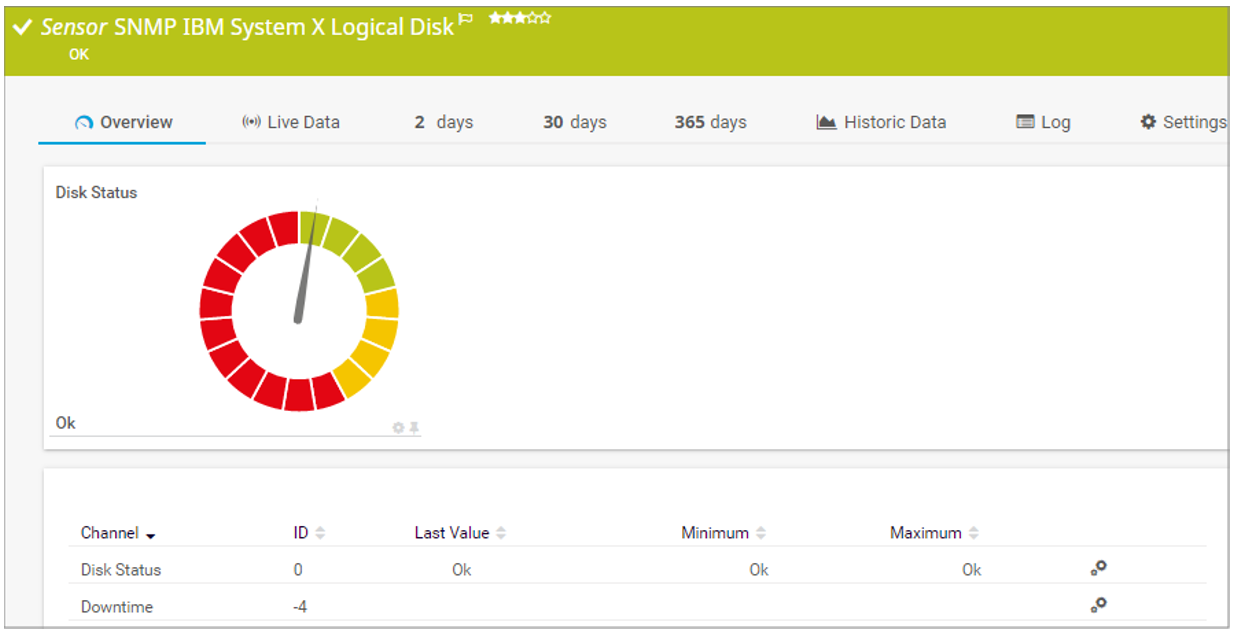
IBM System X Logical Disk sensor
Quite straightforward, isn't it? We would love to hear your feedback.
I hope you enjoyed reading this article. You're welcome to read my blog TechwithJasmin.com and I’m looking forward to connecting with you via LinkedIn.