 Published by Patrick Gebhardt
Last updated on March 29, 2022
•
7 minute read
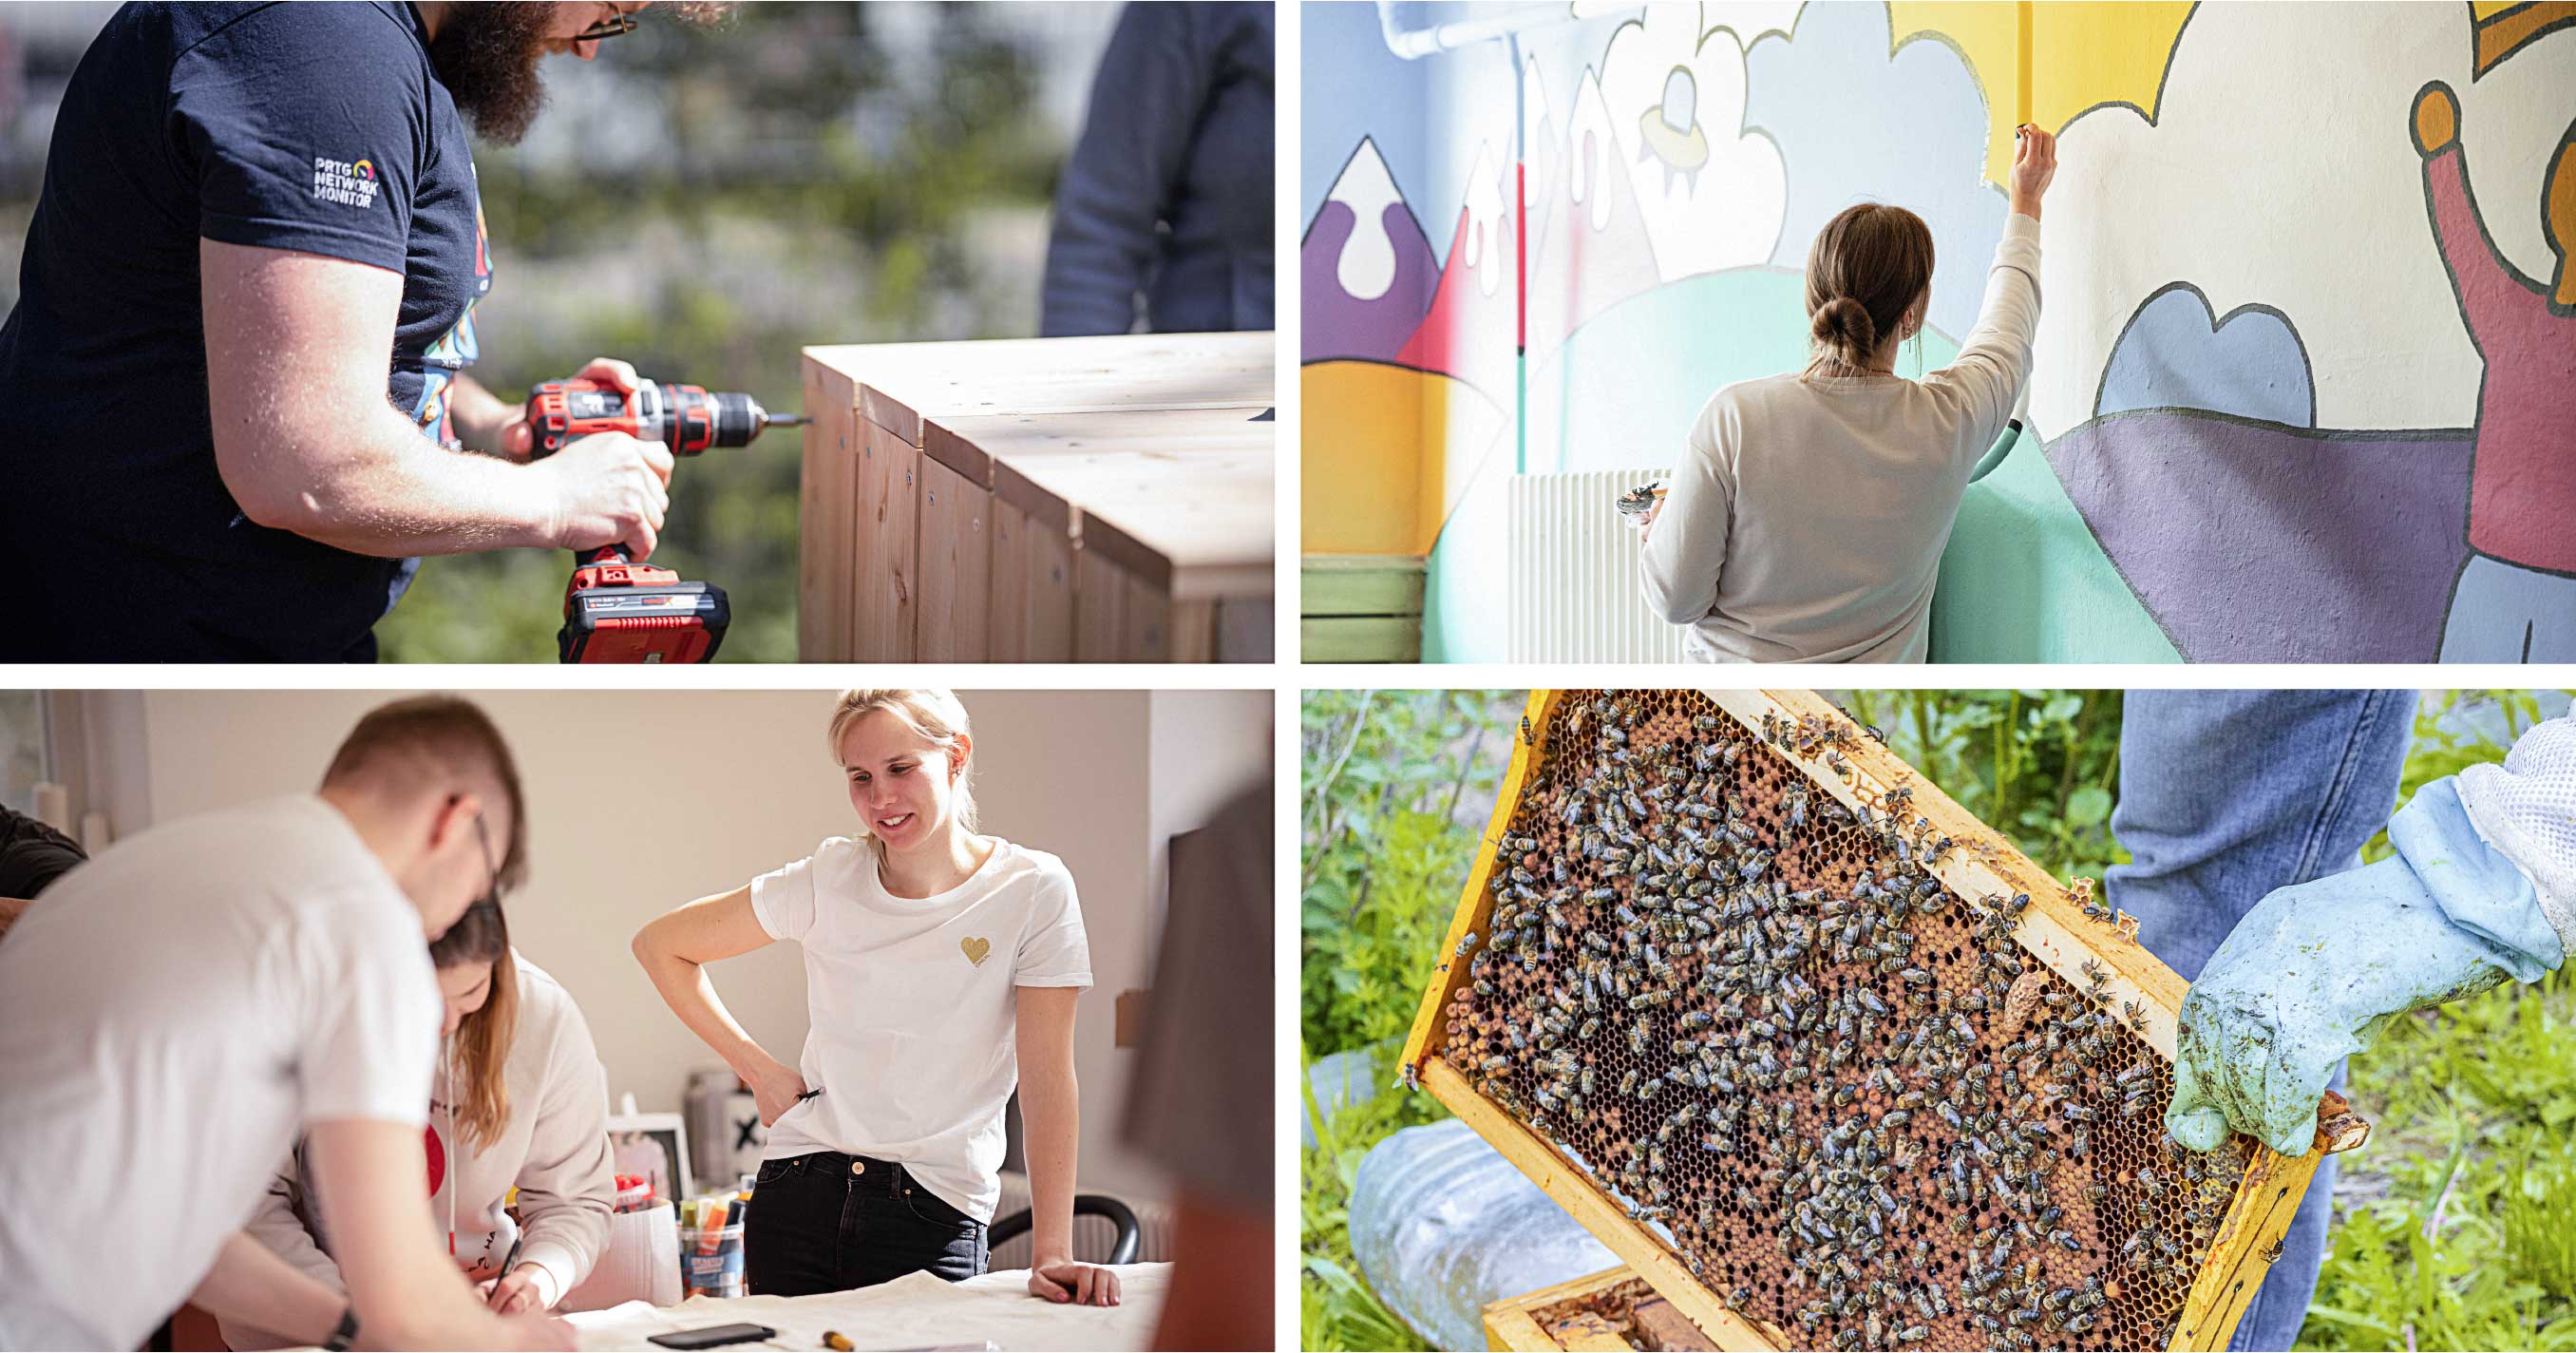
So, what happened to the photovoltaic system on our company roof? In short: It is still there. In a little longer: We couldn't be happier that we as a company are reducing our footprint on this earth by generating a significant portion of the electricity we use. We have been tracking our photovoltaic system, its output and our specific consumption for over a year now, and would like to give you a brief overview of our many insights.
The amount of CO₂ that is pumped into the air annually per person obviously depends largely on how people live and where they live. The average human being on earth causes* 5 tons of CO₂ emissions per year, which is already quite a lot, but as you might expect, we steadfast and happy-go-lucky consumers of the first world exceed this value. Many times over. In Germany, each citizen causes about 9 tons of CO₂ emission per year**; in the USA, the figure is 16 tons. In the last 365 days, by operating our PV system, we have saved almost 60 tons of CO₂. This is equivalent to the emissions that more than 6 Germans cause per year, by doing German stuff, like trimming lawn to uniform heights, getting their car polished for the second time in a week, or buying groceries when the weekend is approaching as if the world is going to end.
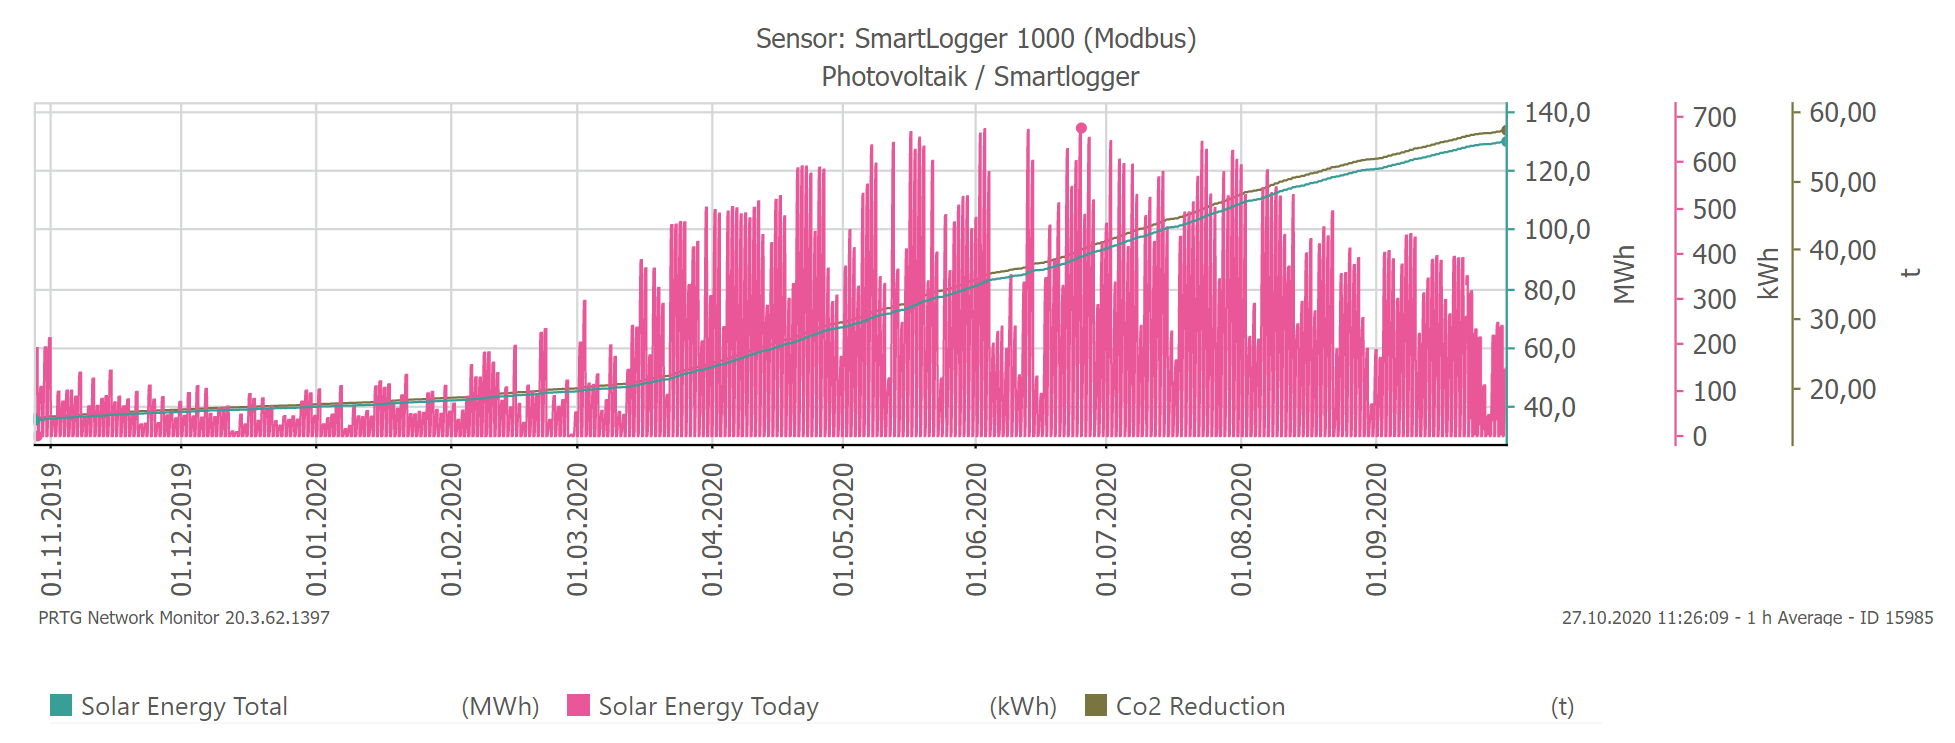
But let's have a look how this whole solar thing looks in PRTG Network Monitor. Regarding the last 12 months, we see here the total amount of produced solar energy in MWh, the selective daily output in kWh, as well as the overall CO₂ reduction in t:
🌤️ To generate consistent power throughout the day, we have set our PV system in an east/west direction. Here's another screenshot we took before noon on a day at the end of October. The shown output was just about 19.8 kW, which would be expected for this time of day in October:
.png?width=3762&name=MicrosoftTeams-image%20(1).png)
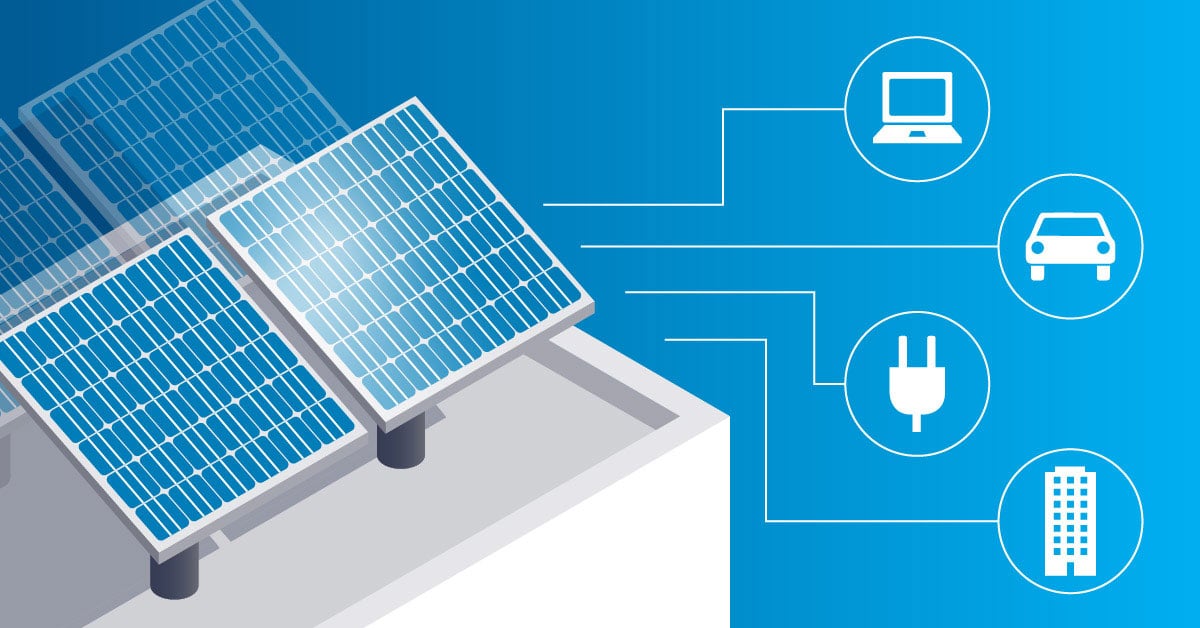
🔌 We have also taken a good hard look at our electricity bill and discovered that, depending on the billing period, we generate between a third and half of the electricity consumed in our Nuremberg HQ. We based our calculations mainly on the electricity consumption of 2019, otherwise the particular situation with remote work in 2020 would have resulted in different values. However, since we did not generate solar energy for the whole of 2019, and 2020 was so horribly 2020, the figures will be much clearer when we have had the opportunity to live out our three new work models for a longer period.
🚗 As an additional incentive to change one's own mobility behavior, we at Paessler offer each employee the opportunity to charge their electric car at our two charging stations. For free. Since this offer is well received, we will probably soon upgrade to three charging stations. Here is a monthly overview of loads (the sudden drop in Spring was of course due to the nationwide lockdown in Germany and the subsequent remote work time, which, excluding a short break, continues today):
.png?width=3748&name=MicrosoftTeams-image%20(2).png)
And the specific values of our two charging stations can best be seen here:
.png?width=2736&name=Screenshot_2020-10-29%20EV%20IT%20PRTG%20(PHQ-PRTG-01).png)
Based on the assumption that an average electric car uses about 15 kWh per 100 km, the charged 5656 kWh on our two charging stations results in a range of 37,706 km that our employees traveled by car with the electricity generated in our HQ. What is also worth mentioning: Other means of electric mobility, such as e-bikes, e-scooters, or e-longboards may be charged for free in our HQ as well and are not included in the numbers above.
🌿 Data can show us the world and our situation as it is. For this article, I interviewed my esteemed colleague Patrick Niedermayer, who understands more about environmental issues than anyone else I know. He told me that by acting consciously, he managed to reduce his average personal consumption to 5 tons of CO₂ per year. He recommended that I also calculate my consumption value based on my personal behavior on one of the many sound websites (or even Apps). My value was much higher.
💪 Continuing our strides to be an environmentally-conscious company, we are already climate neutral, and it is part of our purpose to further consolidate this and become climate negative in the long run.***
As you can see, we've learned a lot in just one year. But, good deeds do not need communication! That's why you don't hear about this from us us every week. However, when there are exciting new data evaluations from PRTG, we cannot hold back. But this passion of ours is already world famous. 😉
i🤷♂️ Okay, it's not quite that simple but you didn't think it would be, did you? To what has been mentioned above, I have to add the following:
* It is not easy to estimate what each citizen of a specific country consumes, and even the average figure is usually determined only on the basis of the overall social and economic picture. Our actions and consumer behavior are embedded in the processes that take place around us. Therefore this value refers to the total emissions of a country divided by the number of inhabitants, slightly corrected by various factors. The fact that countries such as Qatar, Kuwait, and Bahrain produce the highest emissions per capita is therefore basically not attributable to the consumer behavior of their inhabitants.
** CO₂ is the most important, but not the only chemical compound that is becoming a danger to us. Among others, there are methane and laughing gas, the latter being not half as funny as it suggests. All these compounds add to the CO₂ emission, which is often referred to as carbon dioxide equivalent (CO₂e). This, then of course higher, value has been slightly above 11 tons per capita in Germany for years now.
*** Climate-neutral essentially refers to compensating for the amount of CO₂(e) caused by the entire business operation. Climate-negative means that you compensate more than you consume and this (at least that's how we understand it) in hindsight for the entire history of the company. Compensation can be done in different ways and (still) very rarely means that you actually filter CO₂ out of the air. Most compensation is done by (non-profit) organizations such as atmosfair, which supports climate protection projects by means of a compensation calculator and the payment of a corresponding fee.