 Published by Michael Becker
Last updated on March 24, 2025
•
7 minute read
Are you maximizing the efficiency of your IT infrastructure? Understanding and monitoring the layers of the OSI model can be your secret weapon in optimizing network performance. With Paessler PRTG, you can keep a watchful eye on each layer to ensure that everything from physical hardware to network traffic is running smoothly.
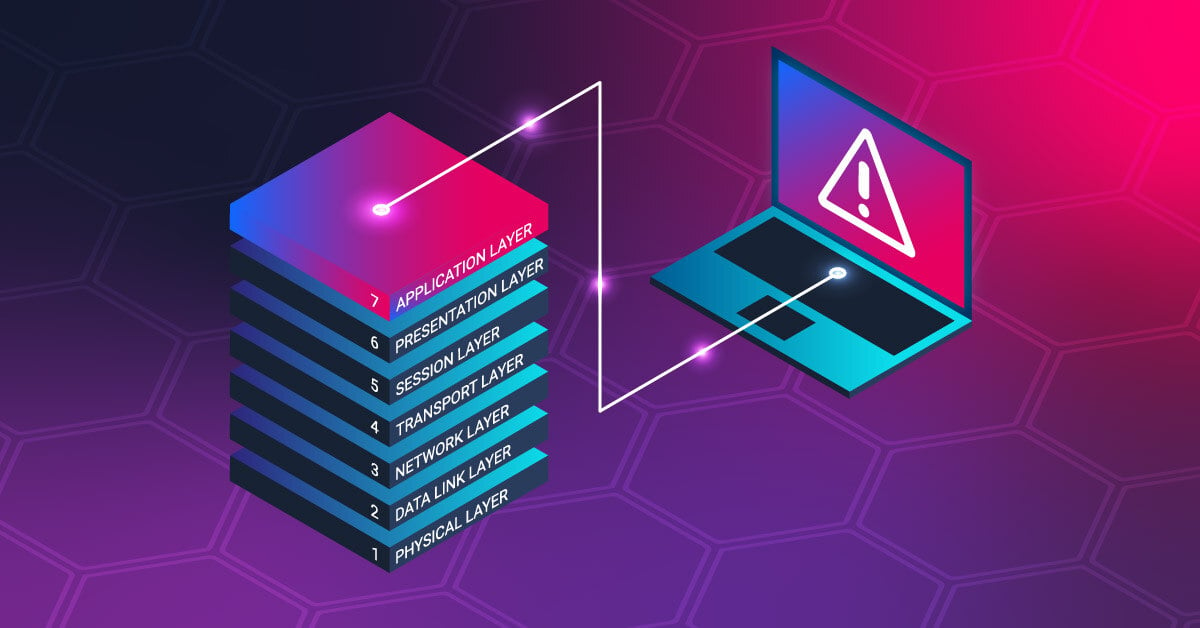
What is the OSI model?
The Open Systems Interconnection (OSI) model is a conceptual framework that standardizes the functions of a telecommunications or computing system into seven distinct layers. Each layer has specific responsibilities that allow network administrators and IT professionals to identify problems and optimize communication processes. Although often associated with networking, the principles of the OSI model can be broadly applied to any IT infrastructure.
Let's explore how PRTG can help you monitor each of these critical layers.
1. Physical server layer
Monitor the health of your physical servers with the SNMP Hardware Status sensor. This sensor can monitor various hardware parameters, such as temperature, power supply, and fan speed, so you can detect hardware problems early. In addition, you can explore other SNMP sensors such as the SNMP CPU Load sensor for more comprehensive monitoring.
Physical servers can also be monitored through their management interfaces and Redfish. For more information on tracking health status through interfaces such as iDRAC, iLO, iRMC, and IMM, see this blog post.
2. Data link layer
PRTG offers valuable tools for monitoring the data link layer, providing insight into various aspects that are critical for network stability and performance. You can use PRTG to manage VLANs and monitor SNMP-based switches to ensure smooth data flow between devices. In addition, PRTG can monitor the status of the Spanning Tree Protocol (STP) to prevent network loops and increase reliability. Explore sensors such as the SNMP Cisco System Health sensor and SNMP Traffic sensor for comprehensive monitoring at this layer.
3. Network layer
At the network layer, PRTG provides you with a comprehensive set of tools to efficiently manage and monitor IP-based communication in your network. Use PRTG to monitor IP addresses and perform ICMP (ping) tests to gain insight into network reliability and latency. In addition, PRTG allows you to track SNMP-based routers, enabling detailed routing table checks and verification of protocols such as BGP and OSPF. Sensors such as the Ping sensor and SNMP Traffic sensor offer robust tools to keep your network layer operations smooth and well-optimized.
4. Transport layer
PRTG offers complete monitoring solutions for the transport layer, allowing you to effectively monitor data transmission between devices. Use PRTG to monitor TCP and UDP ports to ensure that connections are stable and performing optimally. In addition, PRTG allows you to track connections and check latency, which is crucial for maintaining efficient communication and diagnosing potential bottlenecks. For firewall session monitoring, PRTG provides insight into session activity and security. Sensors such as the Port sensor and Packet Sniffer sensor are excellent tools for comprehensive monitoring.
5. Session layer
Track VPN, SMB, and SIP sessions using PRTG capabilities in logs and SNMP, providing detailed insights into the status and performance of these essential session-based services. This monitoring helps maintain stable and secure session-based communications, supporting the efficiency and reliability of your network. Use sensors such as the SNMP Cisco ASA VPN Connections sensor and Syslog Receiver sensor to effectively manage session-level activity.
6. Presentation layer
Enhance your presentation layer monitoring with PRTG by focusing on TLS/SSL certificate management, an essential aspect of secure communication. PRTG can monitor the status and validity of TLS/SSL certificates, ensuring that encryption protocols are up-to-date and effective. This monitoring helps you maintain the integrity and security of your data transmissions. For effective monitoring, consider using sensors such as the SSL Certificate sensor and the SSL Security Check sensor to support your presentation layer activities.
7. Application layer
Improve the performance and reliability of your applications. Track HTTP, FTP, DNS and SQL services to ensure efficient operation and connectivity. PRTG supports API performance monitoring for seamless integration and functionality. Additionally, monitor website uptime and database query performance to ensure a smooth user experience. Use sensors such as HTTP sensor, FTP sensor or Microsoft SQL v2 sensor to effectively manage and optimize this layer.
How PRTG monitors multiple OSI layers
Cover multiple layers of the OSI model with PRTG, bringing flexibility to network monitoring. SNMP sensors provide critical insight by monitoring switches, routers, bandwidth, VLANs and MAC tables, effectively covering layers 1 to 3.
For layers 3 and 4, flow-based sensors such as NetFlow and sFlow help identify protocol-specific traffic and congestion, enabling proactive traffic management.
Packet sniffing provides detailed inspection of layer 4 TCP/UDP traffic patterns to ensure efficient communication flow. Tracking web services, mail servers, and databases is facilitated by port and service monitoring, addressing layers 4 to 7.
In addition, Deep Packet Inspection (DPI) provides valuable insight into application traffic behavior at layer 7, helping you to maintain optimal application performance.
By systematically monitoring these seven layers with PRTG, you gain a comprehensive view of the health and performance of your IT infrastructure, enabling you to maintain a robust, efficient and reliable environment. Whether you are managing a small business network or a large enterprise data center, PRTG's versatility and comprehensive features equip you with the necessary tools for success.
And if you're ever curious about the tricky "Layer 8" of the OSI model, check out this article: 😉


