.jpg) Published by Jasmin Kahriman
Published by Jasmin Kahriman
Last updated on January 23, 2024
•
9 minute read
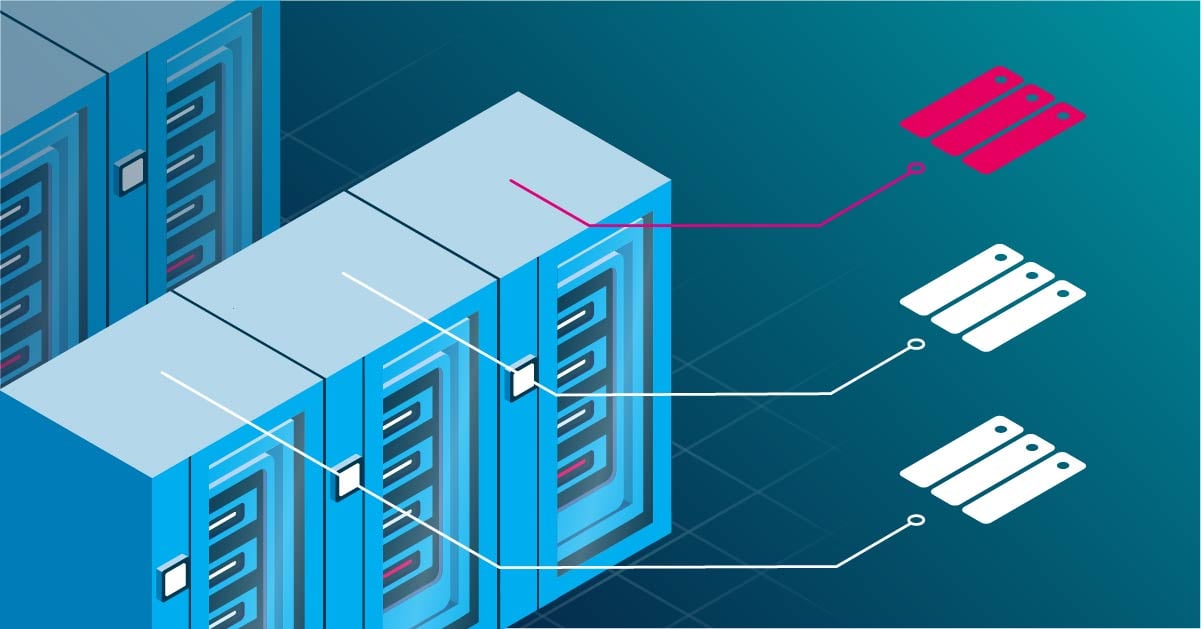
We at Paessler are running heterogeneous network infrastructure powered by different physical servers such as Dell PowerEdge, HPE ProLiant, Fujitsu Primergy and IBM xSystem. Some of them are running as standalone servers and some are part of the cluster. One of the things I very much appreciate about managing my servers is the possibility to do it remotely, without even going to the server room and getting frozen, especially during the winter season. The remote management (hardware configuration, firmware upgrade or OS upgrade) can easily be done via management platforms/controllers/ports: iDRAC, iLO, iRMC and IMM – depending on the vendor.
But what about monitoring? For a moment imagine life without Paessler PRTG monitoring software: to check the health state of different hardware components or to configure alerting on these servers, we'd need to connect to each server individually and perform such activities. It is time-consuming and not fun at all.
Meanwhile, Redfish is a successor to IPMI, and it is increasingly establishing itself on the market. We have prepared some content for you, so don't miss it. 😊
🔥 Monitor your server hardware (system health) with the Redfish protocol
🔥 Let's talk about sensors! Monitoring with PRTG Redfish sensors
🔥 All about Redfish and how to easily add the sensors in PRTG
By using PRTG we can change the way we are monitoring and maintain the health state of our physical servers, or infrastructure in general. PRTG gathers the status of different hardware servers' components (CPU, RAM, fan, power supply, RAID, etc.) via management controllers. These controllers have their own CPU, memory, network connection and access to the system bus.
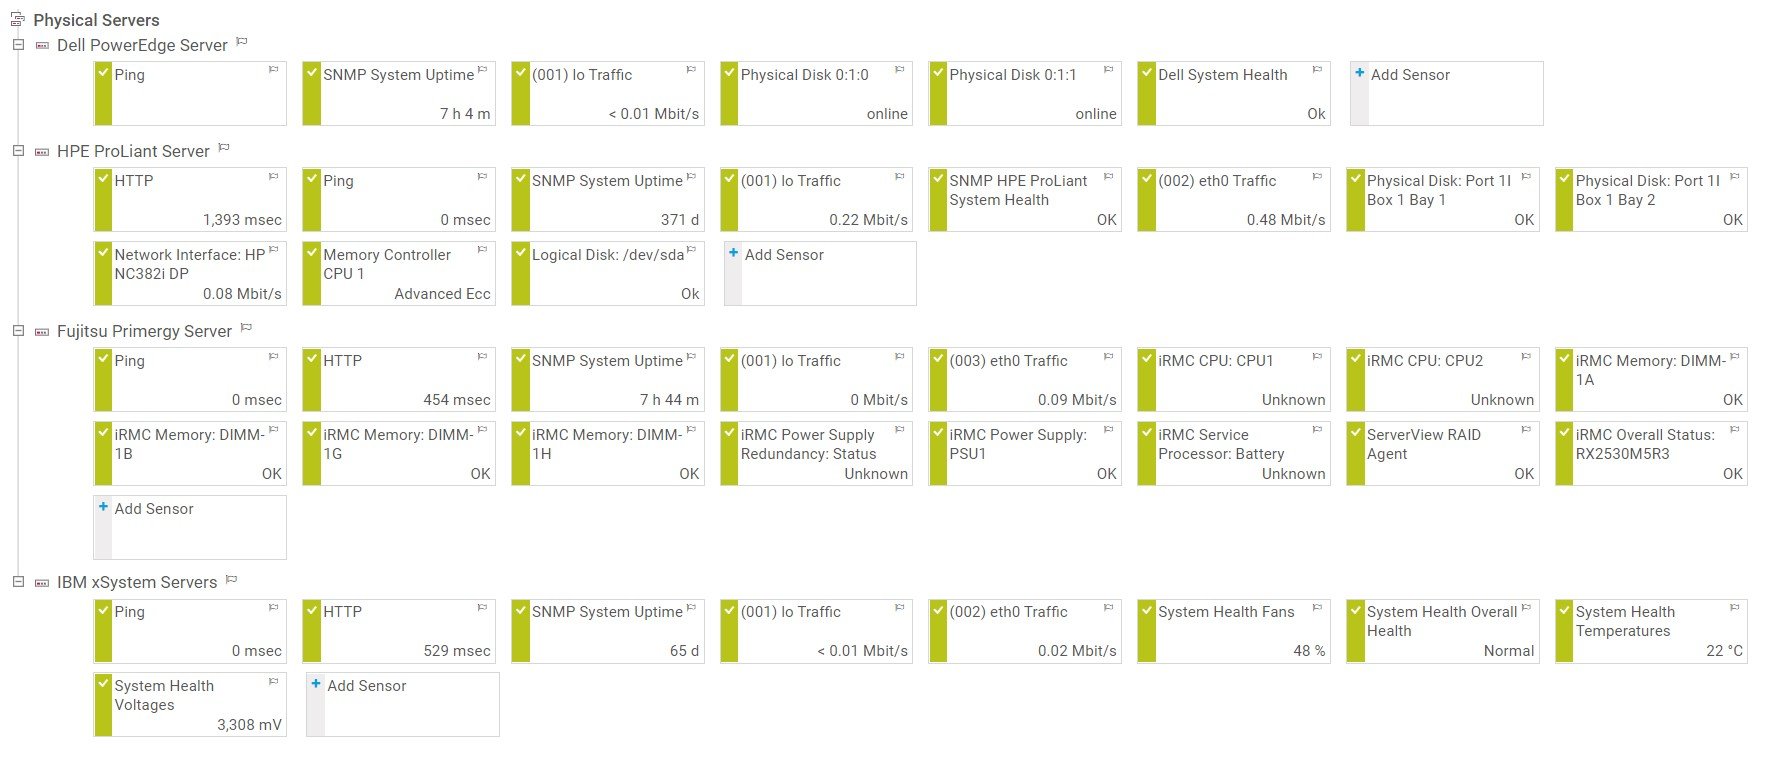
I'll walk you through the native PRTG hardware parameter sensors we can use to monitor physical servers via iDRAC, iLO, iRMC, and IMM. At the end of the day, your structure and monitoring with PRTG might look like the screenshot below.
Dell PowerEdge and iDRAC
The Dell Remote Access Controller or DRAC is a management platform which has been available on Dell servers since 1999. It can come as an expansion slot (DRAC) or integrated into the mainboard (iDRAC). The first iDRAC 6 version was developed in 2008, and today we are using iDRAC v9 released back in 2017.
PRTG provides you with two native sensors for monitoring your Dell PowerEdge servers. Both sensors require that the minimum iDRAC 7 or the Dell OpenManage Server Administrator (OMSA) are installed on the monitored server. You can enable SNMP on iDRAC by navigating to iDRAC web UI > iDRAC Settings > Network > Services > SNMP Agent.
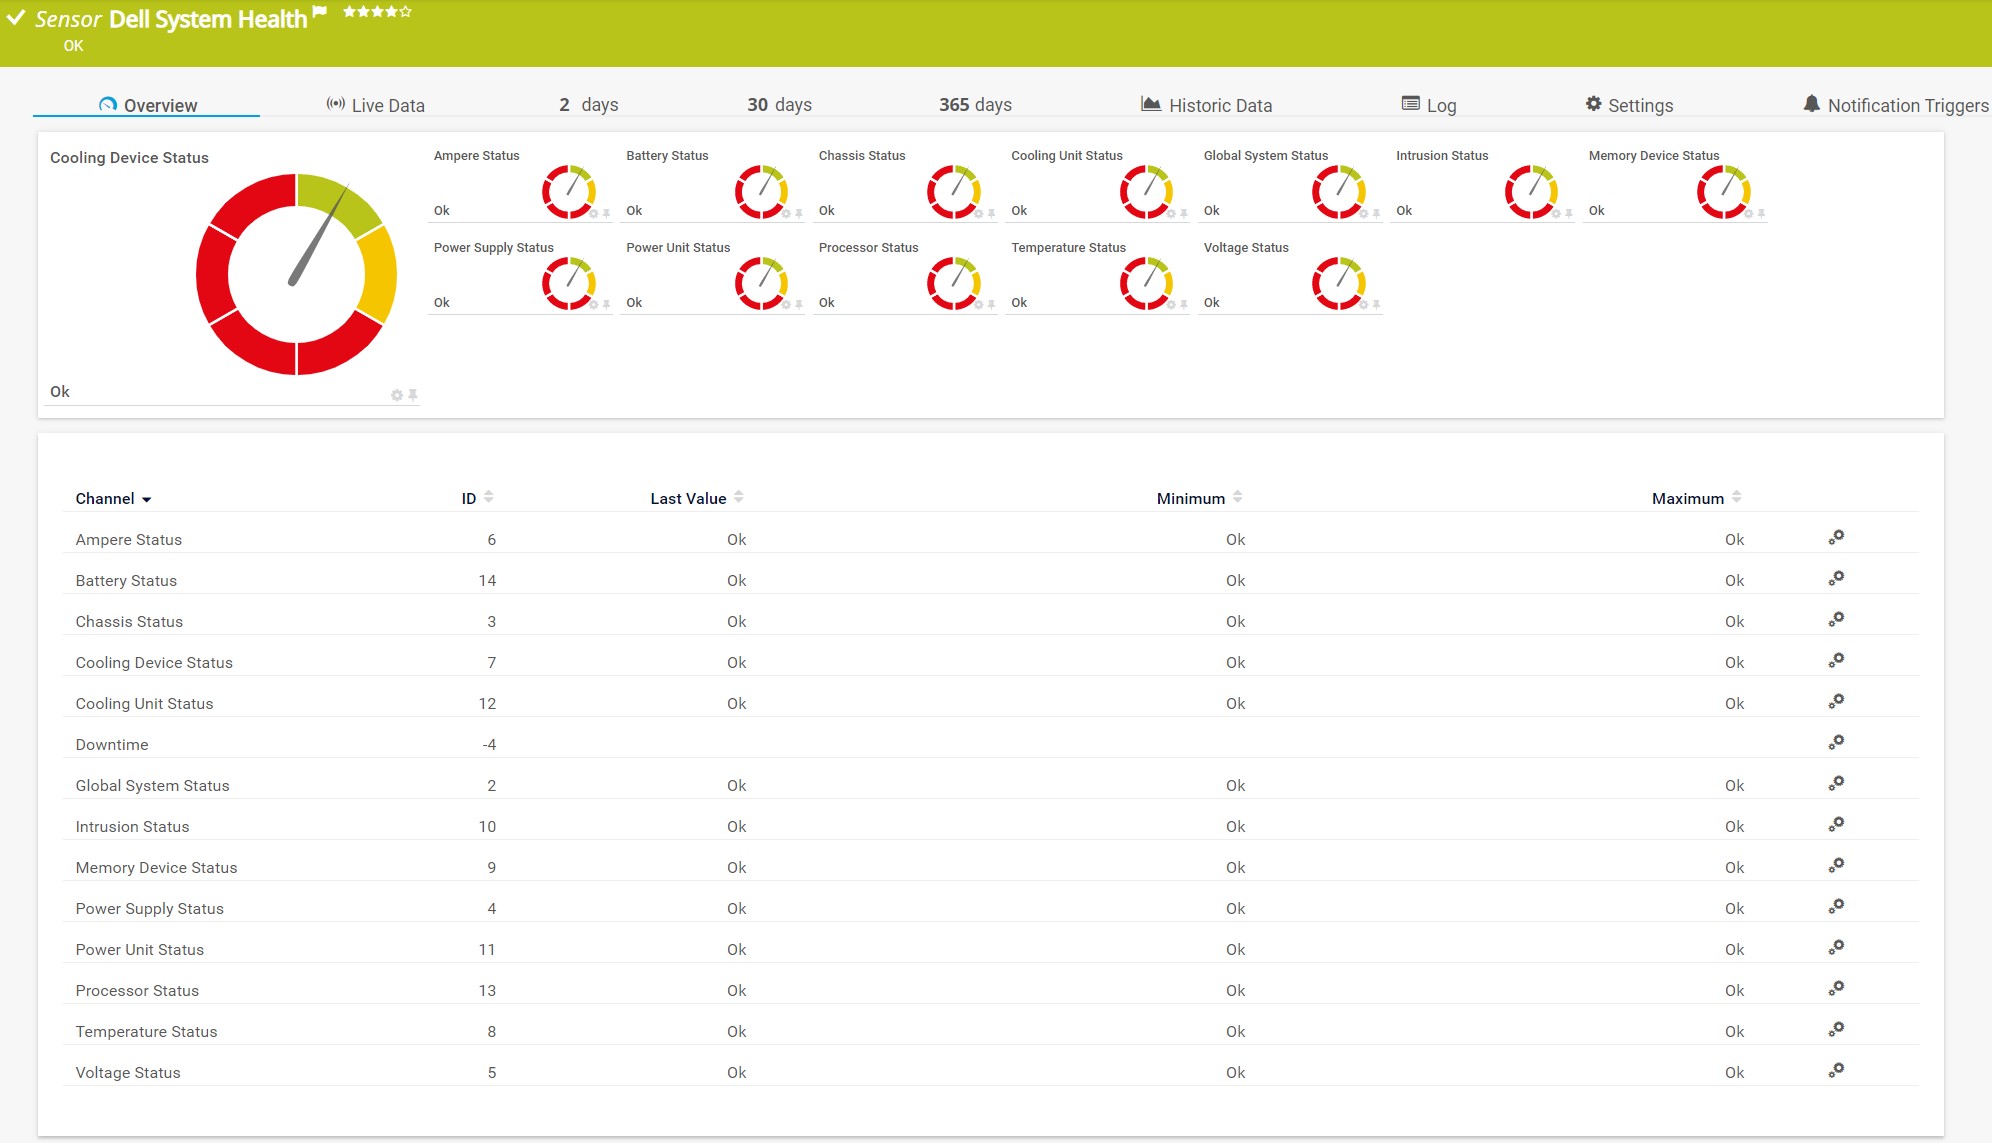
By using the SNMP Dell PowerEdge System Health sensor, you can keep an eye on global system status, chassis, cooling, intrusion, memory, power supply, CPU, temperature, and voltage.
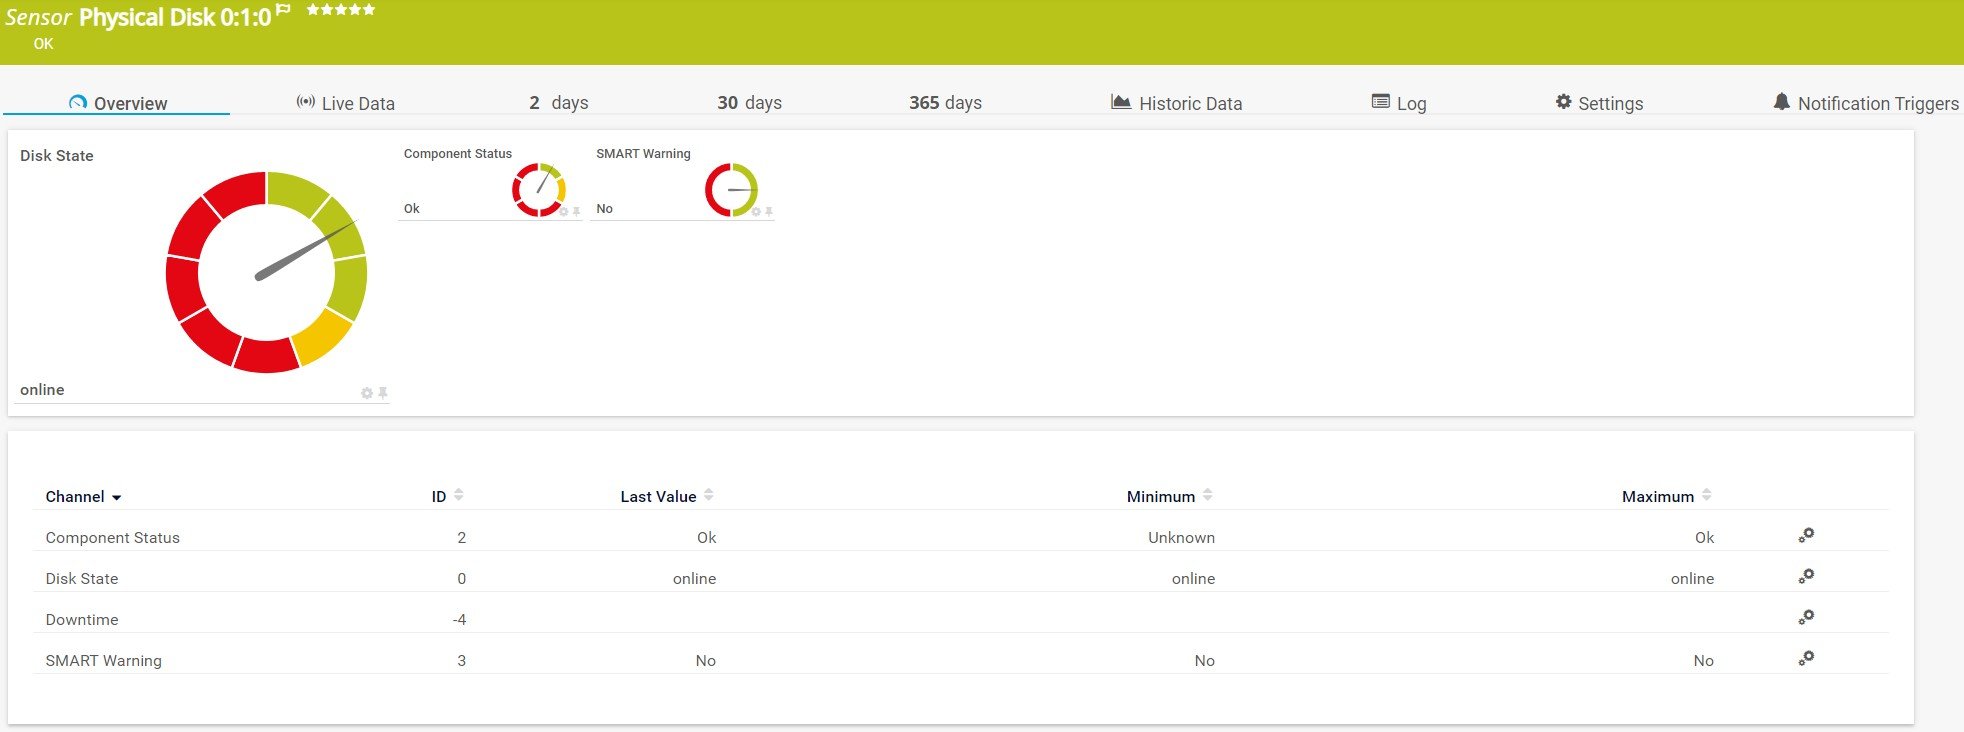
The SNMP Dell PowerEdge Physical Disk sensor monitors a physical disk and it can show you the health state of your disk, roll up, components, and S.M.A.R.T. monitoring.
HP ProLiant and iLO
Integrated Lights-Out or iLO is embedded or available on some HP ProLiant and Integrity servers. By enabling SNMP in iLO, we can monitor different parameters with five different PRTG sensors. For Gen9 servers or earlier, this sensor requires HPE Insight Management Agents and HPE Insight Management Web-based Enterprise Management (WBEM) Providers to be installed on the target device. For Gen10 servers, use the iLO interface as the parent device for this sensor.
You can enable SNMP on iLO 4 and iLO 5 by navigating to iLO web UI > Administration (iLO 4 only) > Management > SNMP Settings.
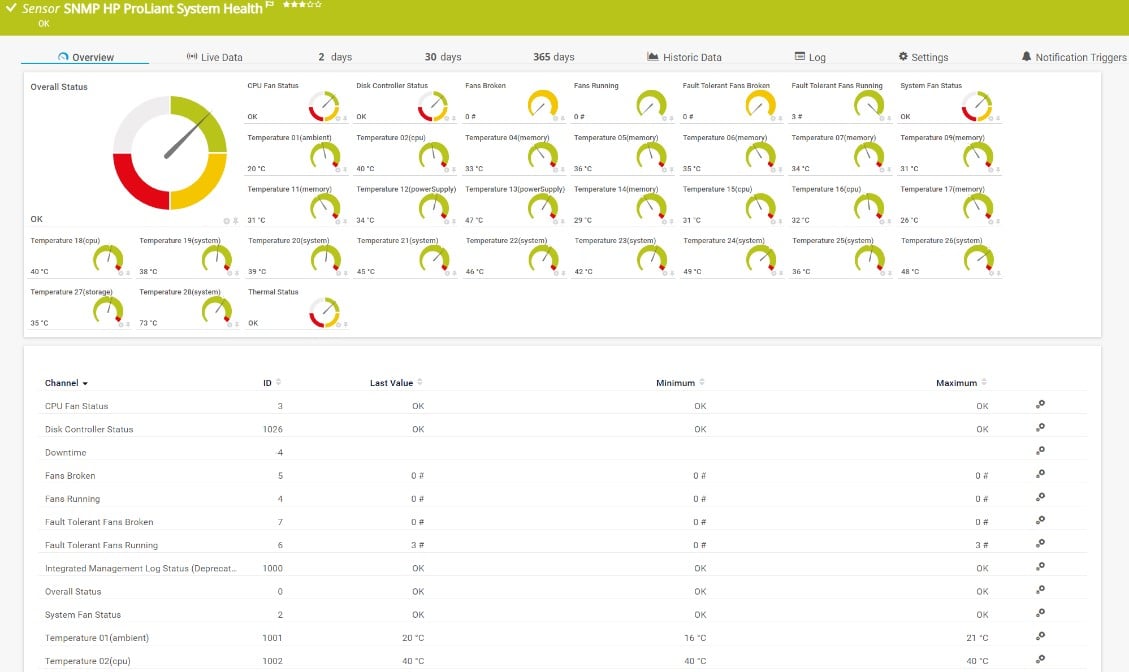
The SNMP HPE ProLiant System Health sensor monitors the system health and HPE ProLiant servers via SNMP. Besides the overall status, it can also show the status of thermal configuration, fans, CPU, power supply, the disk controller, and temperature. Which channels the sensor shows might depend on the monitored device and the sensor setup. We recommend that you use iLO 4 or later.
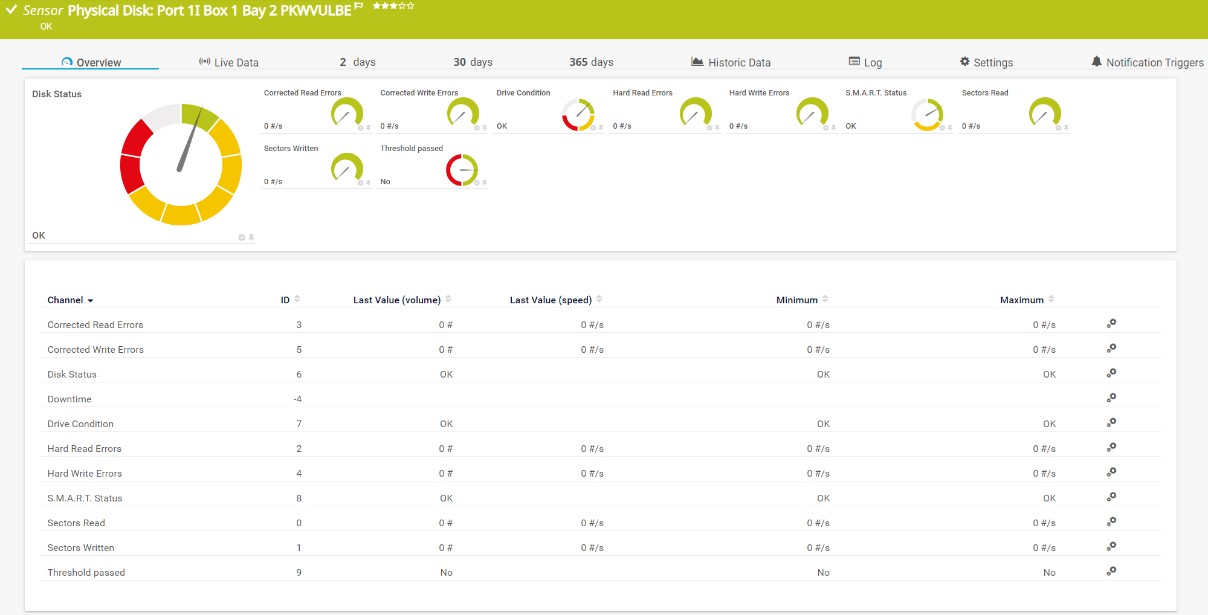
That is not all. PRTG has four more native HPE ProLiant sensors that can help you to monitor physical disk, logical disk, available network interfaces, and memory controller. In the screenshot below you can see channels related to the monitoring of the physical disks.
Fujitsu Primergy Servers and iRMC
My colleague Sascha has already given some insights about the iRMC in his article Why you should manage your Fujitsu server with iRMC. The SNMP can be enabled by following the instructions:
- iRMC v4: Network Settings > SNMP
- iRMC v5: Settings > Services > Simple Network Management Protocol (SNMP)
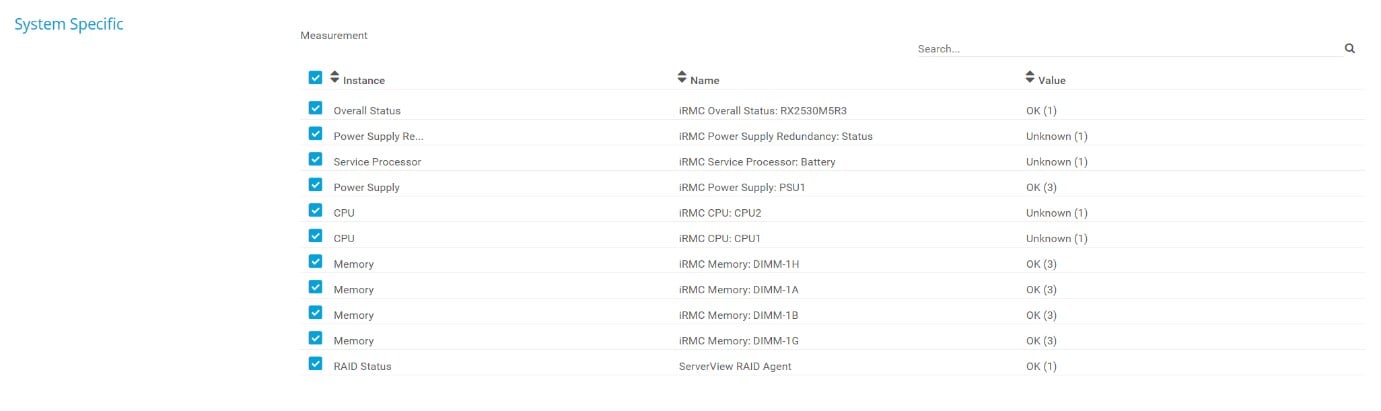
The SNMP Fujitsu System Health v2 sensor monitors the status of a Fujitsu PRIMERGY server via the integrated Remote Management Controller (iRMC) and SNMP. The sensor might also work on other Fujitsu devices that have an iRMC available like PRIMEQUEST servers, some storage systems of the ETERNUS product line, and CELSIUS workstations in racks. By using this sensor, we can monitor overall hardware status, but also components such as CPU, fan, memory, battery, power supply, and RAID.
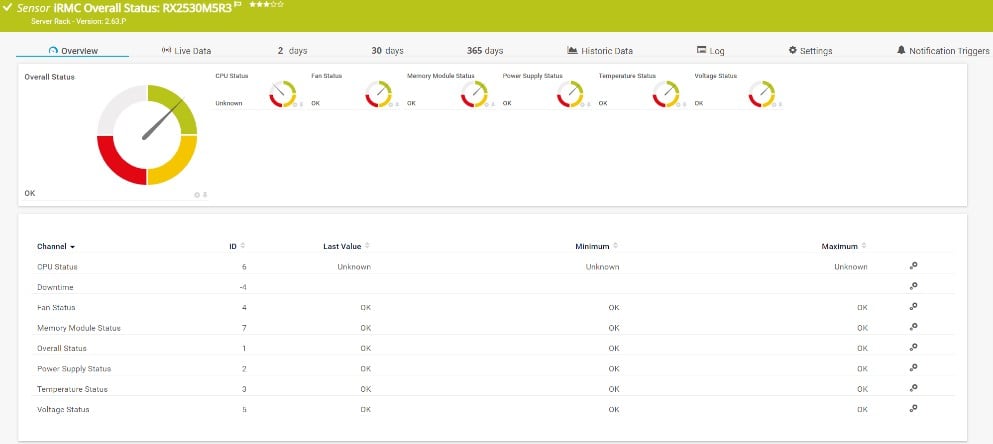
Which channels the sensor shows might depend on the monitored device and the sensor setup:
IBM xSystem and IMM
The Integrated Management Module (IMM) is a management module that is used for systems management functions. PRTG has four native sensors for monitoring the system health of IBM xSystem servers. You can enable SNMP on IMM by navigating to IMM web UI > Network Protocols > SNMP.
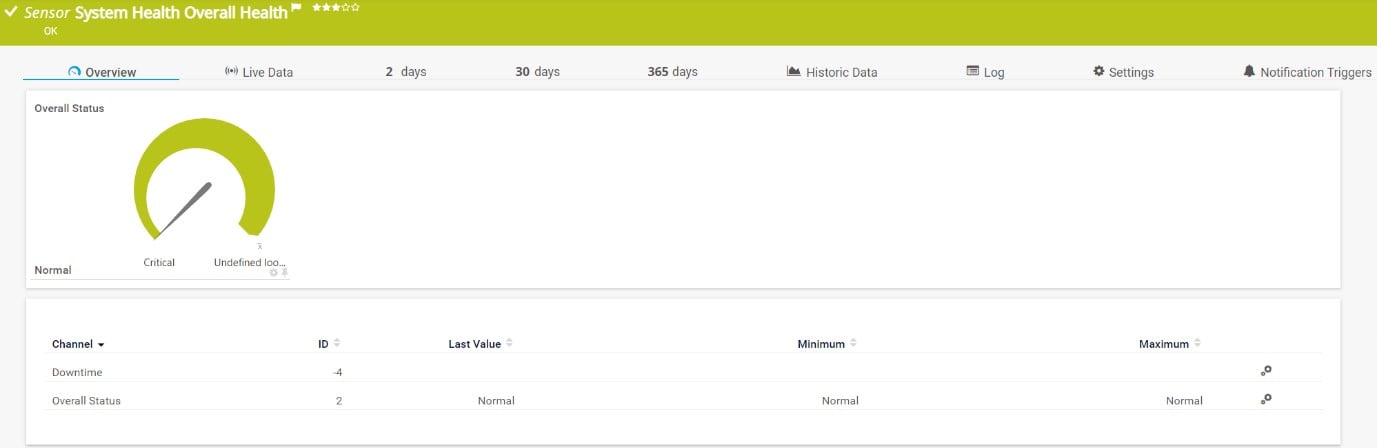
The SNMP IBM System X System Health sensor monitors the system health via SNMP. It shows overall health, temperature, voltage, fan and power supply status.
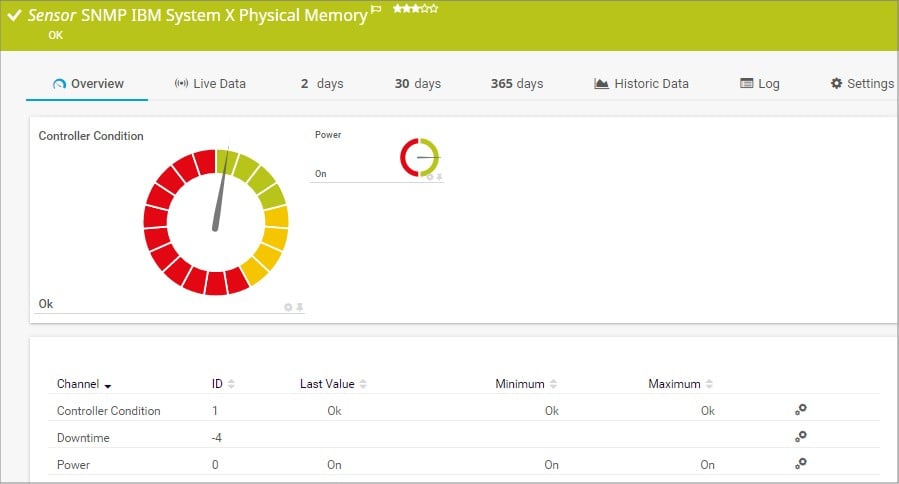
If you would like to know the status of the physical disk, logical disk or physical memory, you can do it by using SNMP IBM System X Physical Disk sensor, SNMP IBM System X Logical Disk sensor, SNMP IBM System X Physical Memory sensor:
This was about native hardware parameters sensors for physicals servers. But don't forget to also add and use additional sensors such as Ping, HTTP sensor, SNMP System Uptime, SNMP Traffic sensor, SNMP Trap Receiver sensor and Syslog Receiver sensor for additional monitoring benefits.
Do you have a heterogeneous physical server infrastructure or are you focused on a single vendor? How do you monitor hardware components? I'd be happy to hear your feedback!


