 Published by Michael Becker
Last updated on July 13, 2026
•
5 minute read
If you monitor your server hardware in your data center with PRTG, you are probably familiar with the System Health Sensor for hardware like Dell, HP, Lenovo, etc., which allows you to monitor the status of the CPU fan, the battery, and also overall system status, among other things. Each sensor includes numerous channels that let you keep a detailed eye on your hardware. But did you know that PRTG also lets you monitor the system health of your server hardware via the Redfish protocol?

What is Redfish?
The Redfish Scalable Platforms Management API (Redfish) is a specification for remote maintenance of server systems (out-of-band systems management). The first version of the specification was published by the Distributed Management Task Force (DMTF) in August 2015. Since then, Redfish has been continuously developed. Redfish was launched with the goal of replacing IPMI (Intelligent Platform Management Interface) in the medium term. For this purpose, Redfish relies on a RESTful (Representational State Transfer) programming interface that allows simple queries with numerous programming languages. Redfish transmits data via HTTPS, using JSON as the data format.

Which manufacturers support Redfish?
Since Redfish is a standard protocol, many different vendors can support it as long as they follow the rules specified in Redfish. Thus, our Redfish System Health sensor (EXPERIMENTAL) can work with servers of all supported vendors. Some of the vendors that support Redfish are the following:
- Dell iDRAC BMC with minimum iDRAC 7/8 FW 2.40.40.40, iDRAC9 FW 3.00.00.0
- HPE iLO BMC with minimum iLO4 FW 2.30, iLO5
- HPE Moonshot BMC with minimum FW 1.41
- Lenovo XClarity Controller (XCC) BMC with minimum XCC FW 1.00
- Supermicro X10 BMC with minimum FW 3.0 and X11 with minimum FW 1.0
- IBM Power Systems BMC with minimum OpenPOWER (OP) firmware level OP940[6]
- IBM Power Systems Flexible Service Processor (FSP) with minimum firmware level FW860.20[7]
- Cisco Integrated Management Controller with minimum IMC SW Version 3.0[8]
As you can see most of these vendors are well known and widely used. However, Redfish can also be integrated into a BMC (IPMI) firmware at a later date and thus can be retrofitted to servers already in use.
How can I find and use the Redfish Sensor in PRTG?
Unlike the System Health Sensors, which you can add to a device by searching for the manufacturer name such as Dell, HP, Lenovo, or the management interface name such as iDRAC or iLO, for example, you simply type "Redfish" in the search.
 Because the new Redfish sensor is currently in the EXPERIMENTAL stage, the ‘Experimental features’ must be enabled in PRTG beforehand. If you don't know what an experimental sensor is or how to use them in PRTG, please have a look at this article:
👉 New Handling of beta sensors in PRTG
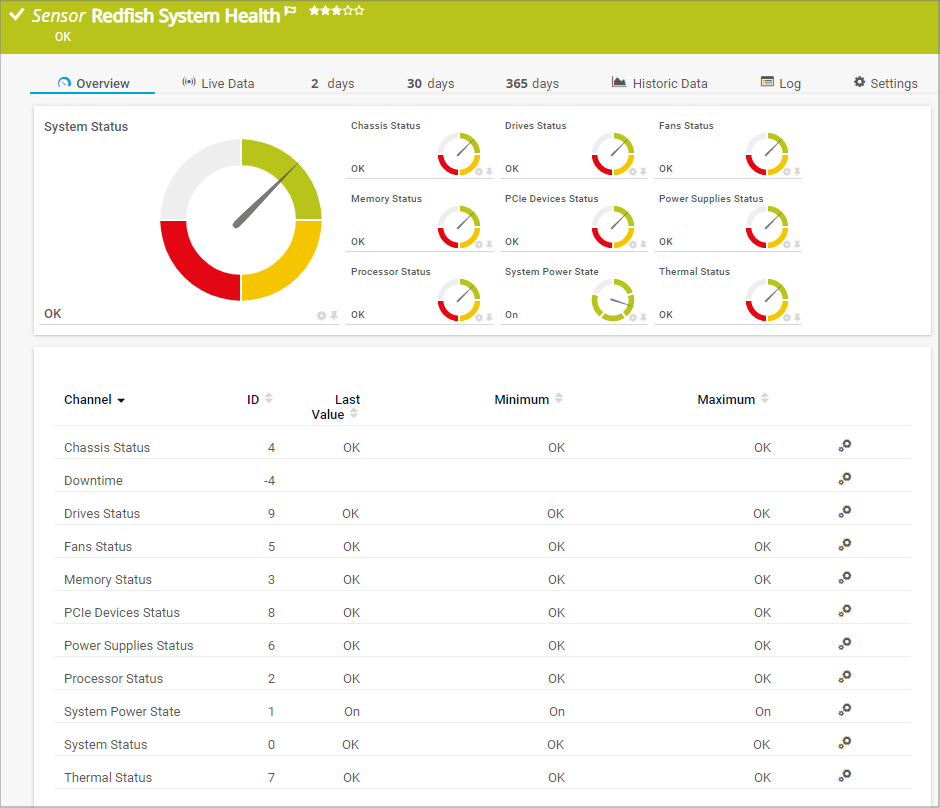
Our first Redfish sensor is the Redfish System Health sensor. The sensor monitors the overall system status and the status of various components such as power supplies or PCIe devices, if available.
If you would like to know more, please have also a look at our new KB article “I want to know which of my systems support the Redfish System Health sensor. Can you help me?”.
As we plan to create more sensors* for monitoring server hardware that are based on the Redfish specifications and to provide the best solution possible, we need to understand your use cases. Therefore, we would appreciate your feedback in this survey:
👉 Redfish / REST API for server management
* With PRTG version 71 we will release the Redfish Virtual Disk sensor. This sensor monitors the virtual disks of Redfish-capable servers and shows their capacity and status.

As always, we are happy to read your thoughts in the comments below.