 Published by Michael Becker
Last updated on April 13, 2026
•
7 minute read
A little while ago, we introduced the first two Proxmox sensors for PRTG - the Proxmox VE Virtual Machine Status sensor and the Proxmox VE Container Status sensor. If you missed that one, worth a quick read: check out the full article here. Back then, we already mentioned that more sensors were coming. Well, here they are. Both are now available in beta: the Proxmox VE Cluster Health sensor and the Proxmox VE Node Performance sensor.

One Layer Deeper
Monitoring your VMs and containers is a solid start. But if you've been running Proxmox in production for any length of time, you know the questions don't stop there. Is my cluster actually healthy right now? Is quorum still intact? Which node is under heavy load while the others are sitting idle? These are the things you want to know before your phone starts ringing - not after.
That's where these two sensors come in. They don't replace the VM and Container sensors. They sit underneath them, giving you visibility into the infrastructure that those workloads depend on.
Proxmox VE Cluster Health Sensor
Let's start with the one that arguably matters most in a high-availability setup. The Cluster Health sensor keeps an eye on the overall state of your Proxmox VE cluster. Not just "is it up" - but whether it's actually in a healthy, functioning state.
Here's what it monitors:
- Quorum Reached (primary channel - Yes / No / Unknown)
- Active Nodes
- Online Nodes (%)
- Total Nodes
- Ceph Status (only shown when Ceph is configured on your cluster)
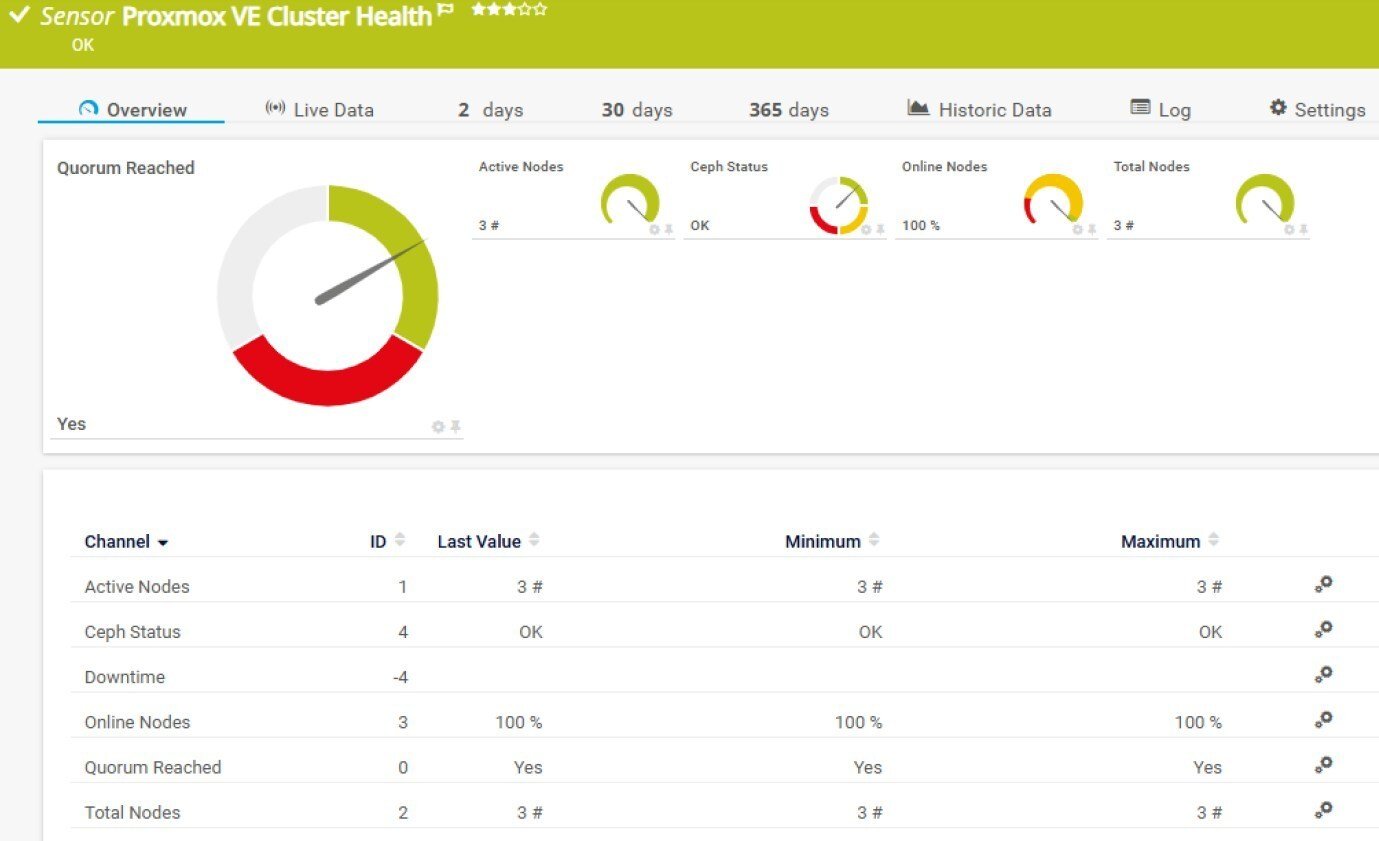 The Quorum channel deserves a special mention. Losing quorum in a Proxmox cluster means the cluster can no longer make collective decisions - things like where to restart a VM after a node failure. It's the kind of problem that can quietly bring down services without an obvious error message. Having that channel alert you the moment quorum is lost? That's genuinely useful.
The Online Nodes channel comes with sensible default limits already built in: a warning triggers at 95%, an error at 20%. You can of course adjust those, but for most environments these defaults are a reasonable starting point.
And the Ceph Status channel - that one only shows up if you're actually using Ceph. No unnecessary clutter in your dashboard if it's not relevant to your setup.
A quick technical note: this sensor requires a parent device that is a Proxmox VE cluster running version 6.2 or later. It works with the multi-platform probe, supports IPv6, and has a very low performance impact.

Proxmox VE Node Performance Sensor
If the Cluster Health sensor gives you the bird's eye view, the Node Performance sensor is where you zoom in. It monitors the individual nodes that make up your cluster - the actual physical (or virtual) machines doing all the heavy lifting.
The channels it tracks:
- Load Average (primary channel)
- CPU Usage
- Memory Usage (%)
- Available Memory
- Total Memory
- Available Disk Space
- Disk Usage
- Total Disk Space
- Uptime
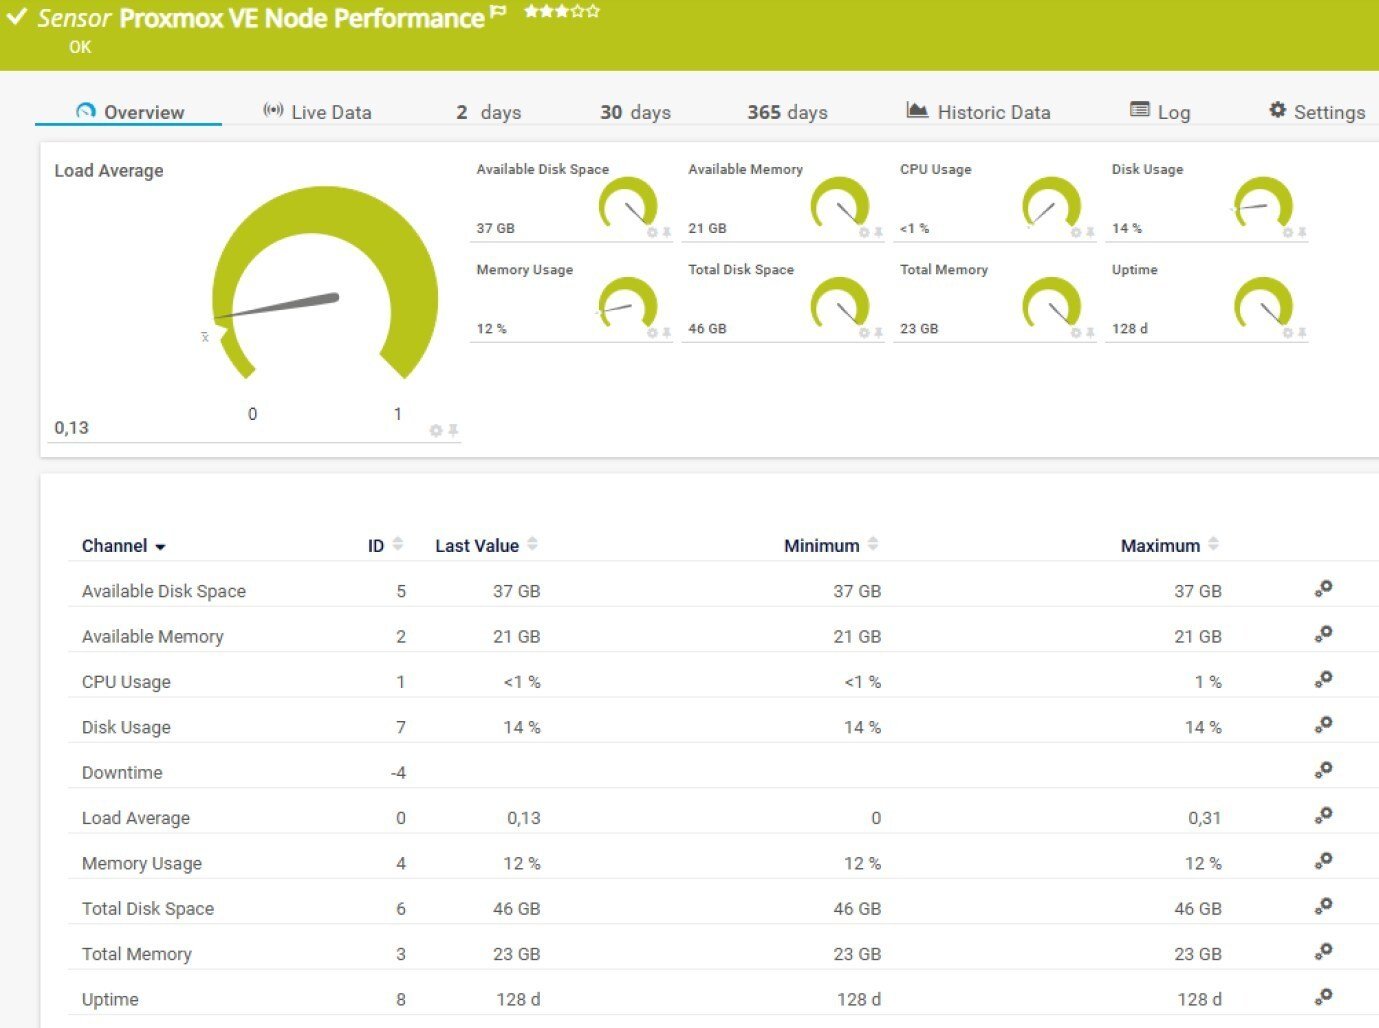 This is the data that helps you answer the follow-up questions. Your cluster looks healthy overall, but something feels sluggish. One node sitting at 95% CPU while the others are at 30%? That imbalance will show up here. Or maybe a node is quietly running out of disk space - the kind of thing that doesn't cause an immediate outage but absolutely will if you don't catch it.
One thing worth knowing about the Available Disk Space channel: it reflects the space available to non-root users, as reported directly by the Proxmox API. This excludes system-reserved blocks, so the number may look slightly lower than what you'd see at the OS level. Keep that in mind when you set your alert thresholds.
This sensor also uses the meta-scan feature, which means PRTG can automatically discover your nodes and pre-fill the sensor configuration for you. Combined with Multi-platform Probe support and IPv6 compatibility, the initial setup really doesn't take long.
The Full Picture
Between these two new sensors and the ones released earlier, you now have monitoring coverage across four layers of your Proxmox environment:
The VM and Container sensors watch your workloads. The Node Performance sensor watches the hosts those workloads run on. And the Cluster Health sensor watches the whole thing - making sure the high-availability mechanisms you're depending on are actually ready to do their job.
That kind of layered visibility makes a real difference when something goes wrong at an inconvenient hour. Instead of piecing things together across multiple tools and terminal windows, you have one place to start your investigation.
iPlease note: Both sensors require that the Beta Sensors experimental feature is enabled in PRTG - a quick setting change, and one that's absolutely worth it given what you get in return. For more information, see the Knowledge Base: What are beta sensors and how can I use them?
Try It Yourself
We're continuing to expand Proxmox support in PRTG, and these beta sensors are your chance to get ahead of the curve and shape what the final versions look like.
Ready to take your Proxmox monitoring to the next level?
👉 Download the free PRTG trial and test the new beta sensors today. Have feedback or ideas? Head over to Paessler UserVoice - that's exactly where this all started.


