Trust me, I've seen this movie before - IT teams scrambling when users complain about slow apps, or worse, discovering a breach that's been lurking in their traffic patterns for weeks. These nightmares play out in companies every day, and they're expensive. One client of mine burned through $200K in just productivity losses last year because they couldn't see what was actually happening on their network. The kicker? Most orgs have the same blind spot - zero visibility into their actual traffic.
Here's the thing about bandwidth - it's the lifeblood of everything your network does. Performance, security, user experience - it all comes down to how your bandwidth gets used. But without decent monitoring, you're basically flying blind. I can't count how many IT teams I've watched struggle with troubleshooting because they couldn't identify bottlenecks or spot those weird traffic patterns that scream "security problem!" The real-world fallout isn't pretty: business-critical apps slow to a crawl, users blow up the help desk with complaints, and potential breaches go undetected until the damage is done.
I put this guide together to show you exactly how to get visibility into your bandwidth - from setting up proper monitoring (tools like PRTG Network Monitor have saved my bacon more times than I can count) to creating baselines that actually make sense for your environment.
Whether you're trying to figure out why your VoIP calls keep dropping, planning for next year's growth, or making sure you're not missing security red flags, getting a handle on your bandwidth usage is step one. Not the sexiest project, maybe, but it might be the most important one you tackle this year.
Understanding bandwidth usage in real-world scenarios
Network congestion and performance issues manifest in various ways across organizations. Video conferencing can consume 3-4 Mbps per user, while VoIP calls require consistent bandwidth to maintain call quality. When these applications compete for limited network resources, critical business functions suffer. Here's something every IT pro discovers eventually: malware doesn't just threaten security - it devours bandwidth.
We've seen cryptominers suddenly consuming 70% of available bandwidth, creating those weird traffic spikes that every net admin dreads. Without solid traffic monitoring in place (which, let's face it, too many companies underinvest in), you're looking at serious downtime, productivity losses, and users constantly complaining about poor application performance - all translating to thousands in lost revenue and productivity.
Different network environments present unique bandwidth challenges. Cloud-based infrastructures require monitoring internet bandwidth to service providers, while on-premises networks need visibility into internal traffic flow between servers and endpoints. Remote work setups demand attention to VPN bandwidth utilization, which can become bottlenecks during peak hours. How to estimate your hosting bandwidth usage becomes critical when planning capacity across these diverse environments. Effective network management requires implementing bandwidth monitoring tools that can track consumption patterns and establish thresholds for notifications.
Easy ways to quickly test your bandwidth help establish baselines for normal network performance, enabling IT teams to proactively troubleshoot issues before they impact business operations.
How to check and monitor bandwidth usage with PRTG
When it comes to monitoring bandwidth usage effectively, basic router checks fall short for most organizations. While your router might show current bandwidth consumption, it typically lacks historical data, detailed analysis, and alerting capabilities. This limited visibility leaves IT teams reactive rather than proactive, often discovering issues only after users complain. For meaningful bandwidth monitoring that prevents problems before they impact business operations, organizations need specialized tools that collect and analyze traffic data using multiple methods. PRTG Network Monitor offers several approaches to bandwidth monitoring that provide increasingly detailed visibility into network performance.
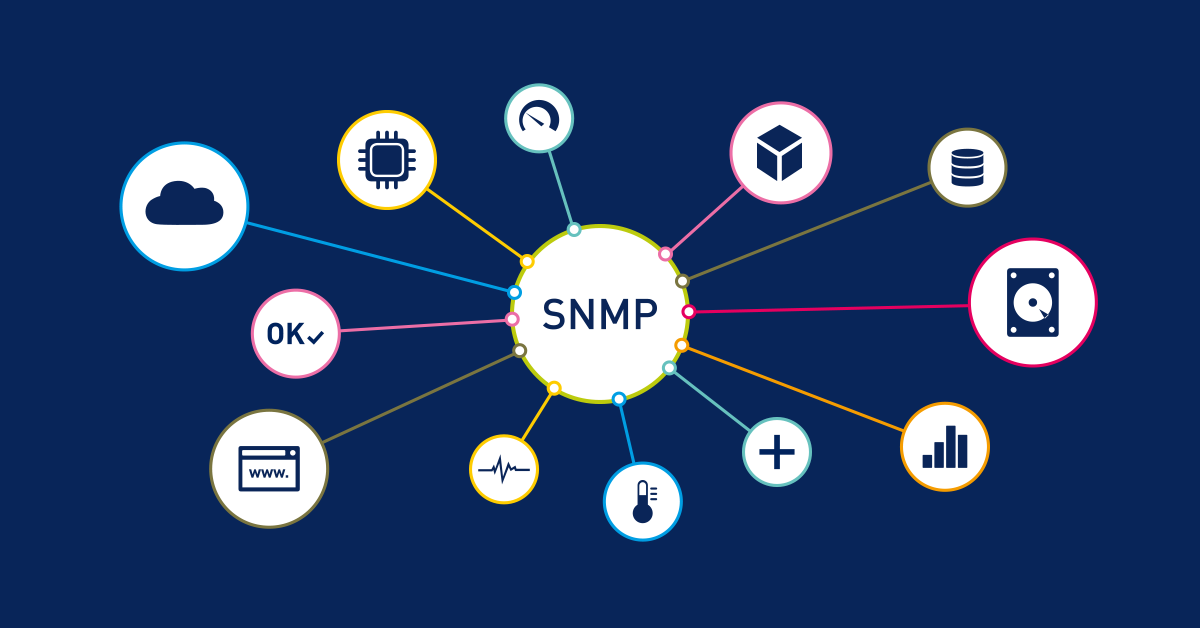
SNMP is the workhorse of bandwidth monitoring - it polls your network gear every minute or so and gives you the basics. Been around forever, and for good reason. It'll show you bandwidth utilization across your network, but won't break down which users or apps are hogging your pipes. It's like knowing your electric bill is high without knowing which appliances are the culprits. Still, SNMP is solid for spotting when you're approaching that danger zone - typically around 70-80% capacity - where performance starts to tank and users start complaining.
NetFlow, though? Total game-changer. While SNMP just tells you traffic exists, NetFlow tells you WHO and WHAT is creating it. We once tracked down a mysterious performance issue to a single marketing team uploading massive video files during peak hours - something basic monitoring would never have caught. It's especially clutch when troubleshooting those frustrating VoIP quality issues (where even tiny latency spikes kill calls) or when the C-suite complains about choppy video conferences (which, by the way, devour 3-4 Mbps per HD stream).
Packet analysis takes you even deeper. I've seen it catch things nobody suspected - like when we discovered a client's ERP system was running massive reports at noon instead of midnight, or when we realized streaming services were eating up 40% of available bandwidth! Another client couldn't figure out why their network crawled every afternoon until packet analysis spotted their backup system kicking in at 2pm instead of 2am (someone forgot to check a checkbox). With this level of detail, you can implement QoS that actually works, making sure business-critical apps get priority over Bob watching YouTube in accounting.
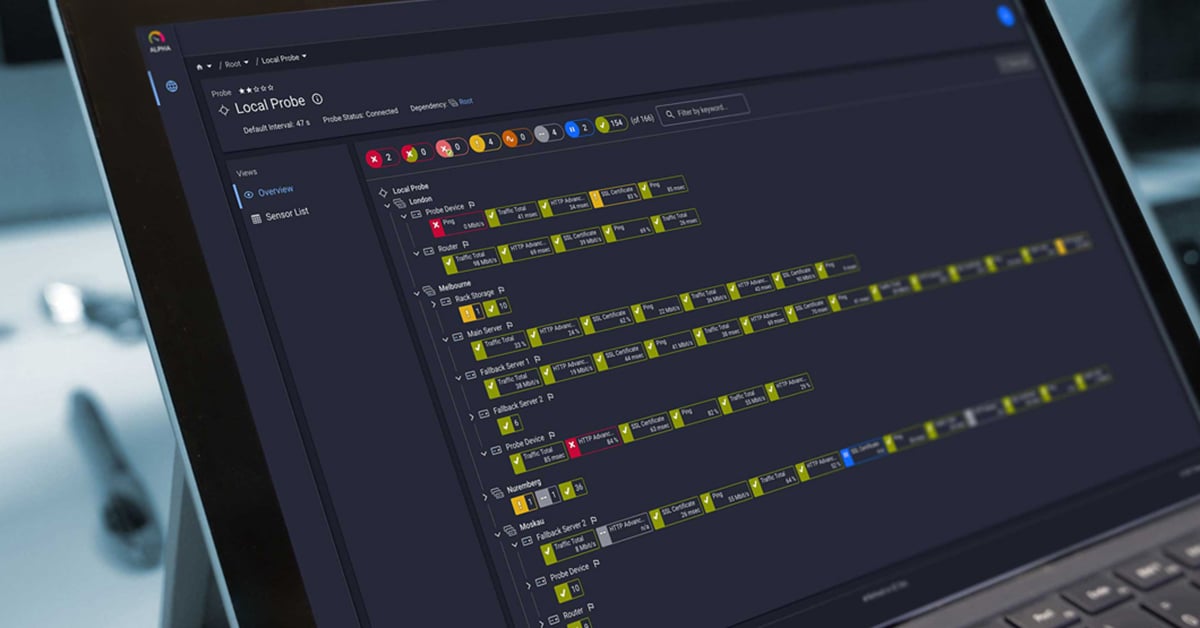
The best part? Seeing all this data come together in dashboards that actually make sense. Not those confusing, overly complicated monstrosities full of numbers nobody understands - I'm talking about real-time graphs where patterns jump right out at you. You can literally watch usage cycles throughout the day, spot weird spikes the moment they happen, and identify bottlenecks before users even notice. There's nothing more satisfying than fixing a problem before your phone starts ringing with complaints.
Implementing effective bandwidth management strategies
First things first - you need to know what "normal" looks like on your network before you can spot problems. Start by collecting at least two weeks of bandwidth data across different time periods. Include business hours, evenings, weekends, and those crazy month-end processing times when everything seems to happen at once. Look for patterns: Do you see spikes during the daily 10 AM video conference? Does bandwidth surge when the sales team submits reports on Fridays? Is your Wi-Fi network particularly strained in certain areas? Everything there is to know about managing your wifi bandwidth can help you tackle those wireless-specific challenges. Once you've established these baselines, set meaningful thresholds - typically 70-80% of maximum capacity for overall utilization, or 30-40% increases from baseline for sudden spikes.
Now comes the fun part - optimizing what you already have instead of just throwing more bandwidth at the problem. Start with traffic shaping and QoS policies that prioritize business-critical applications. Your VoIP calls and video conferences should get priority over Bob's Spotify stream or Sally's massive file download.
Consider bandwidth throttling for non-essential services during peak hours - users might not even notice if their YouTube videos run at 720p instead of 4K. Schedule bandwidth-intensive activities like system updates or large data transfers during off-peak hours. For remote offices with limited connectivity, monitoring your internet bandwidth usage with a Linksys or similar router gives you the visibility needed to implement these optimizations effectively.
Don't make the mistake of thinking bandwidth management is a "set it and forget it" task. Create a regular review cycle - I recommend monthly for most organizations, weekly for high-growth companies. During these reviews, analyze trends: Are certain applications consuming more bandwidth than expected? Has user behavior changed? Are new cloud services impacting performance? Look for patterns like gradually increasing baseline usage (often indicating healthy growth) versus sudden unexplained spikes (potential problems). These reviews should inform both immediate adjustments to your traffic shaping rules and long-term capacity planning. When considering what is website bandwidth and how much do you need?, remember that today's adequate bandwidth often becomes tomorrow's bottleneck as applications evolve and user expectations increase.
For truly effective bandwidth management, automation is your best friend. Tools like PRTG Network Monitor can automatically adjust network configurations based on current conditions - temporarily throttling non-essential traffic during peak times or rerouting critical services when bottlenecks occur. The most sophisticated setups can even predict future bandwidth needs based on historical trends, giving you time to upgrade before users notice problems. I've seen organizations reduce their bandwidth costs by 30% while improving performance just by implementing smart monitoring and automated management.
The key is combining baseline monitoring, intelligent resource allocation, regular reviews, and automated responses into a cohesive strategy that maximizes your existing infrastructure while planning strategically for growth.
Taking control of your network performance
Let's talk ROI - good bandwidth monitoring literally pays for itself. Network downtime costs a jaw-dropping $5,600 per minute (yes, Gartner actually calculated that insane figure). Then there's the productivity drain from users dealing with laggy apps, plus all the cash you're probably wasting on bandwidth you don't actually need. I've watched dozens of IT teams transform once they get real visibility into their network traffic. They stop playing whack-a-mole with outages and start making smart calls about resource allocation and tech investments. It's not complicated - whether you're troubleshooting those infuriating VoIP quality issues, fixing Wi-Fi dead zones, or planning your cloud migration strategy, you just need to see what's actually happening on your network.
Here's the kicker: the companies with the smoothest-running networks aren't the ones with massive IT budgets - they're the ones who can actually see and control their bandwidth usage.
Ready to take control of your network performance? Get a free trial of PRTG Network Monitor and see how proper network visibility can transform your IT operations.
FAQ: The real deal about bandwidth & security
How does bandwidth monitoring contribute to cyber security predictive risk scoring?
Bandwidth monitoring provides the foundation for detecting security threats before they cause damage. By establishing normal traffic patterns, you can quickly spot anomalies that might indicate security incidents - like a server suddenly sending large amounts of data at 3 AM or a workstation communicating with suspicious IP addresses. These unusual patterns often appear in bandwidth metrics before traditional security tools detect the threat. For effective security monitoring, focus on establishing baselines during different time periods and setting alerts for deviations that exceed normal thresholds.
Want to get started with baseline testing? Check out easy ways to quickly test your bandwidth for establishing your security monitoring foundation.
Can bandwidth usage patterns improve cyber security predictive risk scoring for threat detection?
Absolutely! Unusual bandwidth patterns are often the earliest indicators of security compromises. For example, malware typically creates distinctive traffic signatures - like regular small data transfers to unknown servers or sudden spikes in DNS requests. Ransomware often reveals itself through unusual scanning behavior as it searches for files to encrypt. By monitoring these patterns, you can detect threats days or even weeks before they fully activate. The key is understanding what normal looks like on your network so abnormal patterns stand out immediately.
Learn to distinguish between normal and suspicious traffic with the top 5 causes of sudden network spikes to enhance your threat detection capabilities.
What bandwidth metrics should I monitor for effective cyber security predictive risk scoring?
Focus on these key metrics for security-oriented bandwidth monitoring: traffic volume by time of day, protocol distribution, connection counts, and data transfer directions (inbound vs. outbound). Unusual increases in outbound traffic often indicate data exfiltration, while abnormal protocol usage might reveal command-and-control communication. Pay special attention to off-hours activity and connections to unfamiliar destinations. For comprehensive monitoring, track both north-south traffic (between your network and the internet) and east-west traffic (between devices on your internal network).
Discover how can i monitor my available bandwidth 24/7? to implement continuous security monitoring across your entire network.
 Published by


