 Published by Beat Köck
Last updated on July 13, 2026
•
19 minute read
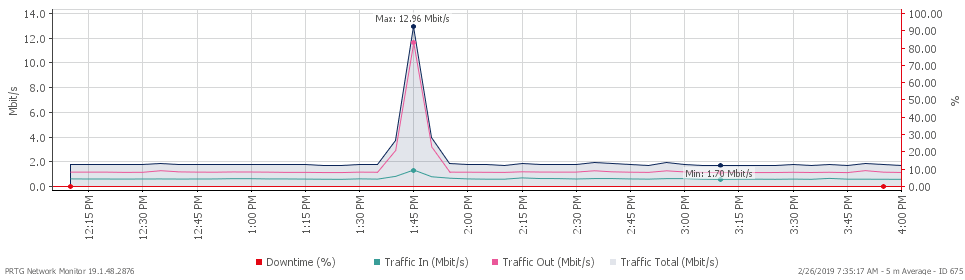
Here's something we've noticed over the years: Once IT teams implement a bandwidth monitoring solution, they get curious. Really curious. Most bandwidth monitoring solutions make it pretty straightforward for IT teams to spot those alarming peaks in network traffic through graphical interfaces.
You know the ones I'm talking about. Modern network monitoring tools use SNMP Traffic sensors, flow-based monitoring (NetFlow, sFlow, jFlow, IPFIX), and packet sniffing capabilities to catch bandwidth anomalies, ping spikes, and jitter as they happen.
There are many different causes of sudden network spikes. And as a good sysadmin, you really should dig into the root cause of any unusual bandwidth usage. Proper network diagnostics and troubleshooting are your friends here.


What Causes Sudden Network Spikes?
We've been working with customers to identify bandwidth spikes for 20 years now. That's a lot of troubleshooting calls, believe me. According to our customer feedback, we've identified the top five most common culprits behind network congestion and traffic spikes. These issues hit both wired connections and wireless networks. Sometimes they show up as bandwidth spikes, other times as ping spikes, or jitter that messes with real-time applications and services.
1. Scheduled Backups Inside The LAN
Look, I can't stress this enough: regular backups are absolutely critical. Most companies schedule their backups to run at certain time intervals or specific times of the day. Makes sense, right? But here's the thing. Since backups usually contain massive amounts of data, they eat up a lot of bandwidth to complete quickly.
They can even max out a 1 GBit ethernet connection completely. We're talking about a huge spike in your bandwidth traffic here, which can lead to latency spikes, ping spikes, and all sorts of network problems for other applications trying to do their job.
 So what's the solution? Schedule your backups during non-business hours or off-peak hours. This is especially important if they contain large amounts of data and run daily (which they absolutely should!). If your company operates across several time zones, pick a time window that causes the least disruption. Proper scheduling really does help optimize network performance and keeps connectivity issues from popping up during critical business operations.
How to detect backup-related spikes: Set up SNMP Traffic sensors on your network switches. Configure threshold alerts to notify you when bandwidth usage goes beyond normal levels. PRTG can send automatic notifications via email, SMS, or push notifications when those predefined limits get breached. This way you can verify whether scheduled backups are running as expected or if they're causing unexpected network congestion.
2. Remote Backup Tools
What I said about backups inside the LAN? That goes double for remote ones. Many networks these days use cloud-based solutions for safeguarding their data. Usually as a complement to local backups, which is smart. But uploading huge amounts of data puts serious stress on your bandwidth. It can really affect your internet connection quality, especially if your ISP has bandwidth limitations or throttling policies during peak hours.
When that happens, other web applications, video calls, and online services might run at a snail's pace. Or they might stop working altogether due to network congestion. You'll see stutters and jitter that really degrade the user experience. Not fun for anyone.
Here's another wrinkle: Remote backups can also be affected by VPN connections. VPNs add encryption overhead and that can reduce your effective bandwidth. If your organization uses multiple remote sites connected via VPN, you need to coordinate backup schedules. Otherwise you risk simultaneous uploads that could completely saturate your internet connection. Same advice as before applies here: Schedule your remote backups during non-business hours if you can. This maintains optimal internet speed for daily operations and prevents ping spikes during critical business hours.
Monitoring remote backup traffic: Use flow-based monitoring with NetFlow, sFlow, or IPFIX sensors to identify which applications and IP addresses are hogging the most bandwidth. This granular visibility helps you tell the difference between legitimate backup traffic and potential issues. Like failed backup jobs that just keep retrying over and over, creating those repetitive traffic patterns.
3. Software Updates and Firmware Patches
Keeping your virus protection up to date is crucial for data integrity and privacy protection. No argument there. Most solutions update several times a day to protect against new security holes and other threats. Other software products do the same thing. Microsoft Office, the Adobe Suite, your operating system. They all roll out regular updates.
These updates can eat up significant bandwidth and cause temporary latency issues and ping spikes. And don't forget about firmware updates for network equipment like routers, switches, and Wi-Fi access points. Those can create unexpected traffic spikes too.
Now, most virus scanner updates get distributed via LAN to all network computers. This actually reduces the bandwidth consumption of your internet connection, which is good. But depending on the size of the update, you might still see a traffic spike on your LAN bandwidth monitor. If each of your network's computers downloads software updates by themselves? That can lead to serious congestion of your internet connection and high ping times. This particularly affects wireless networks where available bandwidth is already more limited than wired ethernet connections.
If possible, try to distribute all your software and operating system updates via LAN. Or configure QoS (Quality of Service) settings on your router to prioritize critical traffic. Otherwise, huge updates (think the newest Windows or Linux version) might really affect your internet speed and mess up daily tasks. You'll see lag spikes and stutters for users running bandwidth-intensive apps like video conferencing or cloud-based collaboration tools. Consider implementing a centralized patch management system that can schedule updates during maintenance windows. It's worth the effort.
Technical detection approach: PRTG's QoS sensors can measure network performance parameters including jitter. They help you identify when software updates are degrading service quality. By monitoring both bandwidth utilization and QoS metrics at the same time, you can correlate traffic spikes with application performance degradation. Pretty handy.
4. Mail Server Problems
Delivering and receiving emails is one of the most frequent tasks your network handles. Simple text-only emails or messages with small attachments usually don't stress the network much, even in large numbers. But when something goes wrong with mail delivery? Many mail servers are incredibly persistent in trying to send out the messages over and over again. This creates repetitive traffic patterns that you can spot through network diagnostics.
Here's a typical case. Someone sends an email with an attached file (maybe a 10 Mbyte JPEG or a short video clip) to a distribution list with 100 or more recipients. Think of the new guy bringing cake on his first day and sending an email to the whole team. Just a random example, of course. Could never happen at Paessler. Cough.
Anyway, sometimes the two SMTP implementations are just a bit incompatible. To solve the problem, the target mail server had to be set to deny access from the remote server's IP address. Not ideal, but it happens.
Mail server issues can also come from DNS server misconfigurations. When the mail server can't resolve recipient domains correctly, it leads to repeated connection attempts. And then there are mail loops caused by incorrect forwarding rules. These can generate massive amounts of traffic as messages just bounce between servers indefinitely. I've seen this create some truly spectacular traffic spikes.
Identifying mail server traffic anomalies: Monitor your mail servers with dedicated sensors that track SMTP traffic volumes and connection attempts. Flow monitoring can help you identify the source and destination IP addresses involved in excessive mail traffic. This makes it easier to figure out whether the issue is internal misconfiguration or external factors.
5. Malware Outbreaks And Hacking Attempts
If your traffic suddenly rises for no apparent reason, you might be looking at a hacking attempt or malware outbreak. The heavy hitters like DDoS attacks usually get detected pretty quickly because of their strong and immediate impact on network performance. They often cause complete disconnects or severe service degradation. Hard to miss those.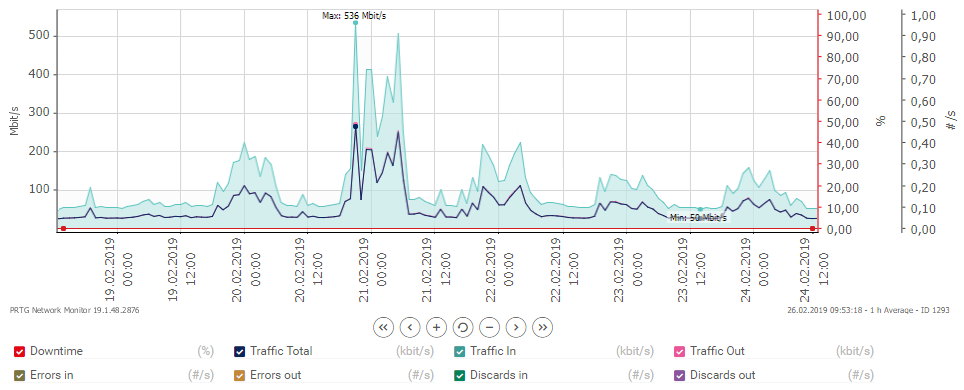
But more subtle attacks? Those are trickier to reveal. They may cause intermittent latency spikes, ping spikes, or unusual bandwidth patterns. By keeping an eye on your bandwidth monitor and doing regular network diagnostics, you can spot potential malware outbreaks or hacking attempts before they cause serious network problems.
Malware can show up in various ways. Botnet traffic. Cryptocurrency mining operations that consume bandwidth and CPU resources. Data exfiltration attempts. Command-and-control communications. Modern malware often tries to blend in with normal traffic patterns, which makes detection more challenging without proper monitoring tools.
Advanced detection methods: PRTG can detect unusual activity between network components and warn you about potential security issues. By establishing baseline traffic patterns for your network, you can configure threshold alerts that trigger when traffic deviates significantly from normal behavior. Flow sensors can classify network traffic by source and destination. This helps you identify suspicious communication patterns like unusual outbound connections to unknown IP addresses or unexpected internal scanning activity.
How to Troubleshoot and Identify the Root Cause of Network Spikes
So you've ruled out these five most common causes for traffic spikes. Now what? Three simple troubleshooting steps can help you identify the root cause of your unusual bandwidth usage and ping spikes.
Step 1: Find a Pattern in Your Network Spikes
Try to find a pattern in the spikes. Do they always appear at the same time intervals? Same time each day? Do they happen during business hours or peak hours (probably a user causing the peak) or not (more likely a scheduling issue)?
PRTG's graphical interfaces provide historical data visualization that makes pattern recognition easier. You can overlay multiple time periods and identify recurring anomalies in bandwidth usage, ping spikes, and jitter. Sometimes the pattern jumps right out at you. Other times you need to dig a bit deeper.
Step 2: Correlate Network Spikes with Other Metrics
Once you find a pattern, try finding other monitoring points on the monitored system that match these patterns. Maybe a CPU load peak of one of your servers is in sync with the bandwidth load. Or you notice packet loss correlating with the spikes.
Check whether the spikes coincide with specific user activities, application launches, or automated processes. Also think about whether the issues affect only wired connections or if they also impact Wi-Fi networks. That could point to wireless-specific problems like interference or access point overload.
Here's something else to check: If you're experiencing persistent ping spikes on specific devices, take a look at the physical infrastructure. A faulty ethernet cable or malfunctioning network adapter can cause intermittent connectivity issues that show up as traffic spikes. Hardware-related problems often create irregular patterns that look different from software-induced spikes. I've spent way too many hours tracking down bad cables over the years.
Step 3: Deep Packet Analysis for Network Spike Detection
Try to analyze the traffic with a packet sniffer or a flow monitoring tool. This gives you real insight into the data that might have caused the network spike. Paessler PRTG monitoring software includes packet sniffing as well as flow monitoring (supporting NetFlow, sFlow, jFlow, and IPFIX protocols). You can analyze your network data and classify traffic by source, destination, and application type.
Monitor and Prevent Network Spikes with PRTG
PRTG can also measure QoS parameters, monitor latency and jitter, and help you perform comprehensive network diagnostics. The platform supports monitoring across diverse infrastructure. Routers, switches, modems, firewalls, wireless networks, VPN connections. You name it.
You can set up customizable alerts with multiple notification methods including email, SMS, push notifications, and SNMP traps. This ensures you're immediately informed when bandwidth thresholds are exceeded or ping spikes occur. No more surprises.
For additional troubleshooting, you can use tools like ping test, traceroute, or tracert to identify connectivity issues along the network path. These tools help you figure out whether latency spikes and ping spikes originate from your local network, your ISP's infrastructure, or somewhere along the internet backbone. When you're troubleshooting, also verify your network adapter settings and check for damaged ethernet cables. Those can cause intermittent connection problems that affect bandwidth-sensitive apps.
Ready to take control of your network bandwidth? Download PRTG's free trial and start monitoring your network traffic with SNMP sensors, flow monitoring, and packet sniffing capabilities.

Identify bandwidth spikes, ping spikes, and jitter before they impact your business operations.
What are your most common causes of network spikes? And how do you notice them? Leave us a comment and share your experiences.


