Originally published on December 11, 2019 by Patrick Gebhardt
Last updated on February 10, 2020
•
2 minute read
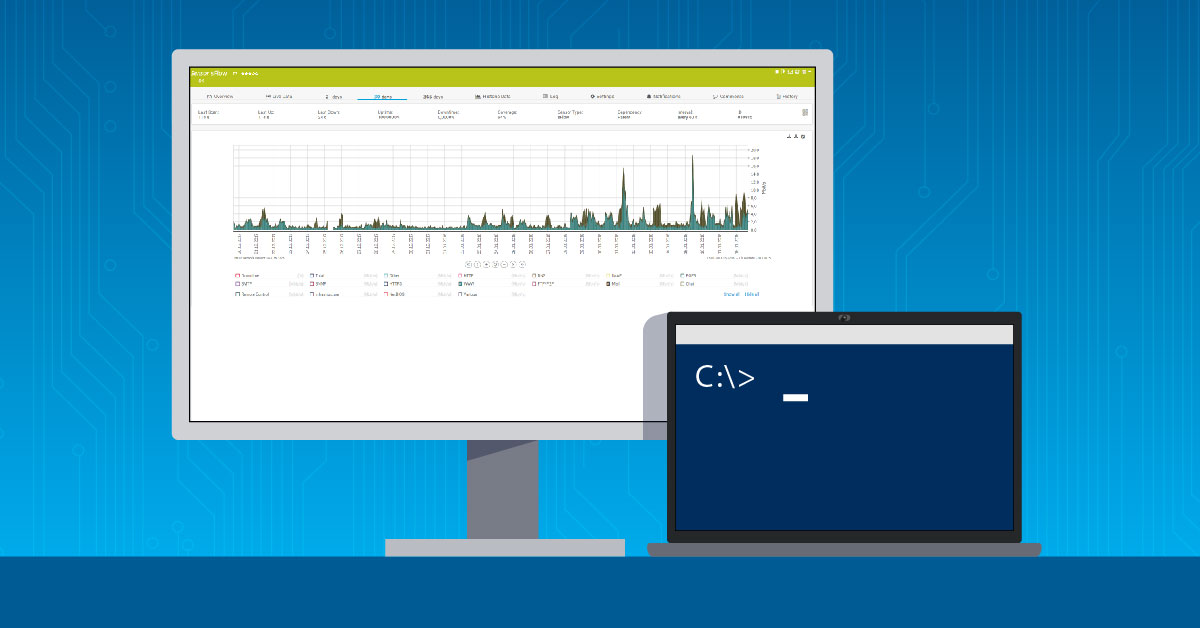
Bandwidth is like pie. Having more is always good and sharing is fundamentally bad. You can display your daily consumption in clearly arranged pieces of pie and check the parts that don't make sense - if you have the right tool for it.
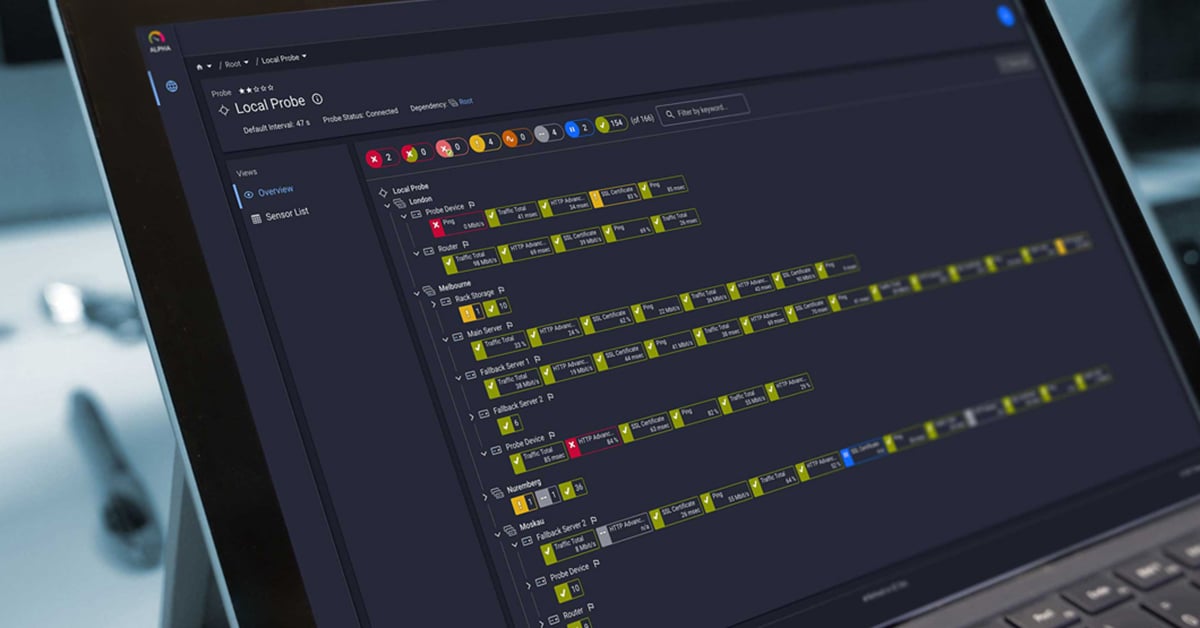
PRTG would be such a tool. In this video, I tell you what bandwidth is exactly, how to measure it, and how to get a reliable overview of your used bandwidth:
This article is part of a new series on basic monitoring issues & mechanisms. Follow our YouTube channel so that you don't miss any new videos and tutorials.
Since 1997, we offer monitoring solutions for businesses across all industries and all sizes, from SMB to large enterprises. We believe monitoring plays a vital part in reducing humankind's consumption of resources. Our products help our customers optimize their IT, OT and IoT infrastructures, and reduce their energy consumption or emissions – for our future and our environment.
Thurn-und-Taxis-Str. 14
90411 Nuremberg, Germany
info@paessler.com
+49 911 93775-0
+49 911 93775-409
©2021 Paessler AG · Terms & Conditions · Privacy Policy · · Legal Notice · Download & Install