 Published by Michael Becker
Last updated on October 09, 2023
•
7 minute read
Paessler PRTG offers comprehensive monitoring for your entire network, right out of the box, easy to use and quickly available. But sometimes you need to go beyond that to extend your monitoring. For these cases, we offer additions that add value to your entire monitoring setup.
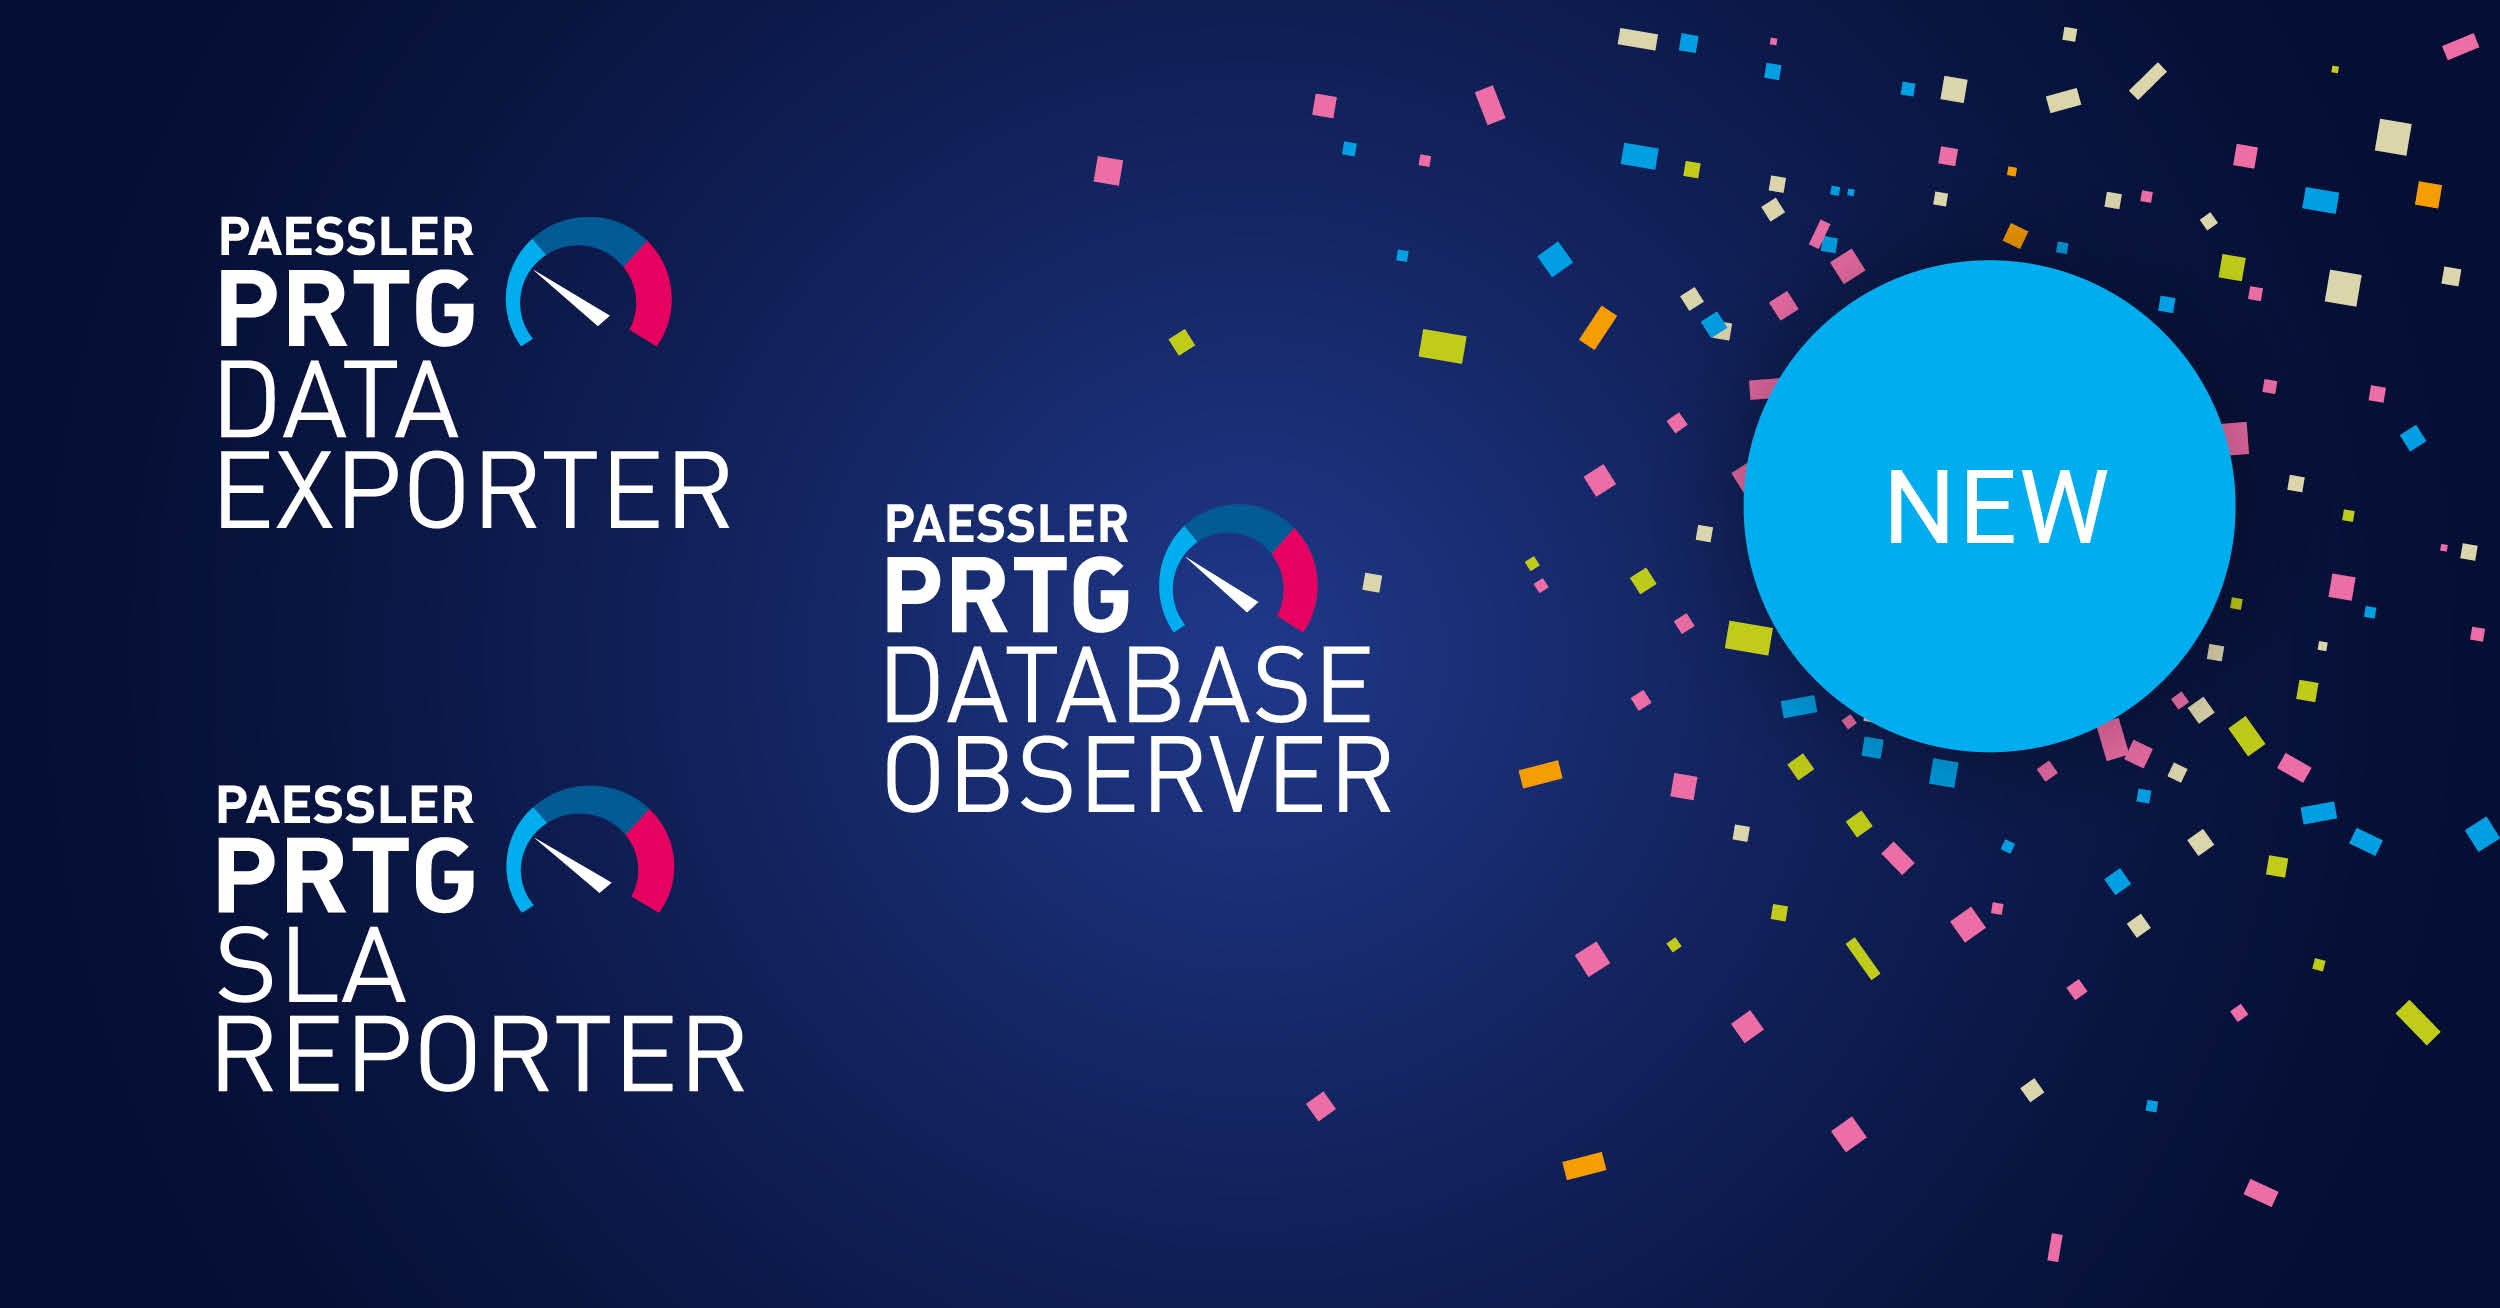
We’re excited to announce that you now have the option of adding SLA reporting, data exporting and in-depth database monitoring to your Paessler PRTG deployment.
We would like to present you with an overview of these newest extensions.
Paessler PRTG SLA Reporter
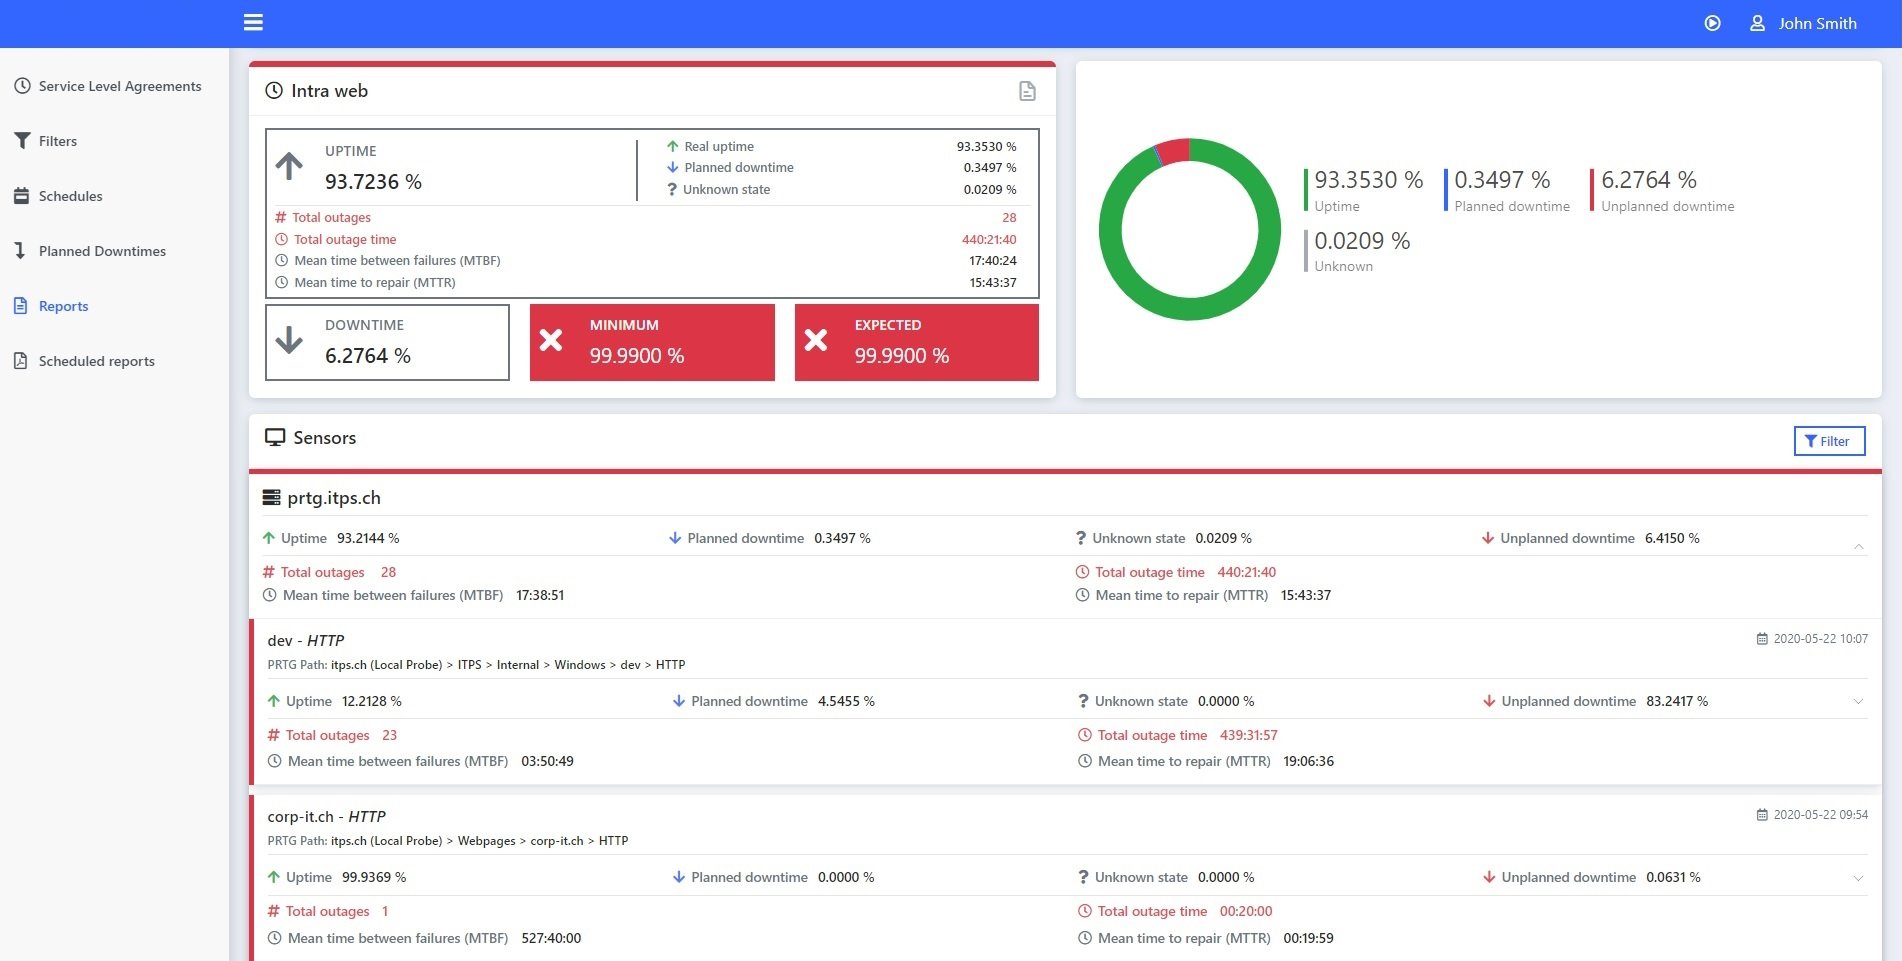
PRTG SLA Reporter is a comprehensive tool that helps you ensure consistent compliance with service level agreements (SLAs), ultimately increasing customer satisfaction and confidence in your services.
 Let's delve into some key features:
⏩ Support for multiple PRTG core servers: Simplify your monitoring efforts by consolidating data from multiple PRTG servers into a single SLA.
⏩ Public reports: Enable public access to specific SLA reports via direct links, making it easy for customers and stakeholders to stay informed.
⏩ Scheduled Reports: Automate report delivery on a defined schedule to ensure timely distribution of critical SLA information.
⏩ Intelligent SLA object definition: Simplify sensor management in PRTG by defining rules for automatic inclusion of SLA objects using filters.
PRTG SLA Reporter is your tool for improving your SLA reporting and effectively managing both planned and unplanned downtime. It retrieves monitoring data from PRTG via the PRTG RESTful API and stores it in a Microsoft SQL database. Its web-based graphical user interface ensures easy access for all team members and encourages efficient collaboration.
Need more information? Take a look at our website:
Paessler PRTG Data Exporter
Introducing the PRTG Data Exporter, your gateway to export your monitoring data in a relational database format to your preferred database management system (DBMS).
With PRTG Data Exporter, you have the freedom to:
⏩ Specify which groups, devices, or sensors you want to collect data from.
⏩ Define the desired time periods for data retrieval.
⏩ Specify the exact location for your data and leave the rest to the extension.
 PRTG Data Exporter initiates data collection based on your custom settings. You can choose continuous collection to ensure that all new data is regularly synchronized with your database. You can also assign different data sets to different databases or consolidate data from different sources into a single database. If you prefer, you can even aggregate data from multiple PRTG core servers into one central repository.
The user-friendly interface of the PRTG Data Exporter simplifies the data collection process and allows you to configure:
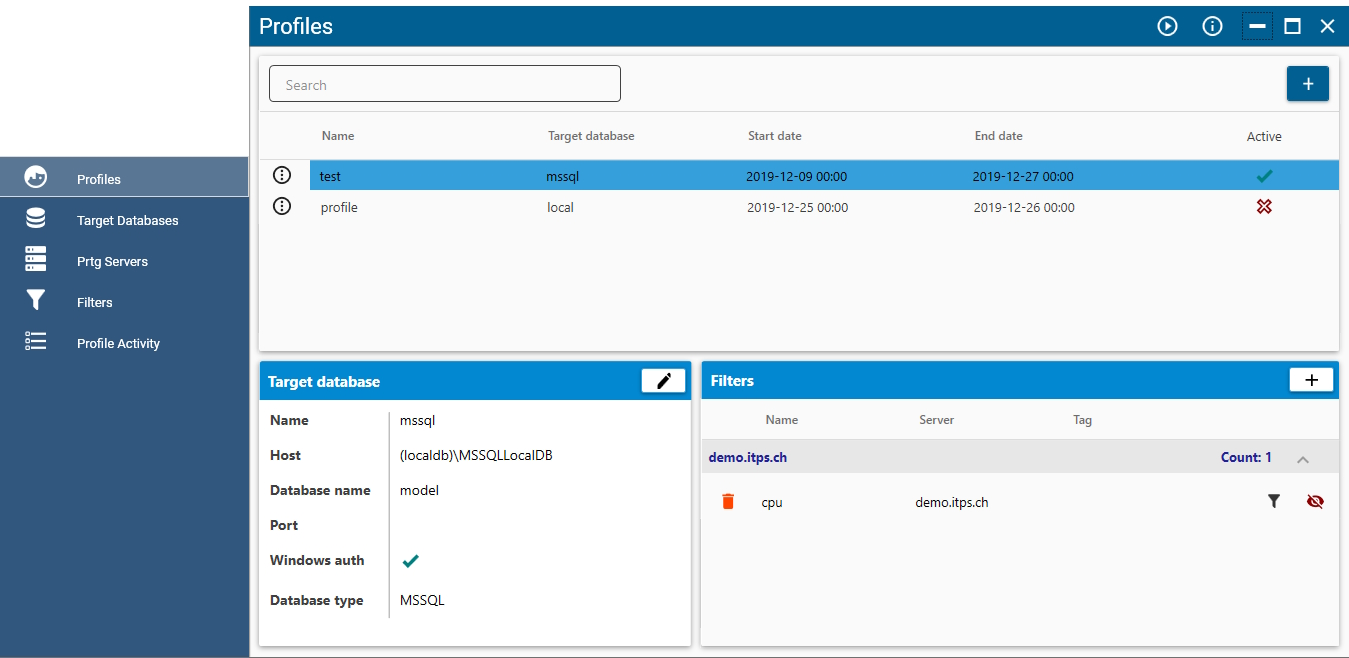
⏩ Profiles: These are the primary configurations that define the data to be collected, the target database and the timeframe. You can select between ad-hoc or continuous data collection.
⏩ Filters: Filters specify the source data, including PRTG server details, PRTG object IDs and PRTG tags to identify the data to be collected. Filters can be shared between different profiles.
⏩ Databases: Each profile is associated with a specific target database, and multiple profiles can use the same database for storage.
Have a look at our website to get more information and details:
Paessler PRTG Database Observer
PRTG Database Observer provides a valuable solution for monitoring databases. It enables administrators to get insights into key performance indicators, ensure continuous awareness of database performance status, fine-tune databases according to the insights gained, and proactively detect irregularities before they affect users.
This extension simplifies the collection of business-related data and statistics and offers various visualization options. Critical database attributes that are essential for business operations can be monitored and visualized directly within PRTG.
 Some key features include:
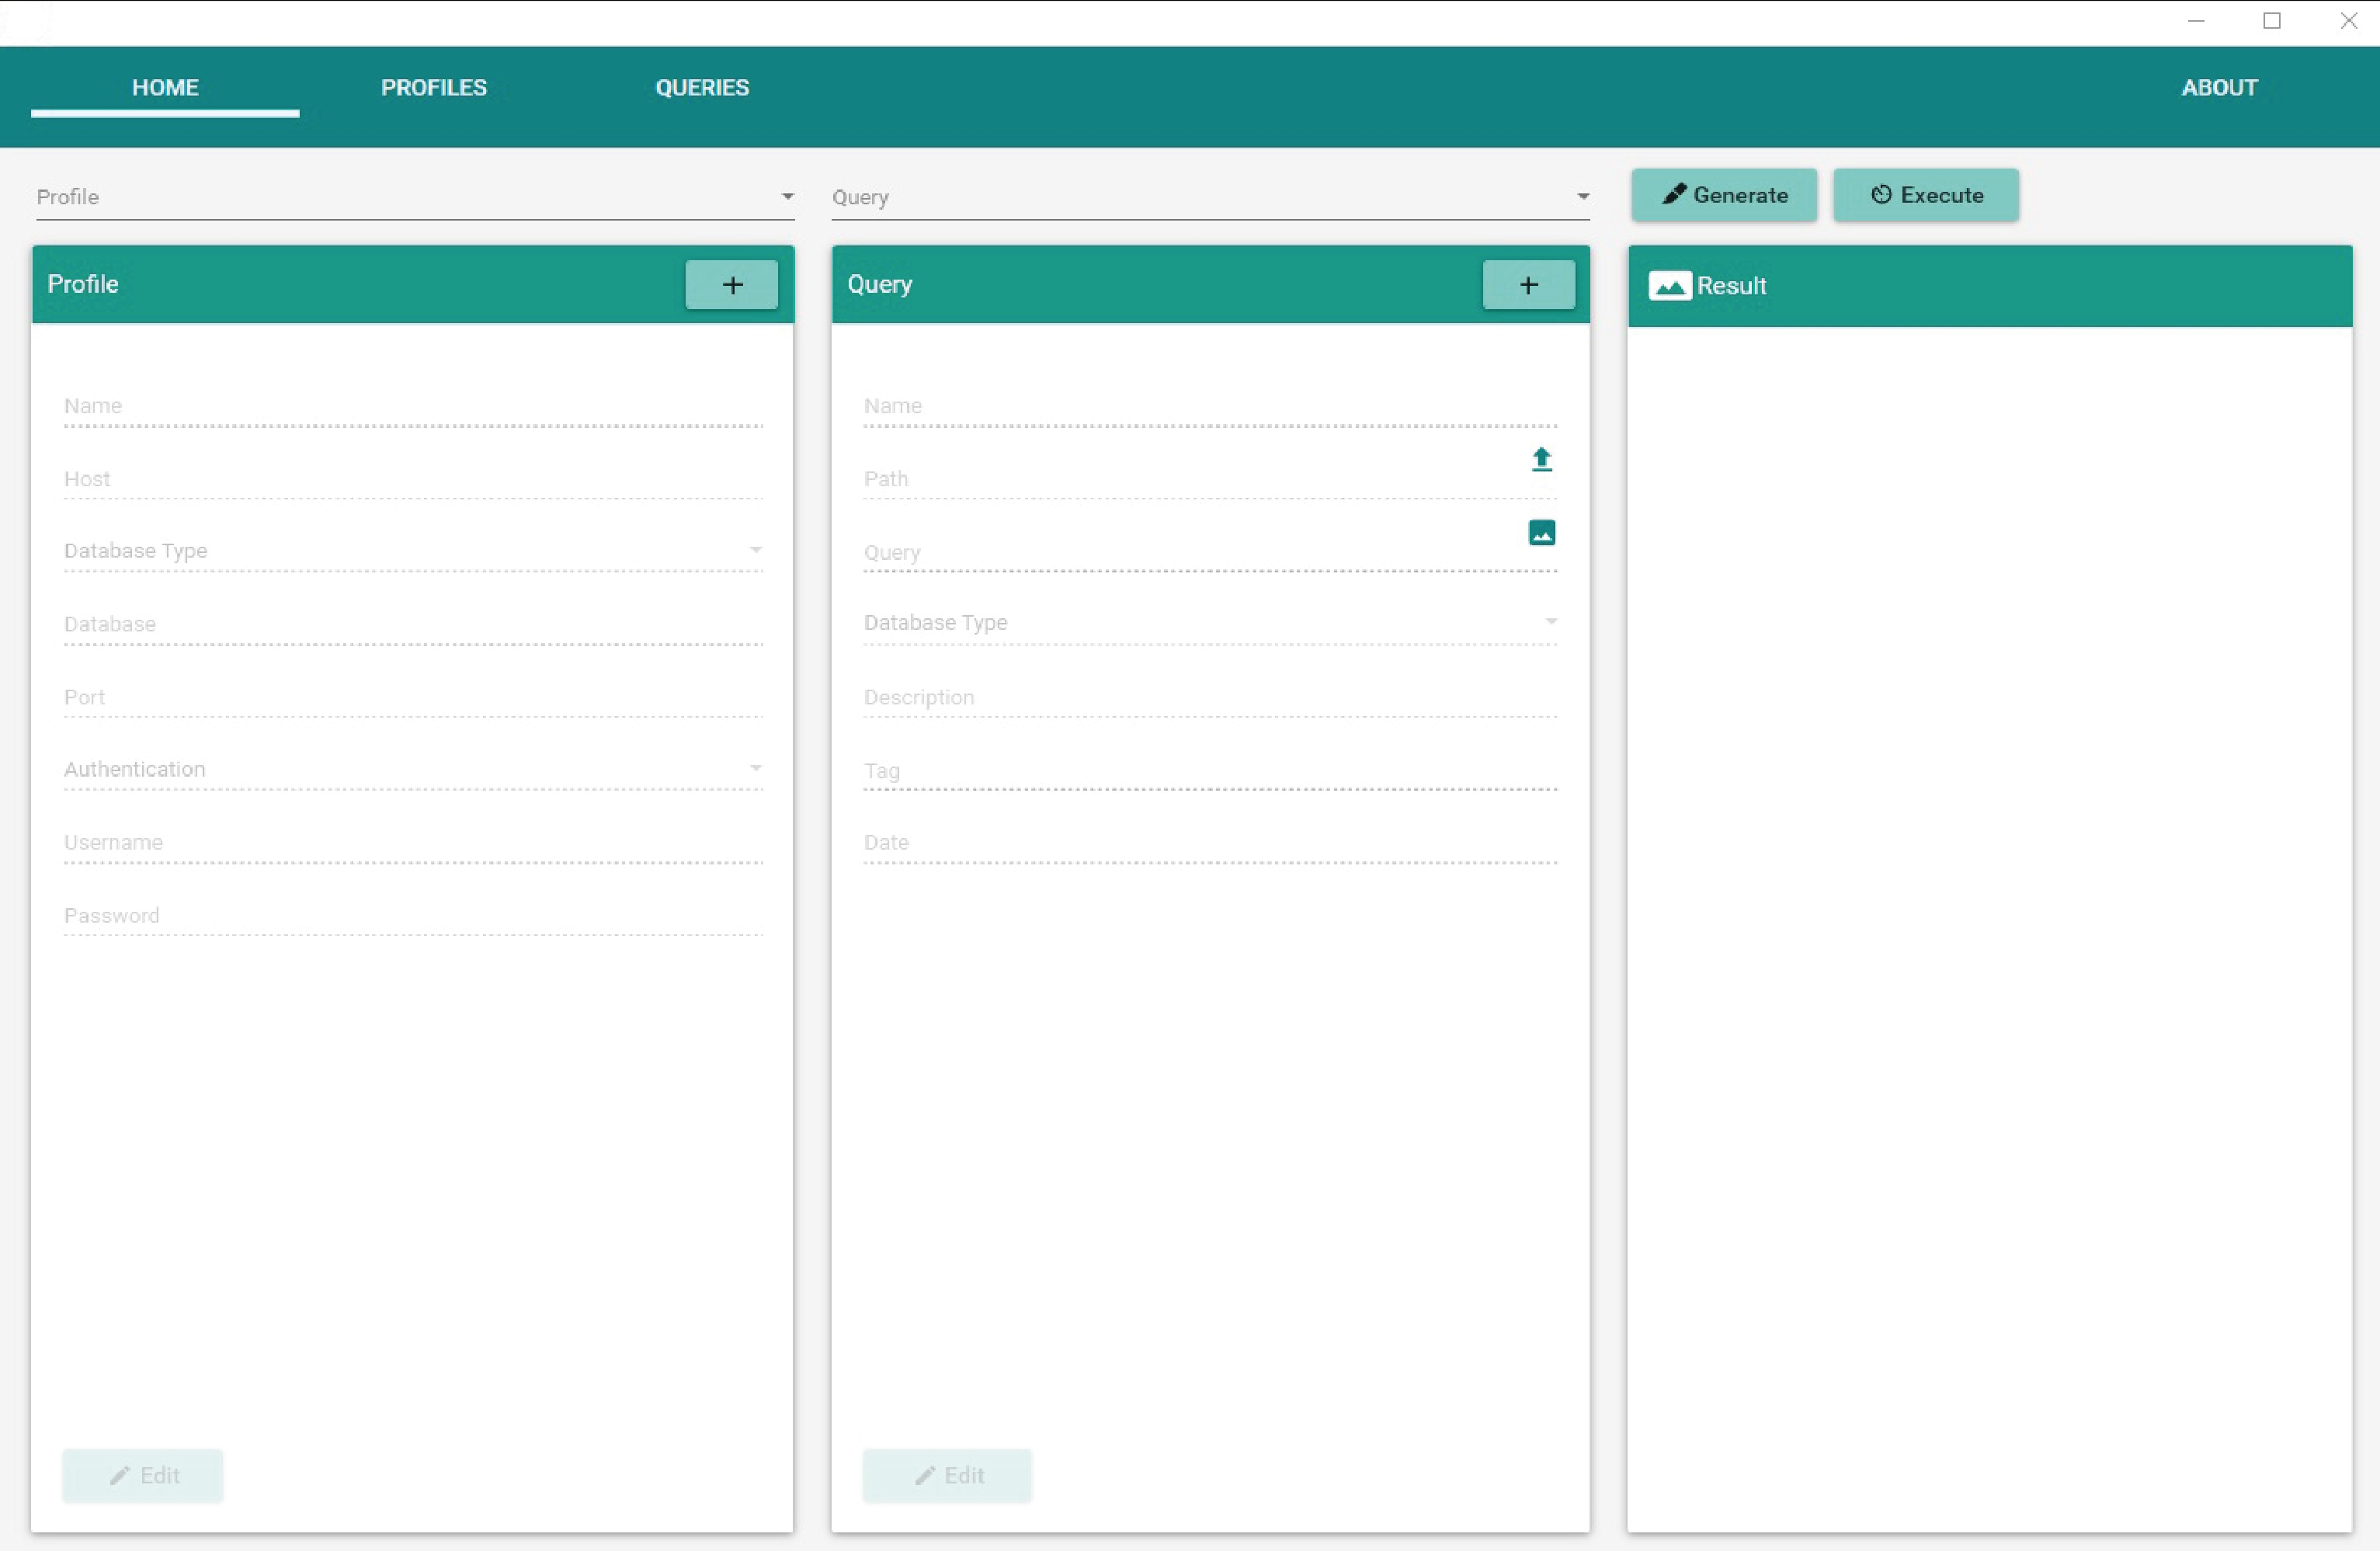
⏩ Access data from multiple database systems including MSSQL, SAP Hana, MySQL, Oracle, IBM DB2, SAP MaxDB, and more.
⏩ Access existing templates and queries designed by experienced DBAs.
⏩ Create and share custom queries.
⏩ Consolidate availability, performance, and business-related data into a single platform.
PRTG Database Observer provides extensive flexibility in querying your database system. It provides access to pre-defined DBMS monitoring templates and uses inspiration from experienced DBAs for effective monitoring strategies.
As a Windows desktop app, the PRTG Database Observer acts as a communication bridge between PRTG and your database management system. It allows you to select from existing queries or create custom monitoring queries that are executed against the database engine at defined scan intervals.
More information can be found on our website:
👉 Paessler PRTG Database Observer
Our team is here to help
Each of these three new extensions are individually offered to extend the capabilities of any PRTG Enterprise or PRTG Network Monitor installation, giving you the flexibility to use only the features you need.
Do you have any questions about our new product extensions in terms of pricing, licensing, maintenance, and updates?


