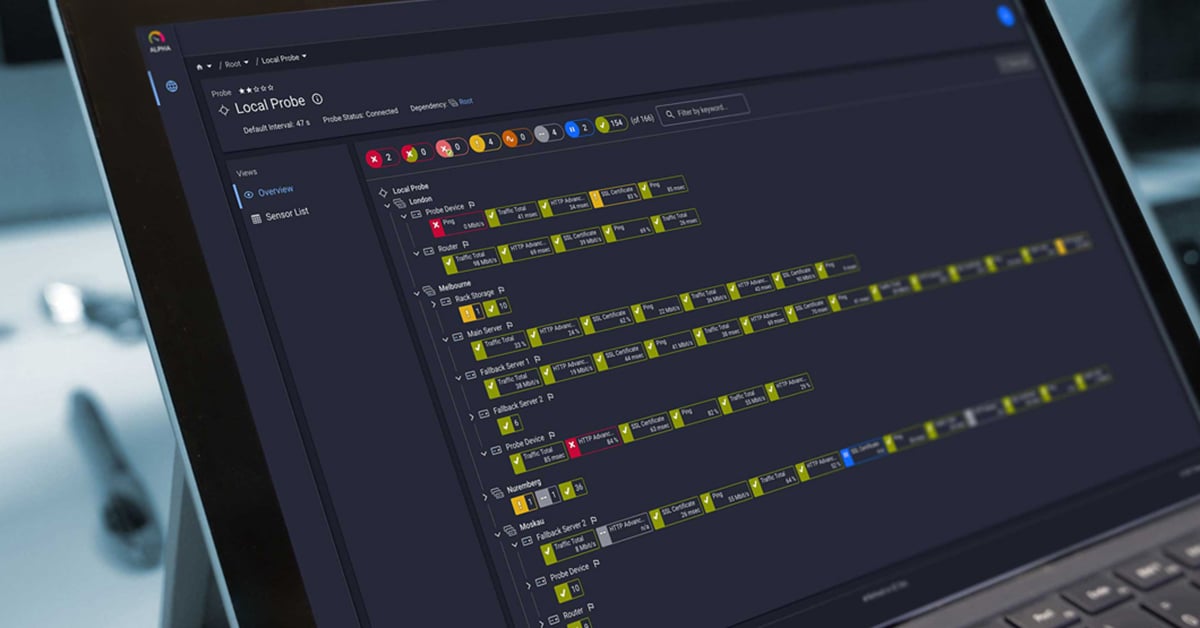
You've set up PRTG, discovered all your devices, implemented specialized sensors, and configured your notifications. However, as your monitoring environment grows, it becomes more challenging to find what you need quickly. That stack of sensors scattered throughout your device tree might work for now, but what if you need to focus on your storage systems during an outage?
This week, we'll explore PRTG's Libraries feature, which is a powerful way to create custom views of your monitoring environment that match your specific needs and workflows.
Why your device tree isn't enough
The standard device tree in PRTG is organized by network structure: probes, groups, devices, and sensors. While this makes technical sense, it doesn't always align with how you use your monitoring data.
Consider the following scenarios: You need to check all database servers across different network locations. Or, perhaps you want to monitor all sensors related to a specific business service, regardless of the devices involved. Or, perhaps your team has specialists who each need customized views of only relevant sensors. The standard device tree forces you to jump between different branches, making it difficult to see the most important information.
Another common challenge arises when you need different notification settings for sensors based on their business impact rather than their location in the device tree. Without libraries, managing these notifications becomes a tedious, sensor-by-sensor task.
Libraries: A new perspective on your monitoring data
Libraries in PRTG allow you to create custom views that organize your sensors based on any criteria you choose - not just their physical location. Think of libraries as custom filters or lenses through which you view your monitoring data.
The best part? They show the same real-time data as the device tree, with the same scanning intervals and detailed information. The only difference is how the information is organized.
Libraries also let you create logical groupings across different devices, groups, and probes, bringing related monitoring data together. They also enable consistent notification settings for sensors that serve similar functions and provide focused views for different team members. With automatic filtering capabilities, libraries dynamically include only sensors that match specific criteria as your environment changes.
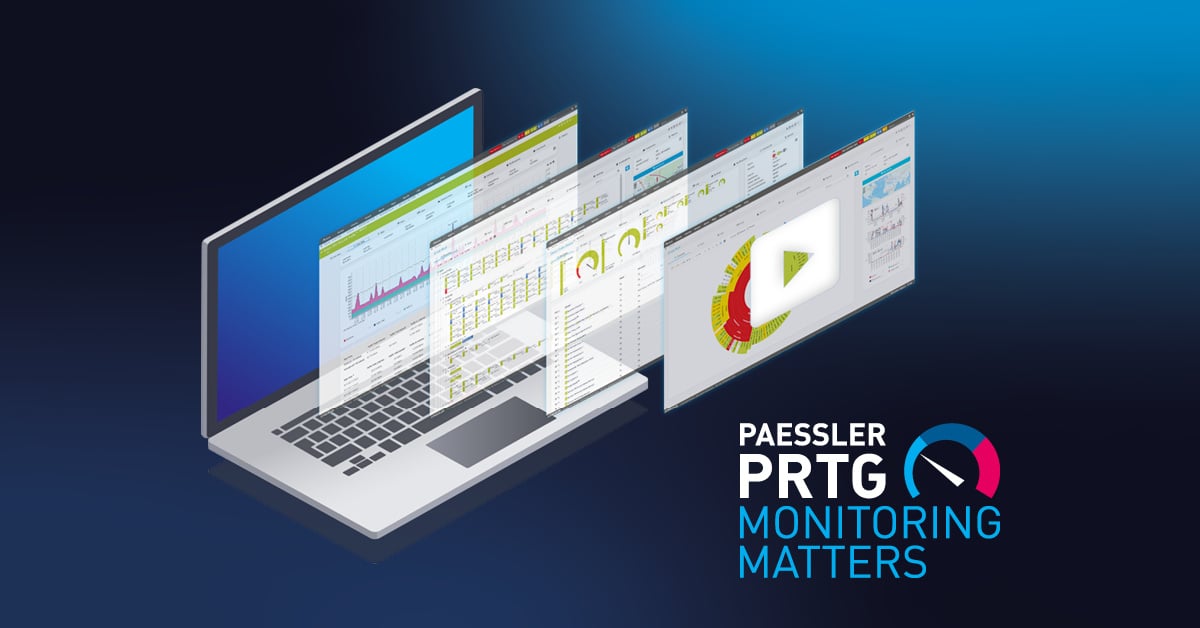
Check out this video tutorial that walks you through the Libraries functionality in PRTG:
Creating your first library in 4 simple steps
Let's go through the process of creating a library that shows all your database-related sensors, regardless of where they're located in your device tree.
1️⃣ Add a new library
Begin by selecting Libraries from the main menu in the PRTG web interface. Click Add Library at the bottom of the page and enter a descriptive name, such as "Database Monitoring." You can optionally define security settings and tags if needed. Once you're done, click Create to establish your new library.
2️⃣ Add library nodes
Once your library is created, you'll see a split screen with your empty library on the left and your device tree on the right. This intuitive interface makes it easy to build your custom view. From the device tree, locate and drag database-related sensors to the library. Each sensor you drop becomes a new library node.
To organize your library further, you can create a logical structure by clicking Add Library Node or Add Group in the bottom-left corner. This allows you to create sections for different database types, such as SQL Server, MySQL, and Oracle, making your library even more useful for quick navigation and monitoring.
3️⃣ Configure library node display settings
After adding content to your library, you can customize how each node appears to match your specific monitoring needs. Right-click a library node and select Edit | Settings to access the configuration options. Under Library Node Display Settings, choose your preferred view, such as a table or graphs, depending on how you want to visualize the data.
One of the most powerful features here is the ability to set filters that automatically include sensors matching specific criteria, like sensor type or tags. This dynamic approach ensures your library stays relevant as your monitoring environment evolves. Once you've configured the settings to your liking, click Save to apply your changes.
4️⃣ View and use your library
Now that your library is set up, click the Overview tab to see your customized view. You can explore the data just as you would in the regular device tree, but with the advantage of your custom organization. Share the library with team members who need this specific view to improve collaboration and efficiency across your IT department.
Also, check out this how-to guide:
👉 Use libraries in PRTG in 4 steps
Real-world library examples that save time
Let's explore some practical examples of libraries that can help you organize your monitoring environment more effectively:
🧩 Role-based libraries
Different IT roles require different monitoring perspectives. Creating role-specific libraries provides each team member with exactly what they need to see. For instance, a network administrator library would contain all the switch, router, and firewall sensors, whereas a storage administrator library would contain all the disk space, SAN, and NAS sensors.
🧩 Service-oriented libraries
Modern IT is about services, not just devices. Organizing sensors based on business services aligns your monitoring with how your organization uses technology.
For example, an Email System Library would include all sensors related to your email infrastructure. Similarly, an ERP system library would group sensors that monitor your ERP application, database, and web servers. For customer-facing systems, a customer portal library could combine all the components that power your external interfaces.
🧩 Priority-based libraries
Not all systems have the same importance, and your monitoring should reflect that reality. Create libraries based on business impact:
- Critical systems library: Include sensors for systems that require immediate attention when issues arise
- Business hours monitoring library: Group sensors that only need attention during working hours
- Development systems Library: Organize sensors for non-production environments that have lower priority
Advanced library techniques
Once you're comfortable with the basics, try these advanced techniques to elevate your monitoring organization.
✳️ Apply consistent notifications
One of the most powerful features of libraries is applying consistent notification settings to groups of related sensors. Open your library, click the Notifications tab, then click Add State Trigger to configure when notifications should be sent.
All sensors in the library will follow these notification rules, regardless of their individual settings in the device tree, making alert management much simpler.
✳️ Use filters for dynamic content
Instead of adding sensors manually, use filters to automatically include matching sensors. Right-click a library node, select Edit | Settings, and under Library Node Display Settings, choose to filter by type, tag, or status.
Your library will dynamically update to include all matching sensors - even new ones added later.
✳️ Combine manual and filter-based approaches
To maximize flexibility, use manual selection and automatic filters together. First, create main library nodes using filters for broad categories. Then, add specific sensors manually as needed. This hybrid approach provides consistency and precision.
Taking action: Your next steps
Are you ready to bring order to your monitoring setup? Start by identifying areas where finding related sensors is currently difficult. Create a library that organizes these sensors more logically, set up consistent notification rules, and share your libraries with team members who would benefit from these custom views.
Organizing your sensors into thoughtful libraries will save you time, reduce confusion, and ensure that everyone can quickly find the monitoring data they need when it matters most.
In next week's article, we'll explore how to create visual dashboards (maps) in PRTG to present your monitoring data in even more compelling ways. Until then, enjoy the newfound organization in your monitoring environment!
 Published by