.jpg) Published by Jasmin Kahriman
Published by Jasmin Kahriman
Last updated on January 23, 2024
•
8 minute read
I recently wrote an article that explains how much bandwidth is consumed between the PRTG core server and remote probes. For the sake of context, a few years ago our reseller Omicron AG from Switzerland set up an installation of PRTG with 10,000 SNMP sensors for one of their customers. Within minutes, they could see that they were only generating 400 kbit/s of network traffic for 10,000 sensors with a one-minute scanning interval (which is less than 3 kbit/s per switch)! If you missed it, you can read it here.
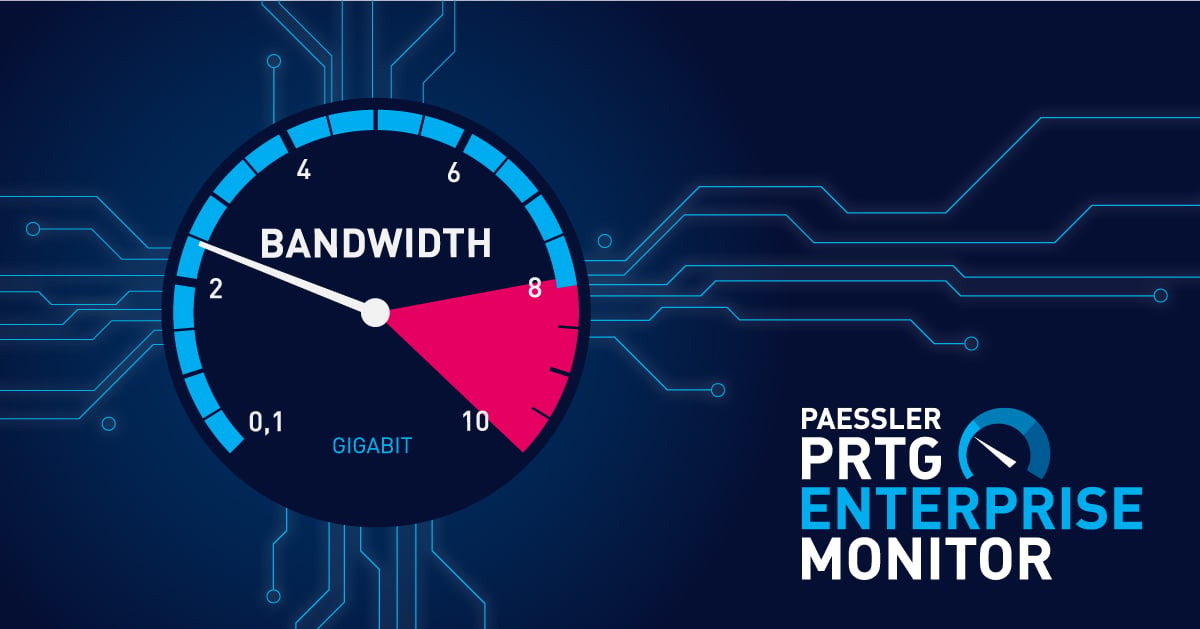

For larger networks, we provide you with our enterprise solution called Paessler PRTG Enterprise Monitor. It scales to large IT environments with thousands of devices and systems across multiple locations, providing an easy way to gain visibility and control of increasingly complex infrastructures. My teammate Shaun did a great video about it.
PRTG Enterprise Monitor consists of a few components including ITOps Board, Elasticsearch, IIS, and SQL server. ITOps Board is integrated with PRTG Core servers and collects the sensors' data per defined time interval. The sensors' data is stored in Elasticsearch, the SQL database stores information about the license, boards, and business services. PRTG Enterprise Monitor is dependent on Active Directory.
The goal of today's article is to show you how you can monitor bandwidth used between ITOps Board, PRTG Core servers, and other relevant components. Before going into sensor configuration, let's briefly cover our backend infrastructure.
The backend infrastructure
In my demo environment, ITOps Board, IIS (Microsoft webserver), and Elasticsearch are installed on the same machine (Windows Server 2019) and SQL server is installed on a dedicated Windows Server. All of these components (except SQL) are part of the PRTG Enterprise Monitor installer.
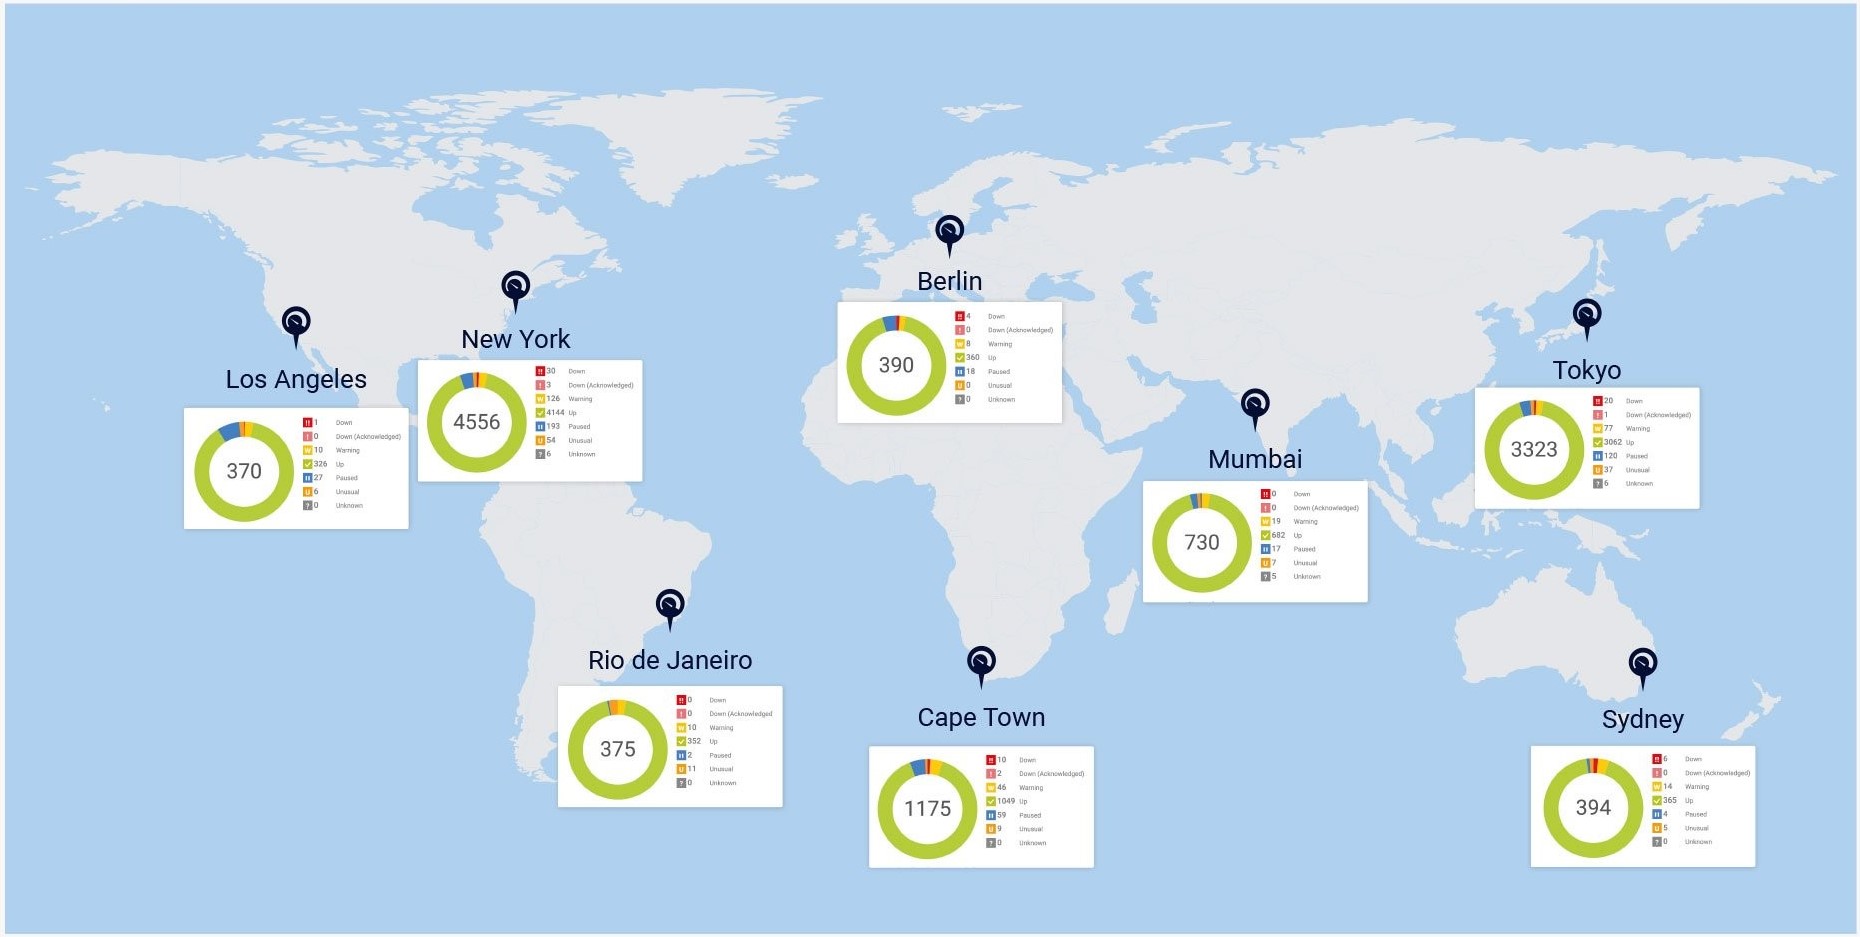
There are six integrations (6 x PRTG core servers), consisting of 23,000 sensors (components). The data you see in the screenshot is generated by sensors, created by IT Admin in ITOps Board UI.
Install remote probe on ITOps Board machine
In order to monitor network traffic between ITOps Board and PRTG core server or other components, you need to install a remote probe on your ITOps Board machine and use a Packet Sniffer (Custom) sensor. This sensor comes into consideration if your network devices do not support SNMP or Flow monitoring to measure bandwidth usage and if you need to differentiate the bandwidth usage by network protocol and/or IP addresses. It is important to understand that the Packet Sniffer sensor can only access and inspect data packages that flow through the network interfaces of the probe system.
Monitor bandwidth between ITOps Board and PRTG Core servers
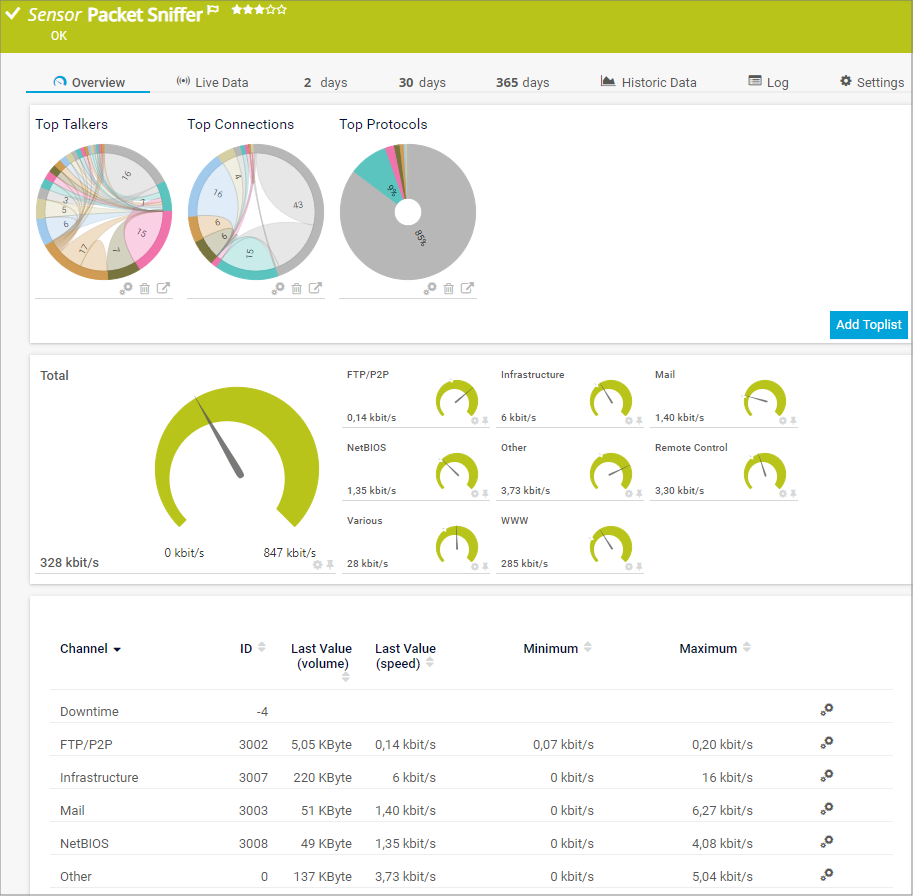
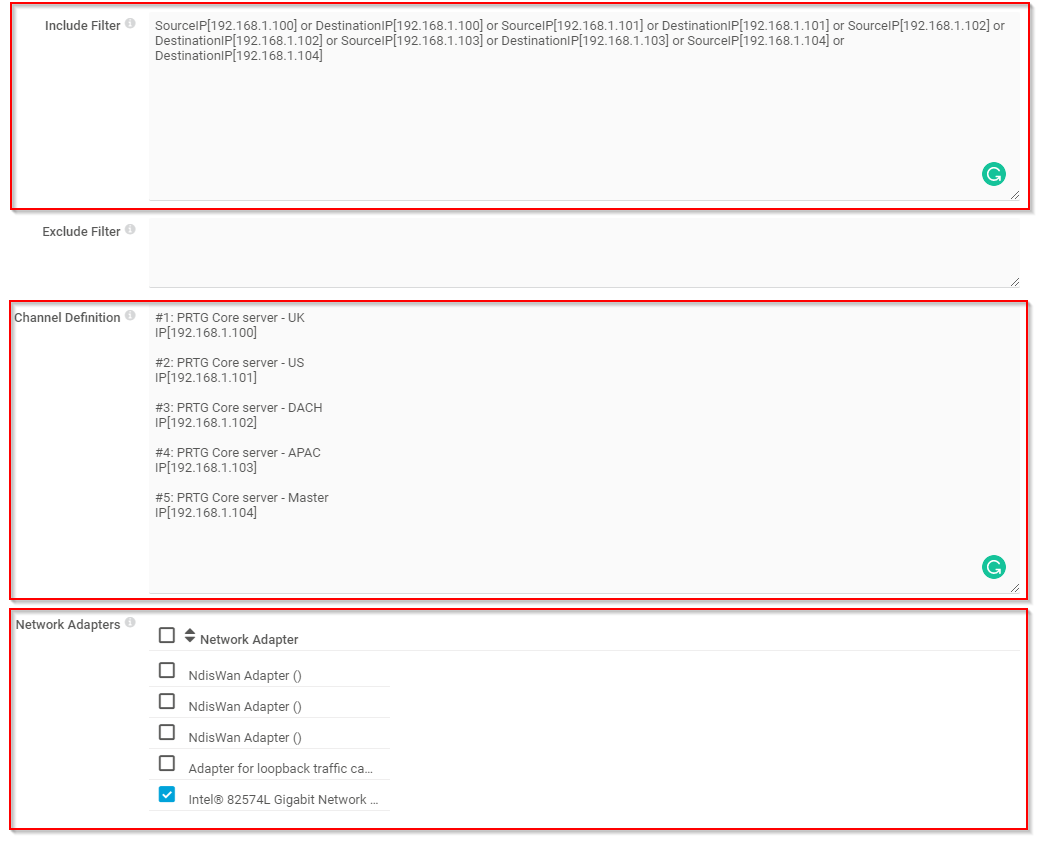
Add the Packet Sniffer sensor on the Remote Probe hosted on your ITOps Board. Once you add it, you need to choose the active/used network card and add a corresponding filter(s). You need to add the source and destination IPs of your PRTG Core server in the “Include Filter” field. By using these filters, Packet Sniffer will perform monitoring only for traffic going to and coming from specified IP addresses.
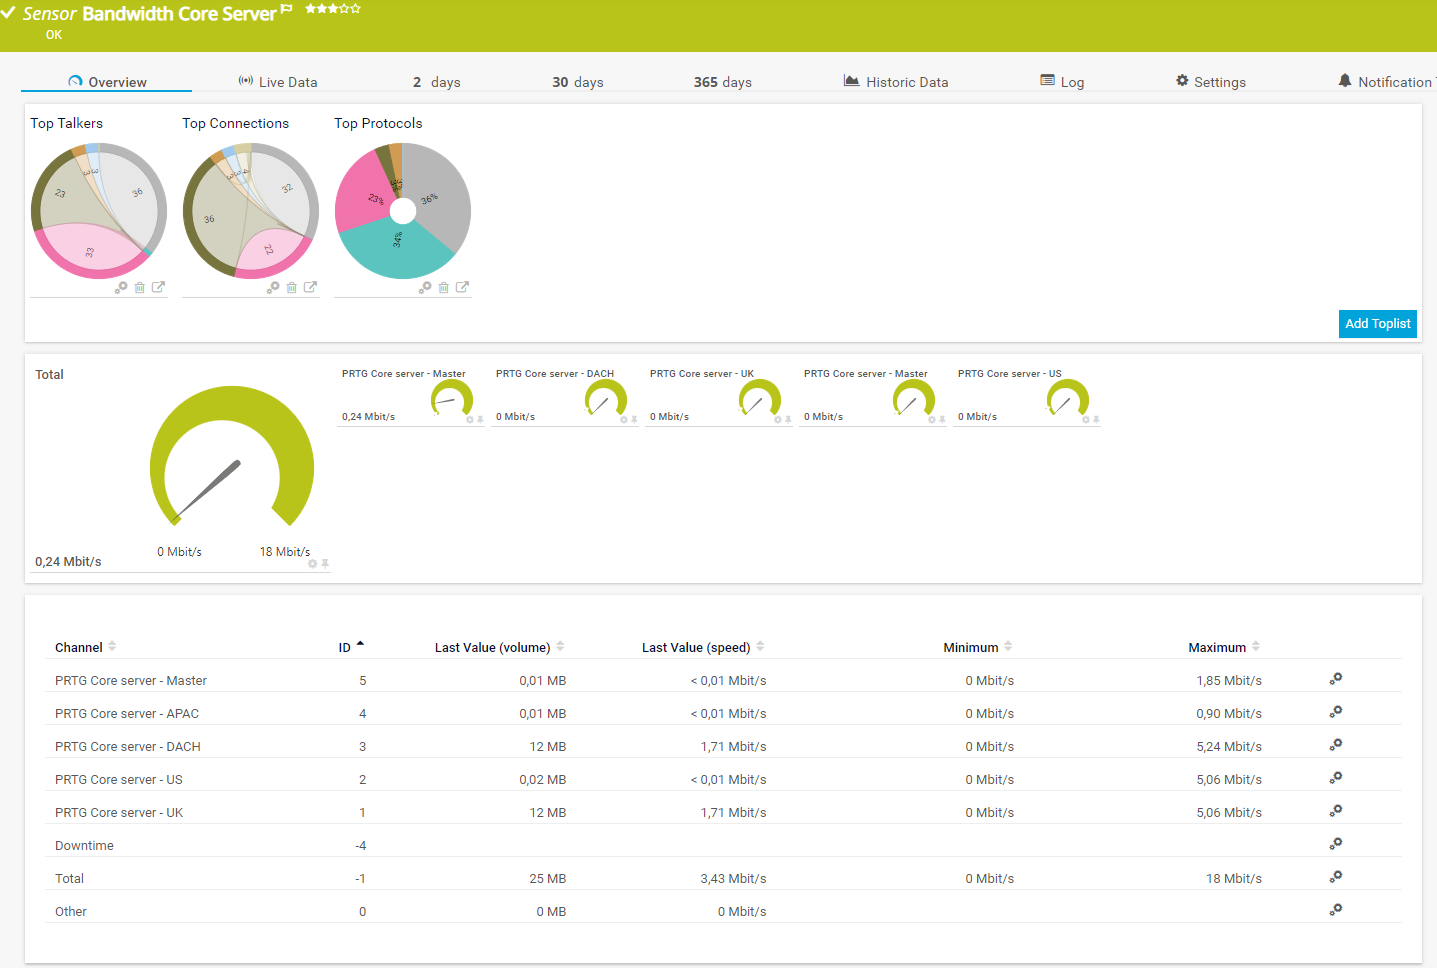
Your sensor will need some time to get the first values. You might see something similar to this.
Monitor bandwidth between ITOps Board and SQL server
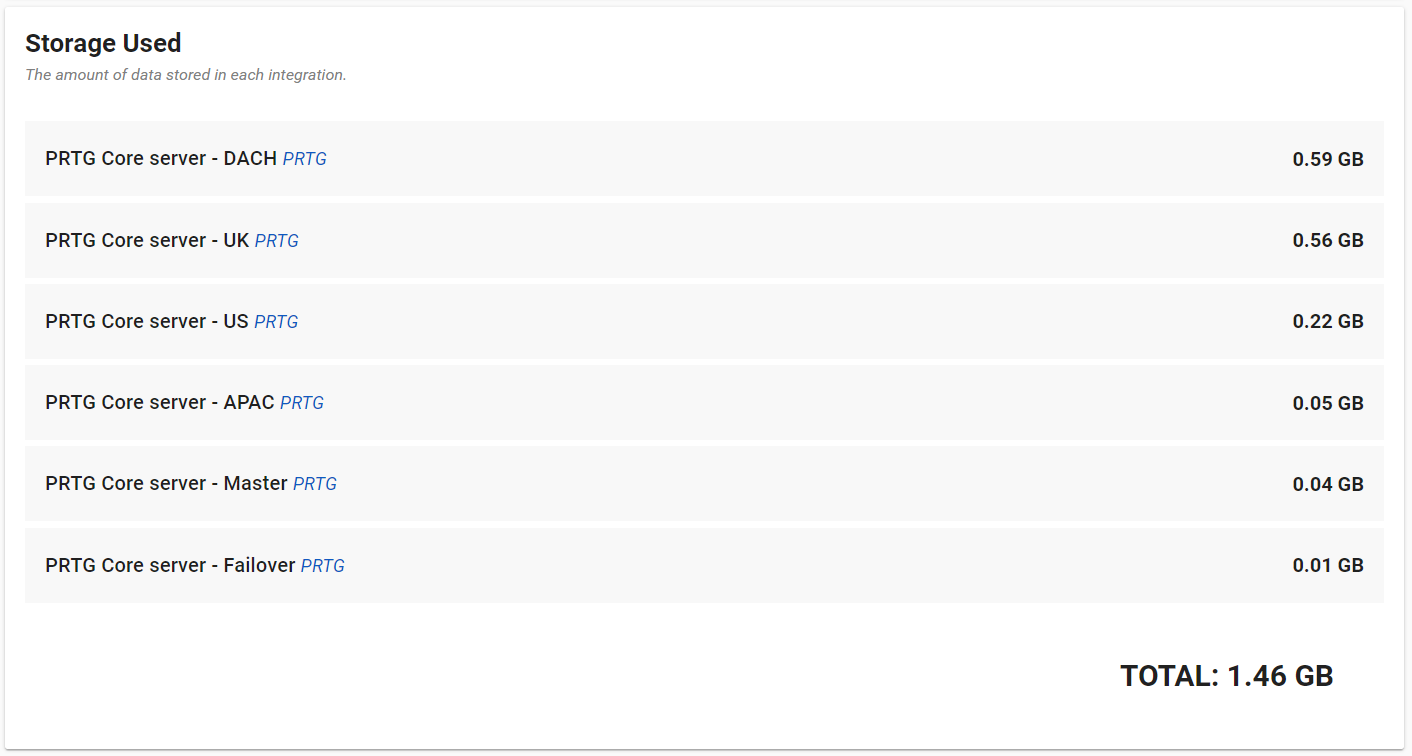
The license you enter in ITOps Board, and the board and services you create in ITOps Board are stored in the Microsoft SQL database. According to the screenshot below, the six PRTG integrations have consumed 1.46 GB of database space in the last 1.5 years.
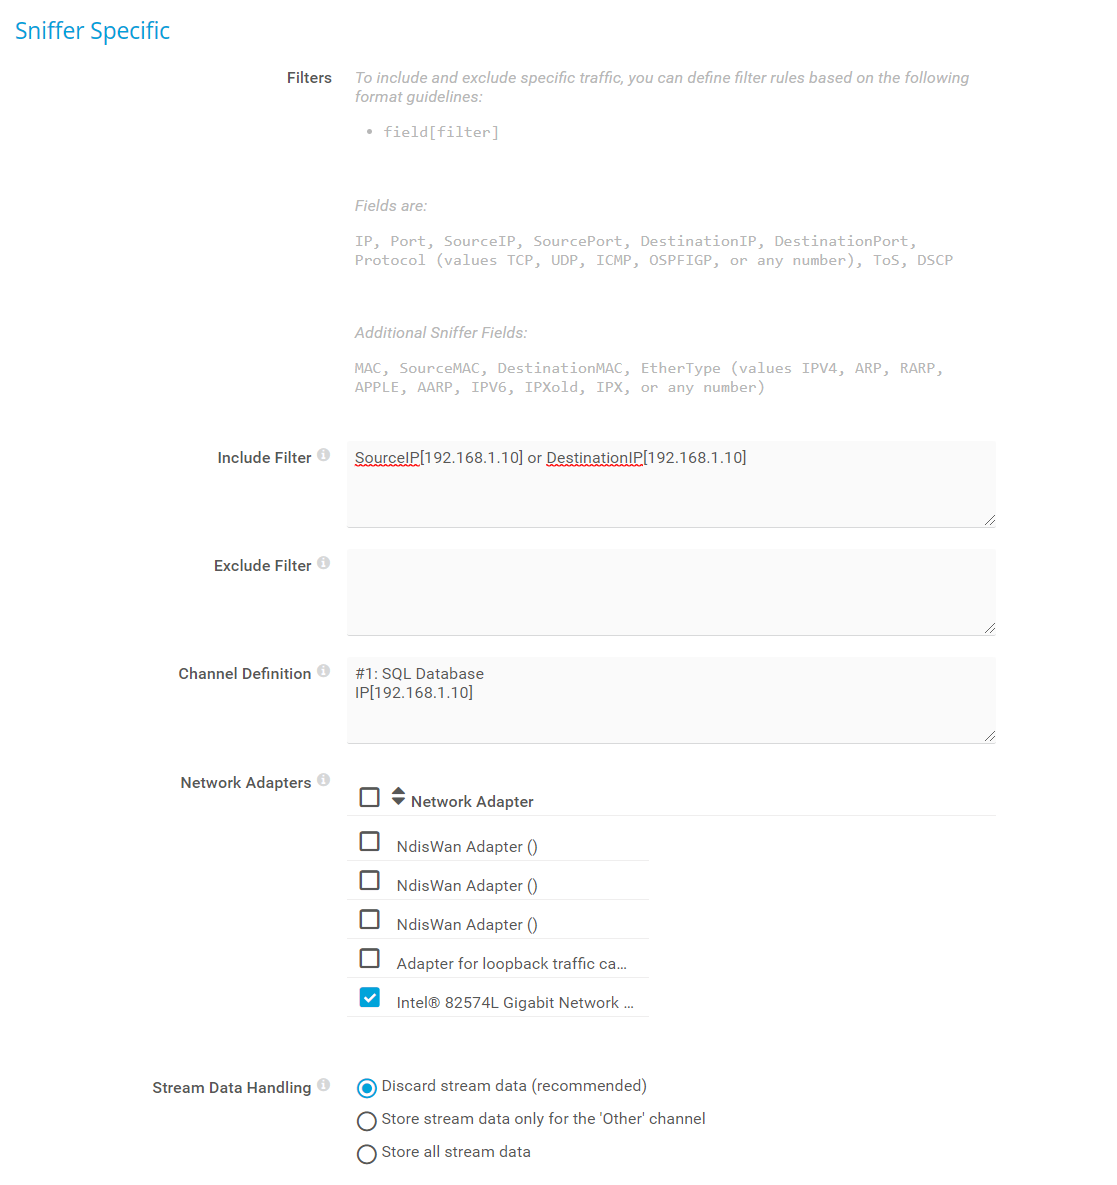
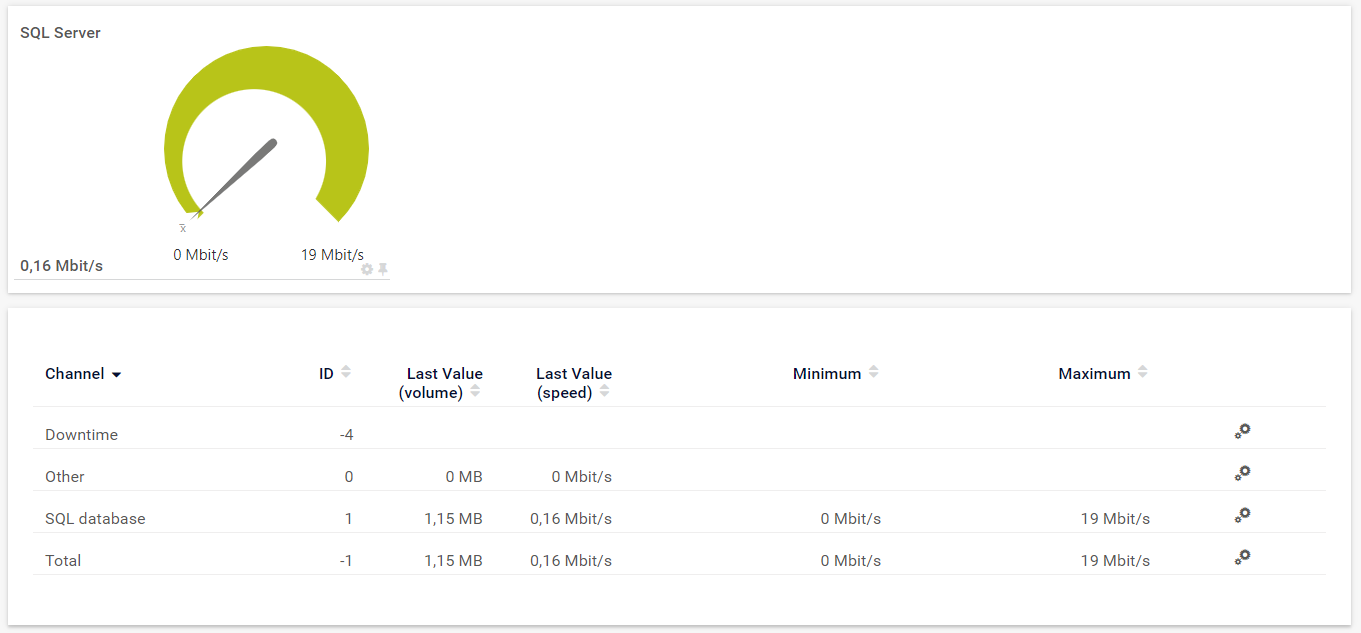
Add the Packet Sniffer (Custom) sensor, choose active network card, and configure filters and channels. So, in my case, I used the filter SourceIP [192.168.1.10] or DestinationIP [192.168.1.10], which points to the IP address of the SQL server.
After some time, you will see bandwidth metrics within your sensor. The last value (speed) shows that the SQL server consumed 0,16 Mbit/s and had a maximum bandwidth of 19 Mbit/s.
Monitor request bytes on Microsoft IIS
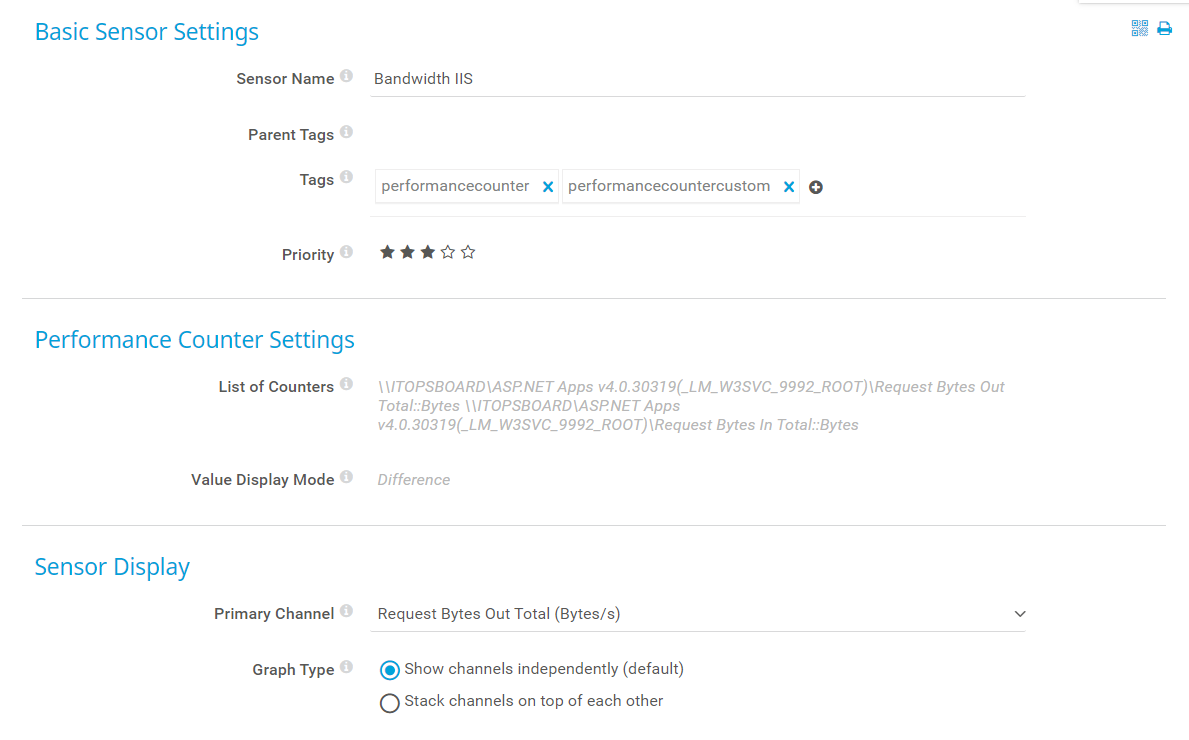
The Microsoft IIS (Microsoft webserver) is used to access the ITOps Board UI. In this case, we will use the PerfCounter Custom sensor to get insight into request bytes per second. Add the following counter.
\\ITOPSBOARD\ASP.NET Apps v4.0.30319(_LM_W3SVC_9992_ROOT)\Request Bytes Out Total::Bytes \\ITOPSBOARD\ASP.NET Apps v4.0.30319(_LM_W3SVC_9992_ROOT)\Request Bytes In Total::Bytes
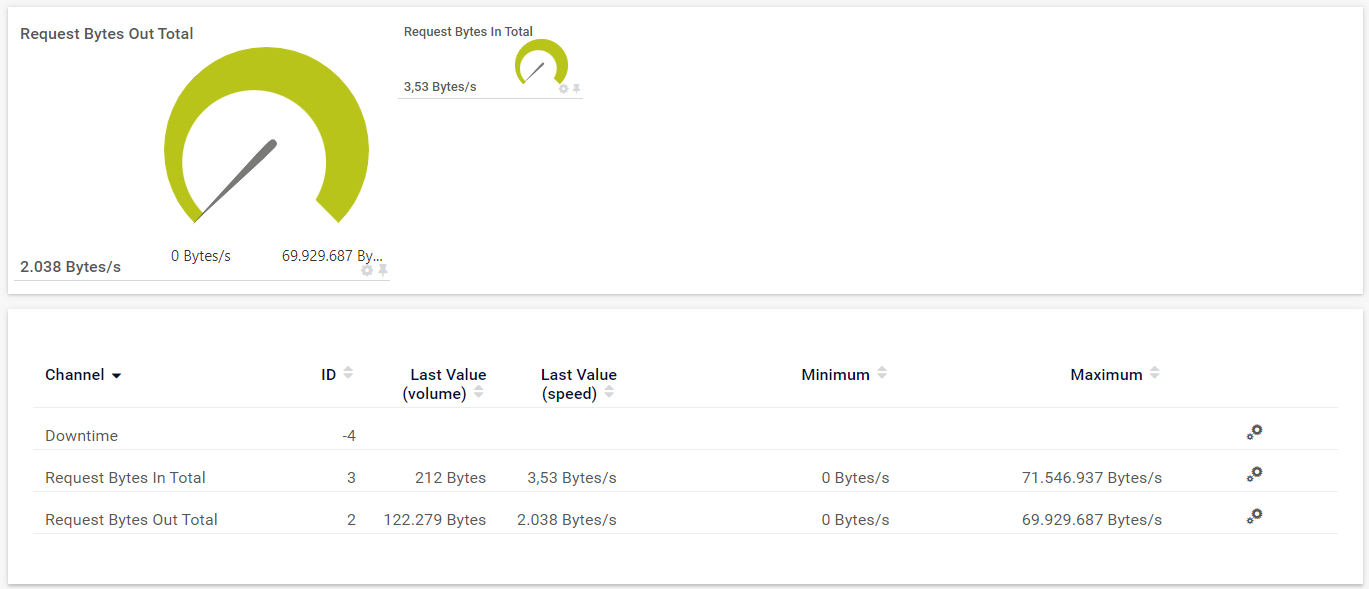
After the first scan, your sensors will show total incoming and outgoing request bytes.
The dashboard
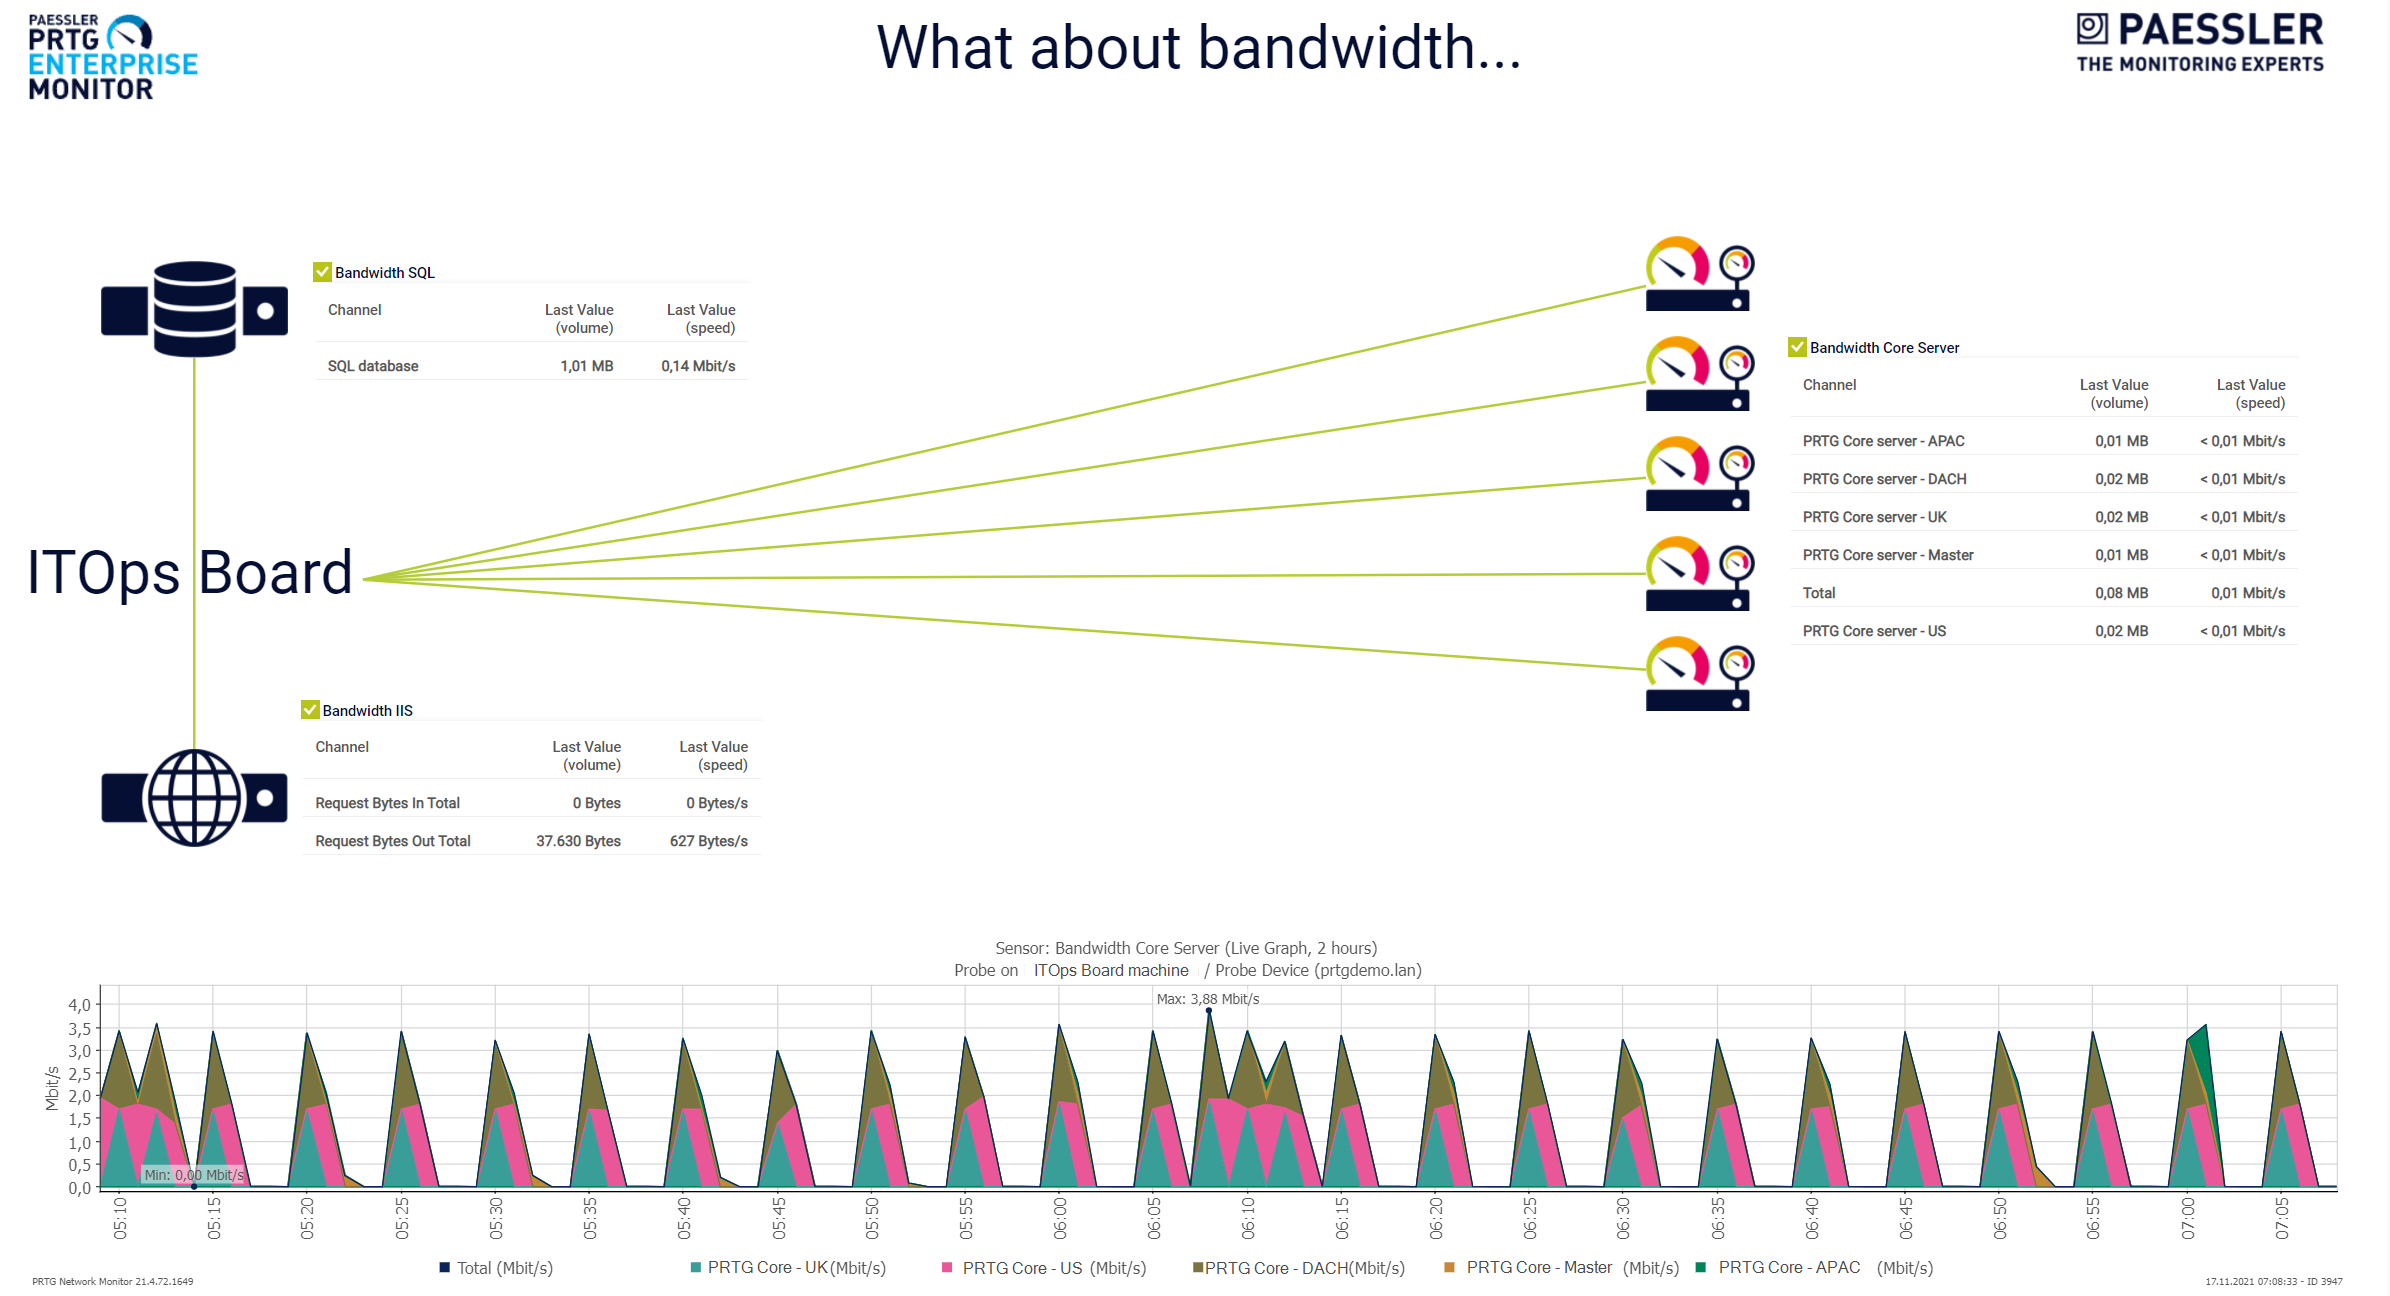
With the PRTG Map Designer, you can create custom web pages as maps or dashboards that represent your network. As a result, you might have something similar to my map that shows the status of bandwidth consumption within the PRTG Enterprise Monitor environment.
I hope you enjoyed this article. If so, please share it with your IT network. Thank you!


