 Published by Sascha Neumeier
Last updated on April 15, 2026
•
3 minute read
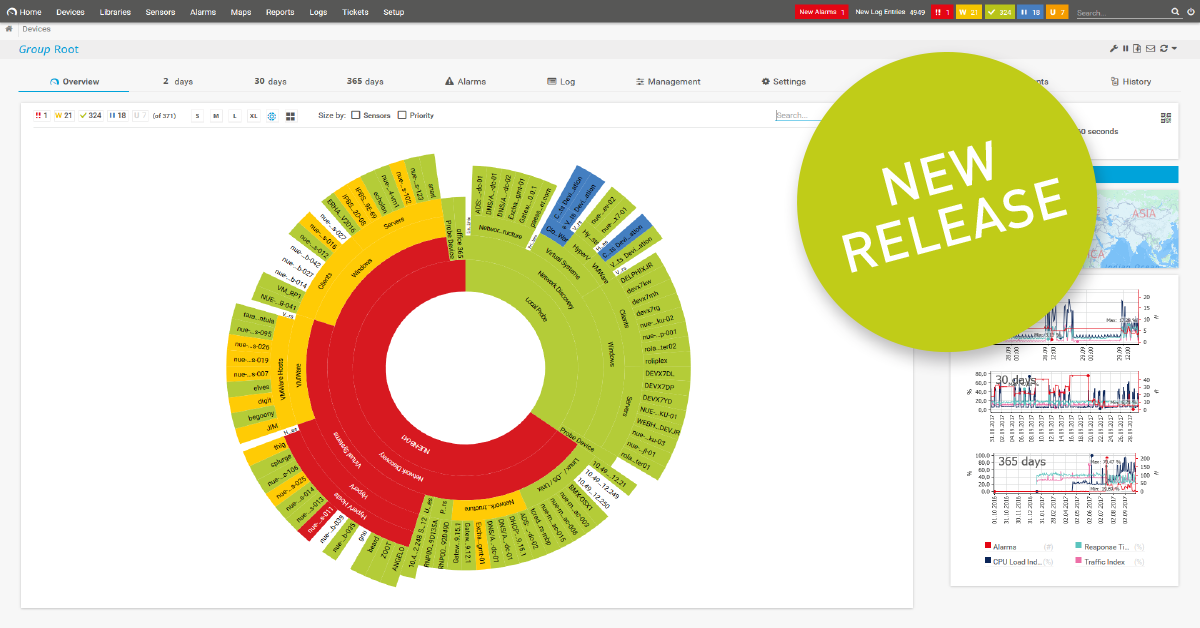
Have you all recovered from our release of last month? In May we introduced the PRTG version 18.2.40, presenting our new Fujitsu sensor. This new SNMP Fujitsu System Health BETA sensor monitors the status of Fujitsu PRIMERGY servers via the iRMC (Integrated Remote Management Controller). With this new sensor type you have an overview of the iRMC status, CPU status, available memory, status of power supplies, the current temperature, the temperature status, and more.
If you missed this, just check out one (or all) of the following articles:
- PRTG Release 18.2.40 Comes with Native Fujitsu Sensor (and a Lot More)!
- Why You Should Manage Your Fujitsu Server with iRMC
- How to Use Our New Native SNMP Fujitsu System Health Sensor in PRTG
This month the current stable release 18.2.41 brings interesting new features and improvements – so let’s have a look at it!
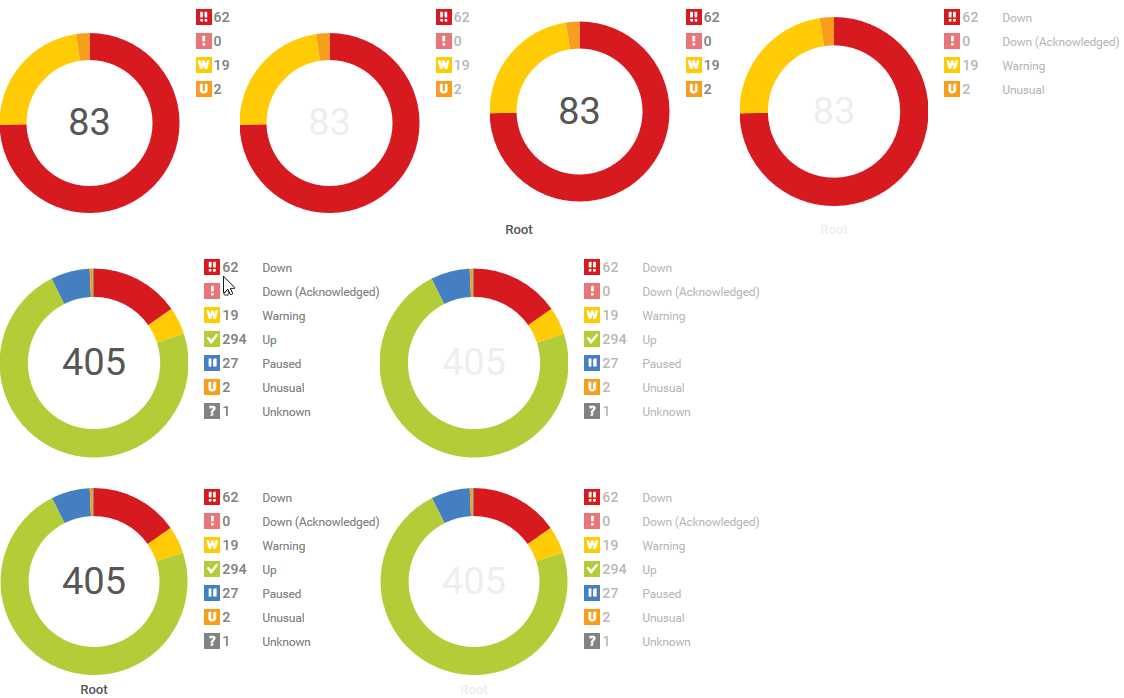
Donut Charts as Map Objects
We added the donut charts from the PRTG welcome page as map objects, so you can now use donut charts with current sensor states on your dashboards! From now on you have 8 additional map objects to choose from - here is an overview of the available objects:
Report and GUI Polish
Besides these pretty colorful circles, we have optimized the status history values in the reports. In the sensor status history section of historic data reports, the values were rounding to units that were too big under certain circumstances, and they were not optimally adding up. Additionally, we cleaned up a few menus in the web interface.
Noteworthy Improvements and Fixes
As with any software, we have classic bug fixing as well - no reason to be silent about it. We improved the sorting of the sensor settings of the HL7 Sensor. The REST Custom Sensor now works reliably even if a proxy server has been defined in the Proxy Settings for HTTP Sensors.
In the context menu of the web interface, the button for manually starting a sensor scan is now called "Scan Now" and no longer "Check Now". In addition, we have adjusted table layouts in some places in the web interface.
If you want to dive even deeper into the technical changes, you can read more about all the details of the latest release at any time in our PRTG Release Notes.

Keep Calm and Use Our Donut Chart
The donut charts as map objects are probably the most visible change this month. We are interested in your use cases with the new donut chart and we are looking forward to your feedback. Where do you use the objects? And what do your dashboards look like? You are welcome to share an anonymized screenshot with the PRTG community – just use the comments section below!


