 Published by Michael Becker
Last updated on July 15, 2026
•
7 minute read
What does the cloud actually cost this month? Ask finance, ask the DevOps lead, ask the admin who provisioned half the instances two years ago – chances are good all three give a different number. That gap is not a rounding error. It is, according to Flexera's 2026 State of the Cloud Report, roughly 29 percent of total cloud spend disappearing into overprovisioned resources, idle compute, and services nobody remembers switching on.
Cloud cost optimization has been the number one stated cloud priority for five years running. And yet cloud waste has barely moved. That mismatch alone says something: throwing more cloud financial management software at the problem does not automatically fix it. Most organizations are not short on cloud cost optimization tools. They are short on cost visibility that connects to what is actually running on the infrastructure.
That is where things get interesting for network and infrastructure admins, because visibility is exactly the layer they already own.
The real cost of not knowing
Cloud pricing models make this messier than it needs to be. Pay-as-you-go and on-demand pricing feel convenient right up until the invoice arrives. Add reserved instances, savings plans, spot instances, volume discounts, and data transfer fees on top, and even a modestly sized AWS or Azure account turns into a puzzle. Multi-cloud setups multiply that puzzle by however many providers are in the mix.
The usual suspects behind cloud waste are boringly consistent across every industry report: over-provisioned resources, compute instances left running at two percent CPU utilization, storage tiers nobody downgraded after the data went cold, and load balancers still pointed at services that were decommissioned months ago. None of that is exotic. It is just invisible, until someone goes looking for it. Poor resource allocation, in other words, is rarely a one-time mistake. It accumulates quietly, one forgotten instance at a time.
Wondering what your own infrastructure is quietly costing you? Start a free PRTG trial and get cost and performance data on one dashboard, no credit card required.

Reserved capacity and rightsizing that admins never see coming
Rightsizing is usually framed as a finance exercise: pull a report, compare it to the bill, adjust. In practice it starts on the infrastructure side. Nobody can right-size resources without first knowing what those resources are actually doing hour to hour. CPU load, memory, storage throughput – this is the same data admins already track through infrastructure monitoring for performance reasons. Cost monitoring just borrows it.
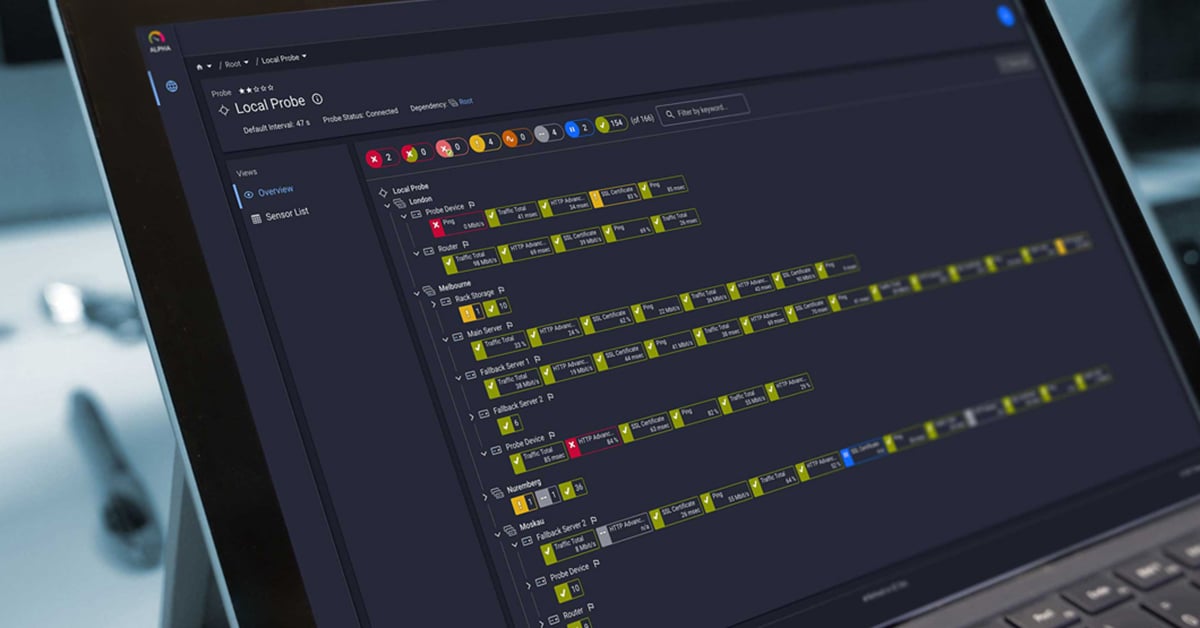
Here is where the tooling question gets honest: PRTG is not a FinOps platform. It does not run automated rightsizing like AWS Compute Optimizer or Azure Advisor, it does not do AI-driven anomaly detection, and it will not negotiate a volume discount on your behalf. What PRTG does is put cost data and performance data on the same dashboard, so that an admin does not have to bounce between AWS Cost Explorer, Azure Cost Management, and a separate performance tool just to answer one question: is this resource earning its keep?
Concretely, PRTG comes with native sensors for exactly this purpose:
- AWS Cost Sensor & AWS Alarm v2 sensor: pulls monthly and yearly cost figures plus forecasted costs directly from the AWS Cost Explorer API, and reads CloudWatch alarms so an admin can see a cost spike and the resource event that likely caused it side by side. That is about as close to anomaly detection as PRTG gets: flagging the correlation, not automating the fix.
- AWS EC2 v2, AWS EBS v2, AWS ELB v2, and AWS RDS v2 sensors: track the utilization data (CPU, storage throughput, load balancer traffic) that actually justifies a rightsizing decision, instead of guessing from the bill alone.
- Microsoft Azure Subscription Cost, Virtual Machine, Storage Account & SQL Database Sensors: show current and previous period costs, budget consumption, and a cost forecast, paired with the same CPU-and-utilization logic on the Azure side.
None of these sensors optimize anything automatically. They report. That reporting is what feeds the next decision, whether that decision gets made by a person or handed off to a dedicated cloud cost optimization tool afterward.
Continuous monitoring beats the quarterly cleanup
Cost anomalies rarely announce themselves. A misconfigured autoscaling group, a test environment nobody shut down, a storage tier that reverted to standard after a migration – these show up as a slow creep in the monthly total, not a dramatic spike. Continuous cost monitoring catches that creep early. A one-time cloud cost audit catches it three months and several thousand dollars later.
This matters even more once cost allocation and chargeback or showback models come into play. If different teams are billed for their own cloud footprint, the underlying resource allocation data needs to be trustworthy and current, not reconstructed from memory during a budget meeting. Availability zones, compute instances, storage tiers – all of it needs a monitoring layer that is already running, not one that gets switched on only when the finance team asks pointed questions.
Total cost of ownership calculations for cloud infrastructure tend to underestimate exactly this operational overhead. Dedicated cloud financial management platforms promise automated savings, sure, but they still need someone watching the underlying infrastructure to make sure the automation is doing the right thing, not scaling down a service that actually needed the extra capacity.
Stop splitting attention between three different cost dashboards. Download the free PRTG trial and bring cost visibility into the same view as your infrastructure monitoring.

Where this leaves the IT admin
Cloud cost optimization will keep growing as a discipline. GPU-heavy AI workloads, growing Kubernetes footprints, and expanding multi-cloud estates practically guarantee it. But the foundation stays the same as it always was: reliable, continuous cloud monitoring into what infrastructure is doing and what it costs to keep it running. FinOps teams can build forecasting models, run anomaly detection, and negotiate reserved instances on top of that foundation. They cannot build it without the data existing somewhere in the first place.
For admins running AWS and Azure infrastructure, that visibility does not require a separate platform bolted onto existing monitoring. It can sit right next to the performance data already being collected, on a dashboard that was probably open in another browser tab this whole time.


 You there!