 Published by Paessler Editorial Team
Last updated on July 15, 2026
•
10 minute read
This practitioner’s guide explains the essential CDN performance metrics to monitor, how to instrument measurement across your CDN, origin, and real users, and how to troubleshoot drops in cache hit ratio, slow TTFB, regional errors, and rising egress costs. You’ll also find practical targets, alerting guidance, and a step-by-step setup with internal links to complementary resources. If you’re new to foundations like PoPs, Anycast, and DNS load balancing, start with CDN Architecture: PoPs, Anycast vs DNS Load Balancing.
- Key metrics: Cache hit ratio, TTFB (broken down into network/connect vs server/origin), error rates, geographic/ISP performance, origin fetch rate/egress, and purge propagation.
- Good practice targets: Cache hit ratio 85–95% overall (95%+ for static assets); TTFB thresholds defined per region and content type; prioritize reducing the 95th percentile in key markets.
- Why it matters: Low cache hit ratio slows delivery and increases egress costs. Poor TTFB degrades user experience and can harm search performance via weaker Core Web Vitals.
- How to measure: Triangulate CDN edge analytics/logs, origin telemetry, and real user monitoring (RUM); segment by region and content type; track connect time percentiles to spot peering/routing issues.
Why CDN performance monitoring matters
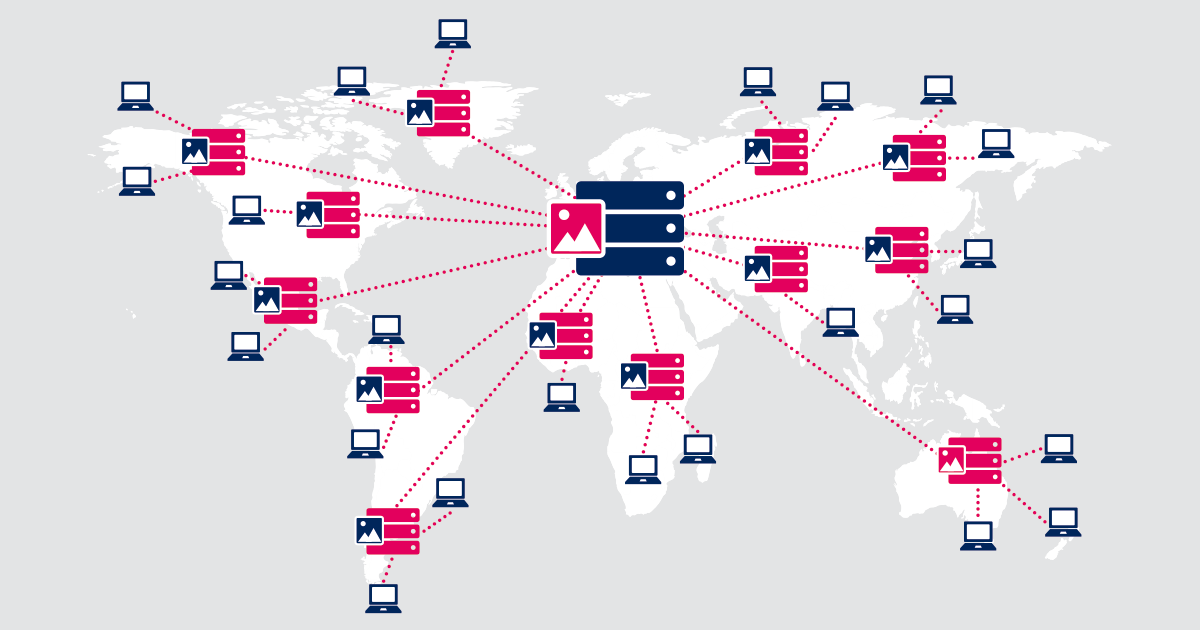
CDNs speed delivery by serving cached content from nearby PoPs and by routing dynamic traffic over fast paths. Monitoring validates that these mechanisms actually work for your regions, ISPs, and content mix. A low cache hit ratio leads to more origin trips, slower pages, and higher egress costs. High Time to First Byte (TTFB) correlates with degraded Core Web Vitals, especially LCP, which impacts user experience and organic performance.
When route changes or congestion create regional anomalies, hop-by-hop path analysis helps you localize the issue. If you need a refresher, see What You Need to Know About Traceroute.

The core CDN metrics to track
1) Cache hit ratio (CHR)
Definition: Percentage of requests served from CDN cache vs fetched from origin (hits ÷ [hits + misses]) × 100.
Why it matters: Low CHR increases origin trips and latency and raises egress costs.
Targets (guidance): 85–95% overall; static assets often reach 95%+; dynamic content may be lower depending on personalization.
Common causes of low CHR: Non-cacheable headers; fragmented cache keys (e.g., unnecessary Vary on cookies/headers/query); short TTLs; no tiered caching/origin shield; aggressive global purges.
2) Time to First Byte (TTFB)
Definition: Time from request start to first byte received; includes connection setup, TLS, CDN processing, and origin response.
Threshold guidance: Define “good,” “needs improvement,” and “poor” ranges per region and content type (for example, aim for median TTFB < 800 ms in priority markets and keep 95th percentile well below 1800 ms).
Why it matters: Poor TTFB correlates strongly with worse LCP distributions across large RUM datasets.
Tip: Break TTFB into connect time (network/peering) and server time (CDN compute/origin) to target fixes precisely.
3) Error rates (4xx/5xx and connect failures)
Definition: Percentage of failed requests by status class and failure mode.
Why it matters: Spikes indicate regional outages, origin overload, misconfiguration, or regulatory blocks; track by region/ISP for localization.
4) Geographic/ISP performance
Definition: TTFB and error rates per country, region, and major access networks (“eyeball” ISPs).
Why it matters: Performance varies by access network, peering, and regional coverage. Monitor 95th percentile TCP connect times to surface network-level issues.
5) Origin fetch rate and egress
Definition: Rate of origin requests (misses) and associated bandwidth costs.
Why it matters: High origin fetch indicates poor caching or purge patterns; tiered caching and origin shielding reduce origin load and latency.
6) Purge propagation time
Definition: Time to invalidate content globally.
Why it matters: Slow or inconsistent purges create regional mismatches; track completion by region and align purge strategies with deployment cadence.
7) Video streaming health (if applicable)
Metrics: Startup delay, rebuffer rate, errors by geography.
Why it matters: Streaming stability is highly sensitive to routing and caching; correlate rebuffer rate with CHR and TTFB by region.
How to measure (instrumentation and data sources)
- CDN edge analytics & logs: Use provider dashboards for CHR, TTFB, error rates, and purge metrics; enable log streaming for granular analysis and custom thresholds.
- Origin telemetry: Collect origin response times and errors to separate origin bottlenecks from CDN/network issues.
- Real User Monitoring (RUM): Measure actual user experience across geographies/ISPs; combine with synthetic checks for controlled baselines.
- Network/connect time: Track 95th percentile TCP connect in key ISPs to detect peering/routing issues.
Recommended thresholds and alerts
- Cache hit ratio: Alert if overall CHR drops below an agreed threshold (e.g., 85%); for static bundles, consider stricter thresholds (e.g., 95%).
- TTFB per region: Alert if median TTFB exceeds target in a priority market (e.g., 800 ms) or if 95th percentile spikes above your upper bound (e.g., 1800 ms); break down by connect vs server time.
- Error rates: Alert on sustained 5xx/connect-failure increases or sudden bursts in any region.
- Origin fetch/egress: Alert if origin requests or egress exceed budget; investigate correlation with CHR dips.
- Purge propagation: Alert if purge completion exceeds SLA per region.
Troubleshooting playbooks
A) Cache hit ratio drops
- Verify
Cache-Control/Expiresheaders for static assets; avoidno-store/no-cachewhere not required. - Audit cache keys: minimize unnecessary Vary on cookies/headers/query that fragment cache.
- Increase TTLs for hot static assets; segment by bundle to keep popular artifacts resident.
- Enable tiered caching/origin shield; confirm topology fits your traffic and reduces origin trips.
- Refine dynamic caching rules (e.g., cache HTML where safe, use surrogate keys) to improve CHR without sacrificing freshness.
B) TTFB is high in specific regions
- Break down TTFB into connect vs server time; high connect points to peering/routing issues.
- Validate PoP selection/anycast routing and proximity for affected users.
- Check origin responsiveness (DB, API); push more logic/caching to the edge where possible.
- Cross-check with RUM to confirm user impact vs synthetic baselines.
C) Error rate spike
- Classify errors (4xx vs 5xx vs connect) and isolate geos/ISPs affected.
- Review recent CDN config changes/purges and roll back if needed.
- Assess origin health and rate limits; ensure origin shielding is active and absorbing spikes.
D) Rising origin fetches & egress costs
- Map misses to asset types; prioritize high-traffic static bundles for caching improvements.
- Implement tiered cache; verify upper-tier selection and topology to reduce origin trips.
- Adopt targeted purges (surrogate keys) instead of global invalidations.
2025 “build vs buy” considerations
- When evaluating or running multi-CDN, A/B split small traffic segments and track CHR, TTFB by region, error rates by geography, purge response times, video rebuffering, and downstream KPIs (conversion, retention).
- Favor providers exposing TTFB subcomponents and robust RUM/synthetic tooling to localize bottlenecks faster.
- Use tiered caching/origin shielding and programmable purge (surrogate keys) to raise CHR, reduce origin dependence, and contain costs.
Practical monitoring setup (step-by-step)
1) Instrumentation
- Enable CDN analytics and log streaming for CHR, TTFB, errors, and purge metrics.
- Collect origin response timing and error telemetry for comparison.
- Deploy RUM across key pages; add synthetic tests for controlled benchmarking.
2) Dashboards & segmentation
- Segment by region/country/ISP and by content type (static vs dynamic, video vs page HTML).
- Visualize TTFB components and 95th percentile connect times to separate network vs origin issues.
3) Alerts
- Use the threshold guidance above; add “burst” alerts for sudden spikes.
- Alert on purge propagation anomalies by region.
4) Optimization loop
- Iterate cache keys/TTLs; deploy tiered caching and origin shield; refine purge strategy.
- Re-test with RUM/synthetic; track Core Web Vitals and business KPIs for impact.
Reference table: metrics, measurement, and targets
| Metric | What it measures | How to measure | Practical target (guidance) |
|---|---|---|---|
| Cache hit ratio (CHR) | % served from cache vs origin | CDN edge analytics/logs | 85–95% overall; 95%+ static; dynamic varies by personalization |
| TTFB | Time until first byte | RUM, synthetic; break down connect vs server | Optimize medians by region; minimize 95th percentile spikes |
| Error rate | 4xx/5xx/connect failures | Edge logs by region/ISP | Investigate sustained increases and spikes |
| Connect time | Network handshake latency | 95th pct TCP connect per ISP | Use to identify peering/routing issues |
| Origin fetch/egress | Misses and bandwidth from origin | Origin logs + CDN analytics | Reduce via tiered cache/origin shield |
| Purge propagation | Time to invalidate globally | CDN purge metrics | Track per-region completion times |
| Video rebuffer rate | Streaming stability | Player analytics + CDN | Minimize; correlate with CHR/TTFB |
Monitor and alert with PRTG
To stay ahead of route changes, latency spikes, and availability issues, monitor the end-to-end delivery path alongside your CDN metrics. Correlate regional latency and error shifts with routing changes, and alert before users feel the impact.
- Detect path changes, latency anomalies, and availability issues for critical endpoints; correlate with CDN and origin health.
- Visualize trends and receive real-time alerts when thresholds are breached.

FAQs
What’s a “good” cache hit ratio?
Most applications target 85–95% overall; static assets often reach 95%+, while dynamic content may be lower depending on personalization and API dependencies.
Does TTFB really impact UX and SEO?
Yes. Poor TTFB correlates with worse LCP distributions, degrading user experience and potentially impacting organic performance.
Why separate TTFB into subparts?
Breaking down connection time vs server time helps determine whether to focus on network peering/routing or origin/application optimization.
How do I reduce origin load and egress costs?
Use tiered caching and origin shielding to reduce origin trips, and adopt targeted purges (surrogate keys) instead of global invalidations to improve cache hit ratio and contain egress.


