 Published by Shaun Behrens
Last updated on September 02, 2025
•
10 minute read
Bonnie and Clyde. Salt and pepper. Peanut butter and jelly.
Some things fit so well together that it is almost impossible to separate them when talking or thinking about them. And so it is in the internet world with ping and traceroute. Whether you are a network n00b or a veteran administrator, ping and traceroute are probably your first two ports of call when troubleshooting network and internet connectivity or latency issues. Since we covered ping in a previous post, it makes sense that we now take a look at its slightly more capable cousin.
While ping can tell you if there is a problem, traceroute can help point to where the problem is. And, like ping, the beauty of traceroute lies in its simplicity: it's a tool that any user with access to a command prompt can run. Yet, despite this ease of use, there is a fairly good chance you will misinterpret its results if you do not know how it works.
In this post we'll look at how traceroute works and how to do a traceroute. In a future post I will give some tips for interpreting the results.
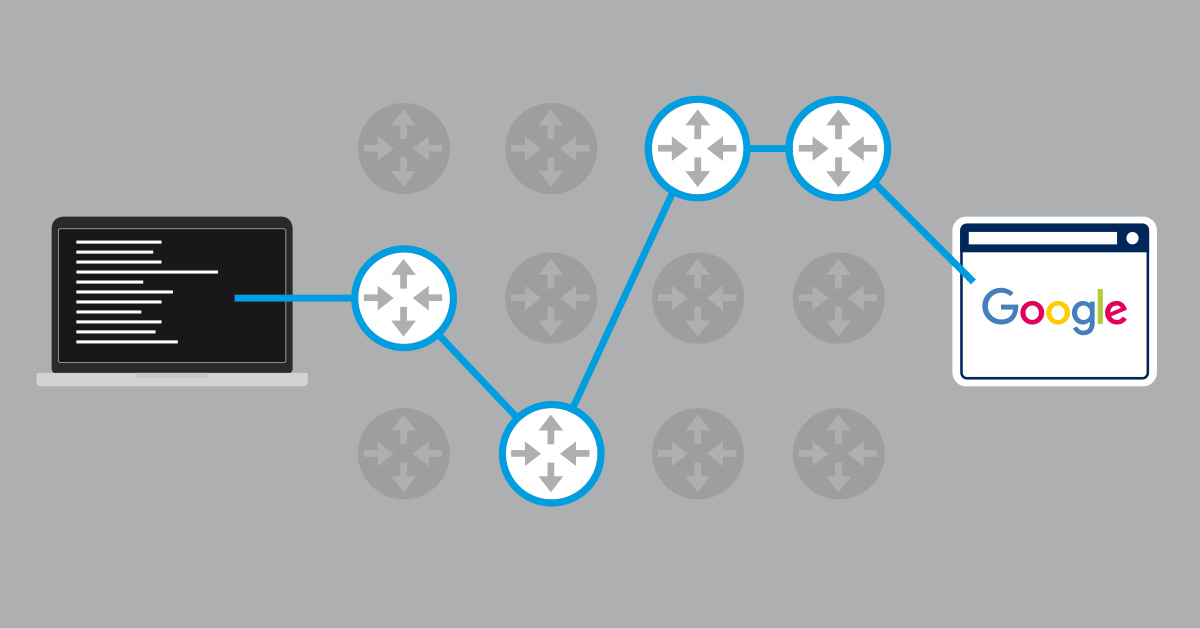
How traceroute works: Mapping network paths
Most platforms offer traceroute as a tool, such as TRACERT on Windows, or TRACEROUTE on Linux and Mac. These tools all essentially do the same thing: map the route that data takes from a point in a network (e.g. your router) to a specific IP server. To get between these two points, data must travel - or "hop" - through a series of devices, such as routers or switches, and hosts. For each hop on the way to the destination device, traceroute provides the data's Round-Trip Time (RTT) and, when possible, the name and IP address of the device.
How does it do this? Here it gets a bit trickier to explain succinctly, so stay with me!
Understanding TTL in traceroute
Traceroute makes use of a network mechanism called TTL, or "Time to Live". The purpose of TTL is to limit how long data will "live" in an IP network. Each packet of data that is sent out is assigned a TTL value - for example, "30". When a data packet reaches a hop (such as a router) on the way to the destination device, the TTL value is decreased by 1. So, for example, once our data packet with a TTL of "30" has passed through five devices (or hops), it will have a TTL of "25". In other words, it can only make 25 more hops before it runs out of time to live.
If a data packet's TTL reaches "0", the data is not routed further, but is dropped. This way, if there is a problem with routing in the network, the data packet will not be passed around indefinitely. At the point a device drops a packet, it sends an ICMP message back to the source device to let it know the packet has been killed.
Still with me? Hang on just a little longer!
Traceroute in action: Probing network hops
Traceroute makes sure that each hop on the way to a destination device drops a packet, and sends back an ICMP error message. Why? Because then it can measure the duration of time between when the data is sent out, and when the ICMP message is received back for each hop. Now you have the RTT, or "Round-Trip Time", for each hop.
It does this by sending multiple waves of data packets out, increasing the TTL for the packets each time.
This diagram depicts how this works in a Windows environment (click to enlarge):
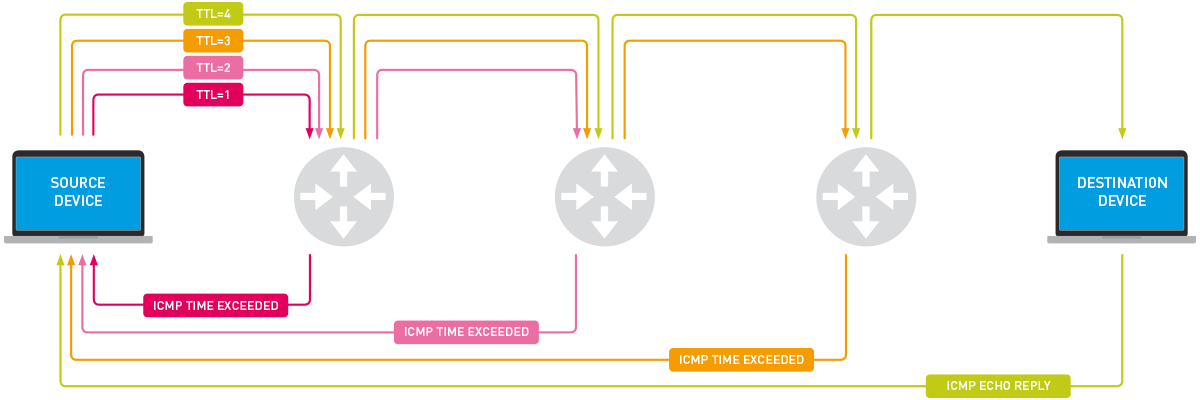
Traceroute example: Step-by-step analysis
I'll use an example to demonstrate:
You run a traceroute to a destination device and specify a maximum of 30 hops. Traceroute then does the following:
- It sends data packets with a TTL of "1" to the destination server. The first network device the data passes through reduces the TTL to "0", and sends back a message that the packets were dropped. Taking into account when we sent the data and when we receive the message back, we now have the RTT for hop #1.
- It sends data packets to the destination server, this time with a TTL of "2". As the packets pass through the first hop, their TTL is reduced to "1" and they are passed on to the next device. When they get to the second hop, the router reduces the TTL to "0", and sends back a message again. We now have the RTT for hop #2.
The above steps are repeated, each time increasing the TTL so the data packets get to the next hop, until the data packets either reach the destination device, or the specified maximum of 30 hops is reached. In the end, you have the number of hops to the destination server, how long the round-trip for each hop took, and, in some cases, the name and IP addresses of the devices at each hop.
For the record, the protocol used for the probes differs depending on the environment: Windows uses ICMP Echo Requests, and UNIX-like environments use UDP packets. The response is sent back using ICMP, regardless of environment.
If you're still here: thank you. There were points during that explanation when even I thought of shutting down and going home. But there was a reason for going through all of that. Knowing what happens in the background means we can start making sense of the numbers.
Reading traceroute results: What the data means
Although the results of a traceroute look slightly different depending on the tool you are using, the core information is the same. Here, as an example, are the results of TRACERT, the Windows traceroute tool:
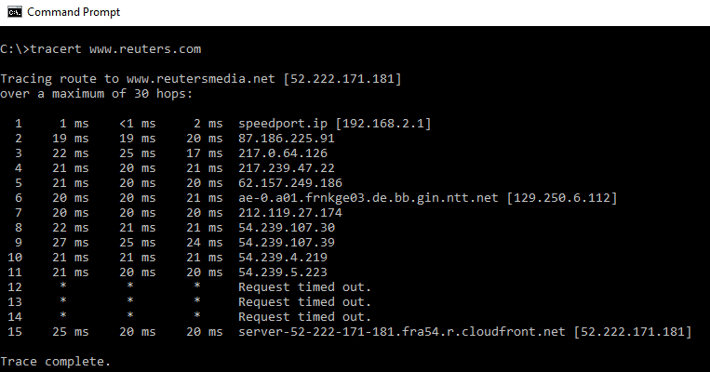
You can see the exact path of your request and number of hops (far left column) from the source device (my pc) to the destination device. For each hop, there are three RTT values (the default of TRACERT is to send 3 data packets to test each hop). Finally, on the right you can see additional information that is available for each device.
You can quickly tell that there does not seem to be a problem with the RTT values in the above example - once the data leaves my local network, they remain constant at between 20 and 25 milliseconds for each hop.
By the way, the hops that return asterisks and a "Request timed out" message (hops 12, 13, and 14) might seem like cause for alarm, but this is not necessarily the case: as long as the traceroute completes correctly (as it did in this case), then the destination device was reached. The asterisks simply indicate that some devices along the way were not configured to provide a reply.
Experts can also use remote traceroute tools like NetPath for a better network management in distributed networks.
Interpreting traceroute data: Common challenges
If the traceroute times out on a specific hop and does not recover, then you know exactly where the network problem is. The bad news? This is rarely the case.
In most situations you will be faced with a set of RTT values that you need to interpret to find the problem. To figure out what could be going on behind the scenes, you not only need to know how traceroute works (which I've tried to cover here), but also which factors influence the results.
We'll look at how to accurately interpret a traceroute in a future post. In the meantime, you can always start your troubleshooting with a good old ping: Get your quick fix with our tool that lets you ping a server from multiple geographic locations.

Automating traceroute with PRTG Network Monitor
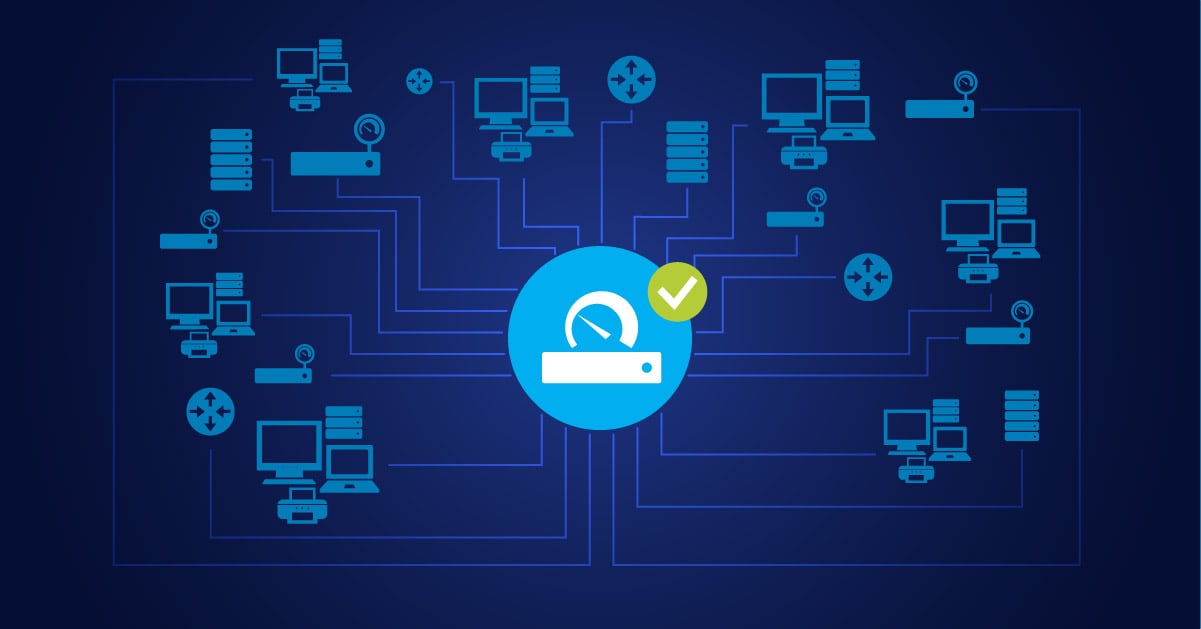
While manual traceroute commands are useful for on-demand troubleshooting, network administrators need continuous visibility into network paths. This is where PRTG Network Monitor transforms traceroute from an occasional troubleshooting tool into a proactive monitoring powerhouse.
PRTG's Traceroute Hop Count sensor continuously monitors the number of hops between your network devices and automatically alerts you when routes change. This proactive approach means you'll know about potential routing issues before they impact your users.
Key benefits of automated traceroute monitoring with PRTG include:
- Real-time route monitoring: Get immediate alerts when network paths change
- Historical data analysis: Compare current routes with past performance
- Visual route mapping: See your network paths in clear dashboards
- Multi-location monitoring: Monitor routes from different network segments
- Integrated alerting: Receive notifications via email, SMS, or push notifications when issues occur
PRTG's Traceroute Hop Count sensor: Key features
PRTG's Traceroute Hop Count sensor offers several advantages over manual traceroute commands:
- Continuous monitoring: The sensor regularly checks routes to critical destinations
- Change detection: Alerts you when the number of hops changes, indicating routing modifications
- Customizable thresholds: Define what constitutes a warning or critical state based on hop counts
- Historical data: Maintain records of route changes over time for trend analysis
- Integration with other sensors: Correlate route changes with bandwidth, latency, or packet loss issues
- Enhanced with Multi-Platform Probe: PRTG's latest architecture improvements provide better performance and reliability for traceroute monitoring
- Visualization options: Display route data in custom dashboards and maps

With PRTG's 2025 enhancements, the Traceroute Hop Count sensor now benefits from improved performance, reduced resource consumption, and better integration with PRTG's next-generation database for faster query times and report generation.
Getting started with traceroute monitoring in PRTG
Setting up traceroute monitoring in PRTG is straightforward:
- Install PRTG: Download and install PRTG Network Monitor (free for 30 days)
- Add devices: Add the devices you want to monitor to PRTG
- Add Traceroute Hop Count sensors: For each critical device, add a Traceroute Hop Count sensor
- Configure alerts: Set up notifications for when routes change
- Create dashboards: Build custom views to visualize your network paths
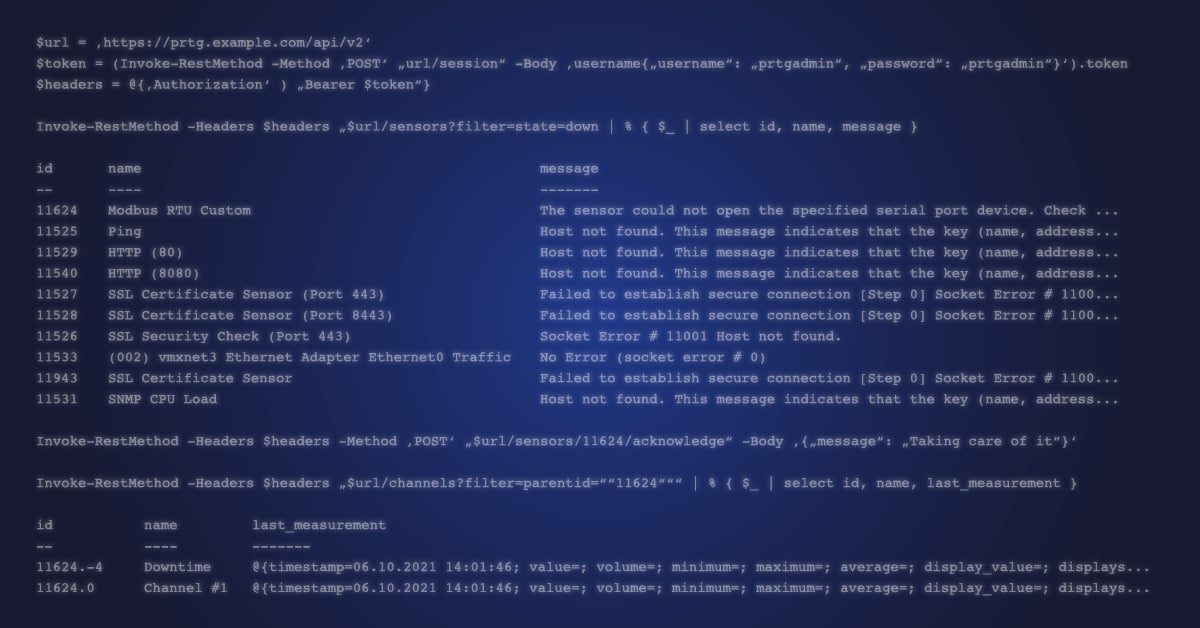
For advanced traceroute monitoring, PRTG also offers a PowerShell script that shows the complete route in the sensor status message, giving you detailed visibility into each hop along the path.
Stop running manual traceroute commands and let PRTG do the work for you. Monitor your network paths 24/7 and get alerted when anything changes. Try PRTG free for 30 days and experience the difference automated traceroute monitoring makes.