 Published by Simon Bell
Last updated on January 23, 2024
•
9 minute read
Syslog – One log to rule them all.
Calling all Sysadmins - I hope you have December 3rd marked down in your diaries this year? On that day, one of the most vital, but undervalued utilities in the admin’s toolkit turns 18. The first draft of the Syslog protocol was published by the IETF on that date, in 2003.

It actually took almost six more years for the details to be worked out, and in March 2009, RFC5424 was finally published. Actually, the history of Syslog predates the RFC publication by several decades - Eric Allman developed the idea of a centralised logging system as part of his work on Sendmail in the 1980’s. But it’s the RFC5424 version (and its companion RFC5426 which defines how to send Syslog messages over UDP), with which we are most familiar. For those that want more details, we’ve put together this useful guide on what Syslog is and how it works.
In this article, we’ll be taking a look at how Syslog monitoring is implemented natively in Paessler PRTG and how that can be further enhanced through a Custom Sensor integration with a rather cool freeware utility called Fastvue Syslog Server.
Syslog in PRTG
PRTG’s Syslog Receiver Sensor was first introduced in version 7, over 10 years ago. It includes four channels:
- Total Messages / Sec
- Dropped Messages / Sec
- Error Messages Received / Sec
- Warning Messages Received / Sec
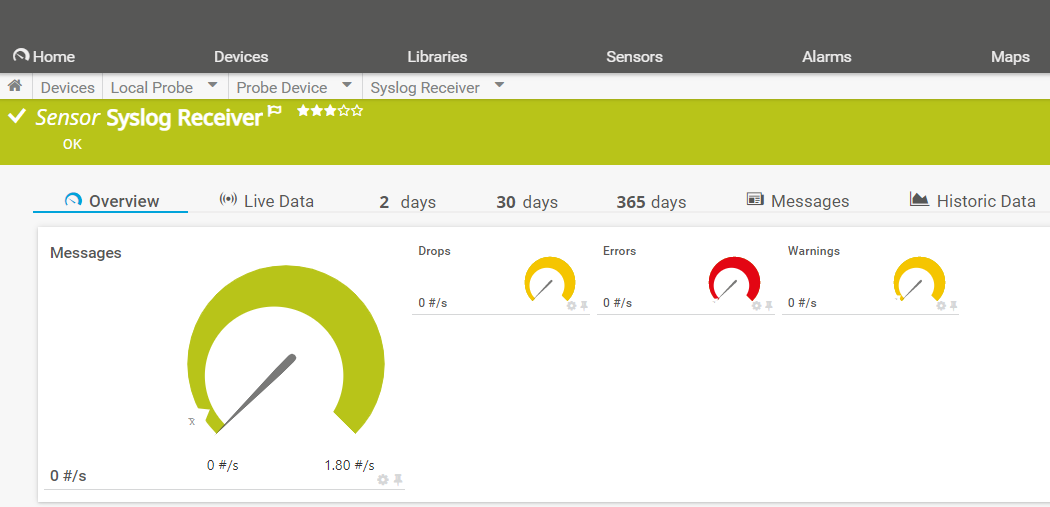
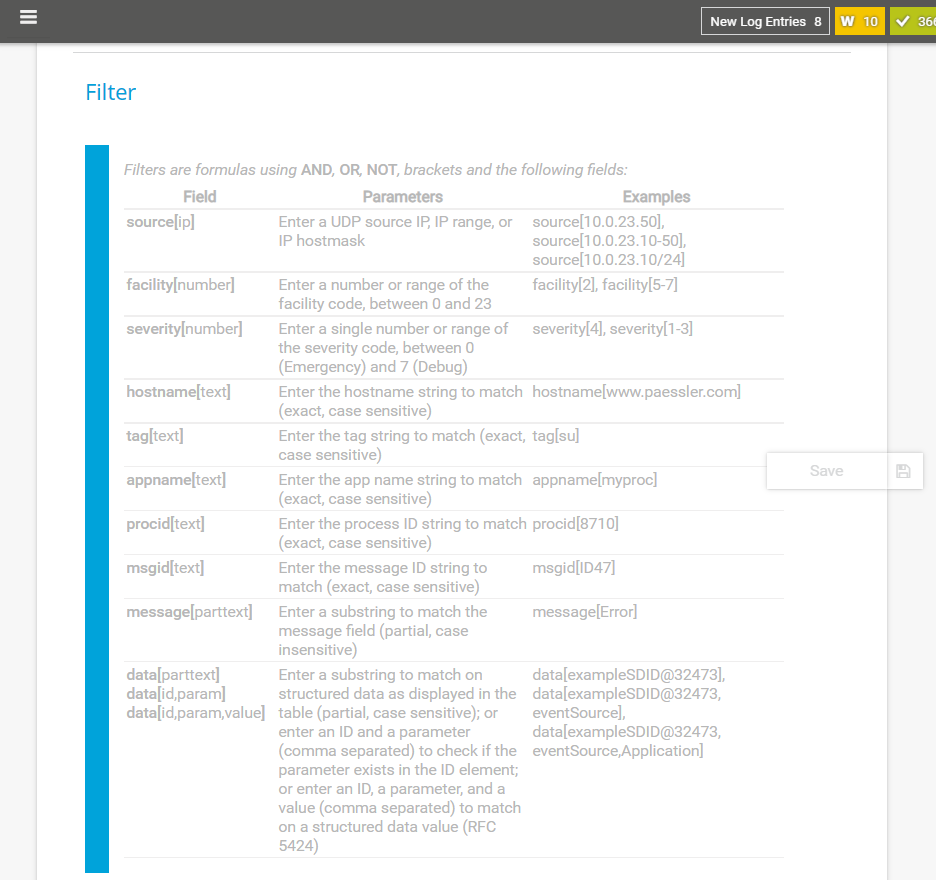
Administrators can make use of a powerful filter set to control which messages are captured by the defined channels.
Limits (thresholds) can then be set on those channels, which will trigger alerts should the limits be exceeded.
😏 Unfortunately, because PRTG is designed to collect “near real-time” status information, by polling the devices every few seconds, it doesn’t maintain “state persistence” between polling cycles. For example, if a device poll detects 20 “error” messages, this will be indicated in the error channel and any matching notifications will be triggered. However, on the next poll cycle, assuming no new errors have been logged, the sensor status and error count will revert to zero. This is OK for informing the admin when problems arise, but it’s not so helpful for tracking Syslog activity over time.
😃 Fortunately, there’s a rather neat solution. An Australian company called Fastvue has developed its own Syslog Server. I know what you’re thinking – what makes it so cool? After all, the internet is awash with Syslog Servers. Two things: Firstly, it's freeware, which is always nice. But most importantly for PRTG, it includes a fully documented REST API, meaning we can create custom sensors in PRTG to retrieve detailed Syslog stats from the server.

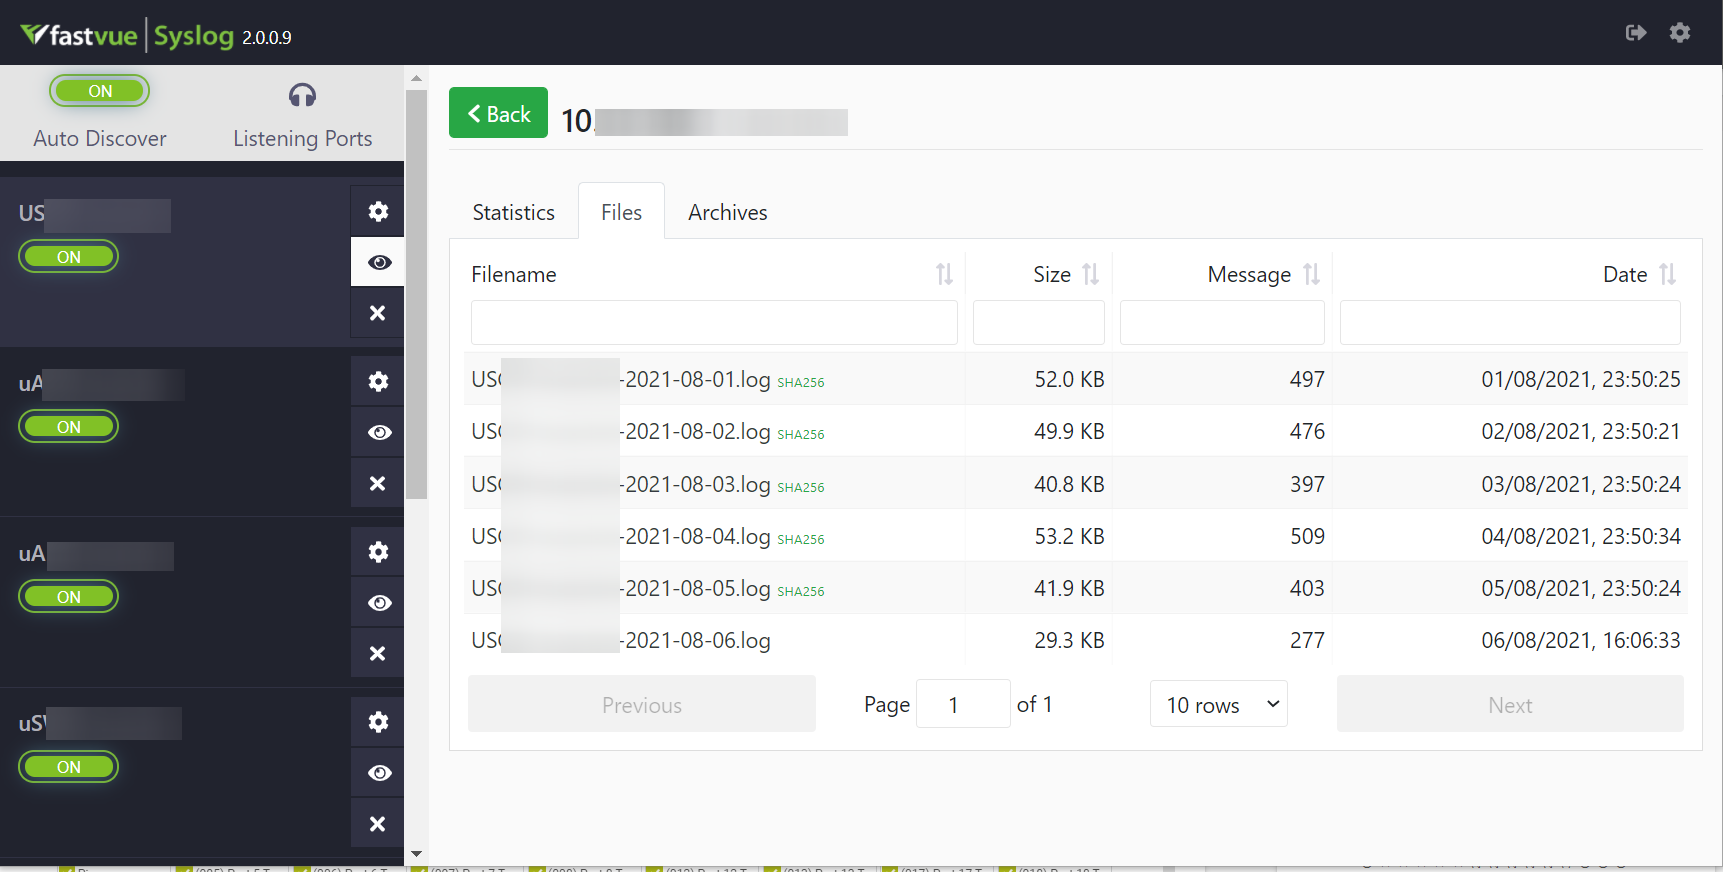
The Fastvue server runs as a Windows service, which defaults to listening on port 514, but this can be changed if necessary. And it features a web-based admin GUI:
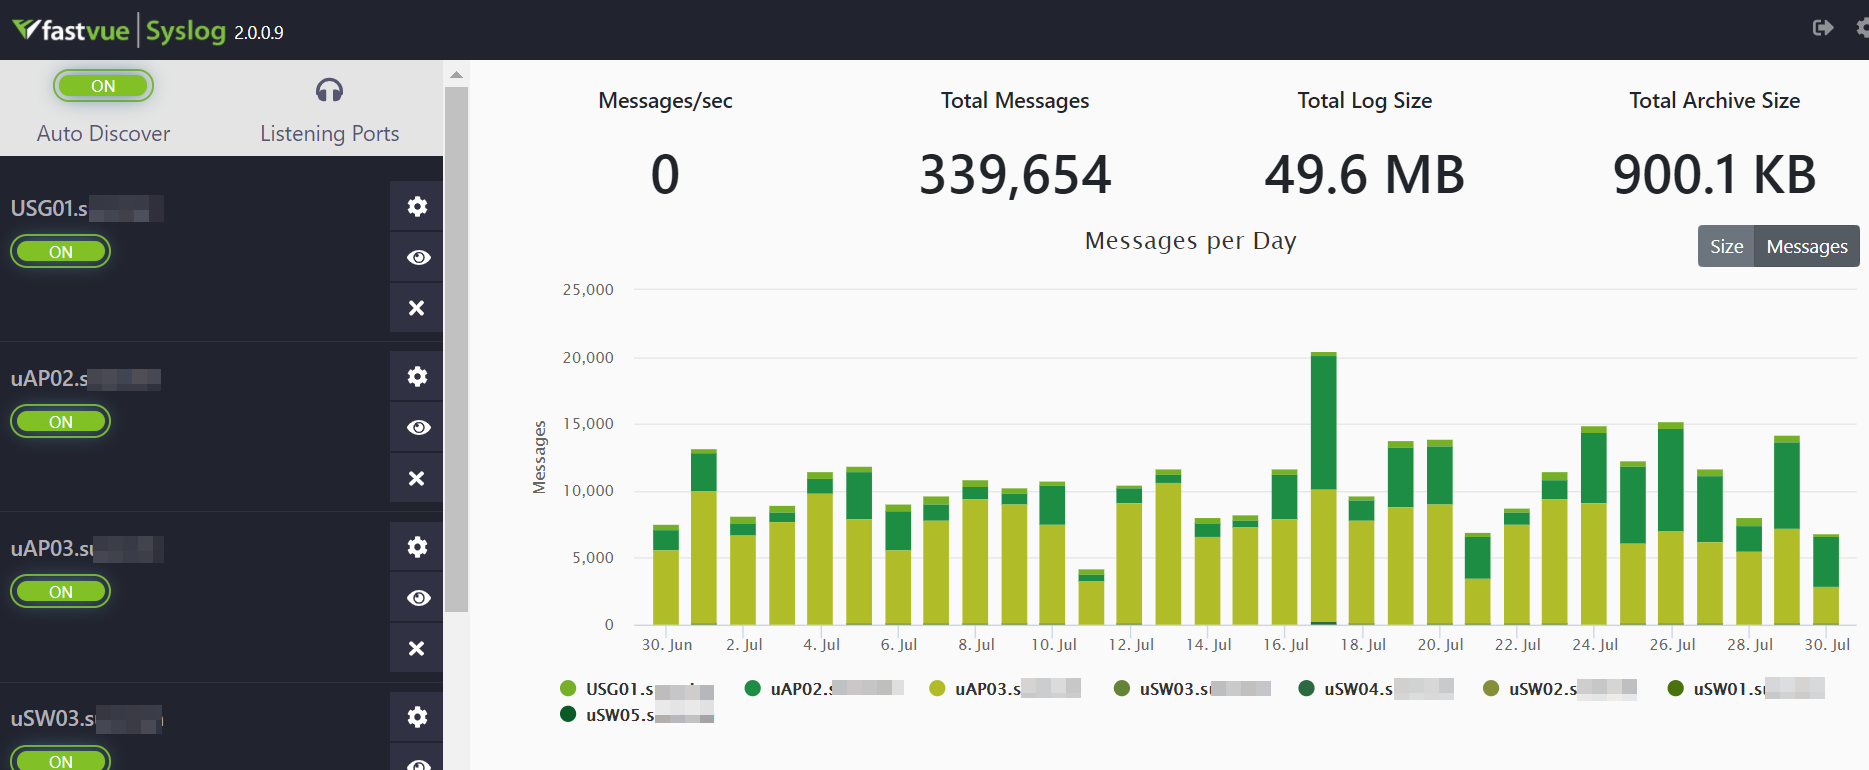
The default view shows overview statistics for the whole system:
- Messages Received /sec
- Total Messages Received
- Log File Size
- Archive File Size
The bar graph shows the total message count, or file size, per day. The system provides an option to automatically archive daily log files after a set number of days. The administrator can define the archive location and the archiving schedule. Both live and archive log files have an SHA256 hash value calculated when the file is closed. This makes it easy to verify the integrity of individual log files.
The menu on the left enables stats to be displayed for each configured log source (device).
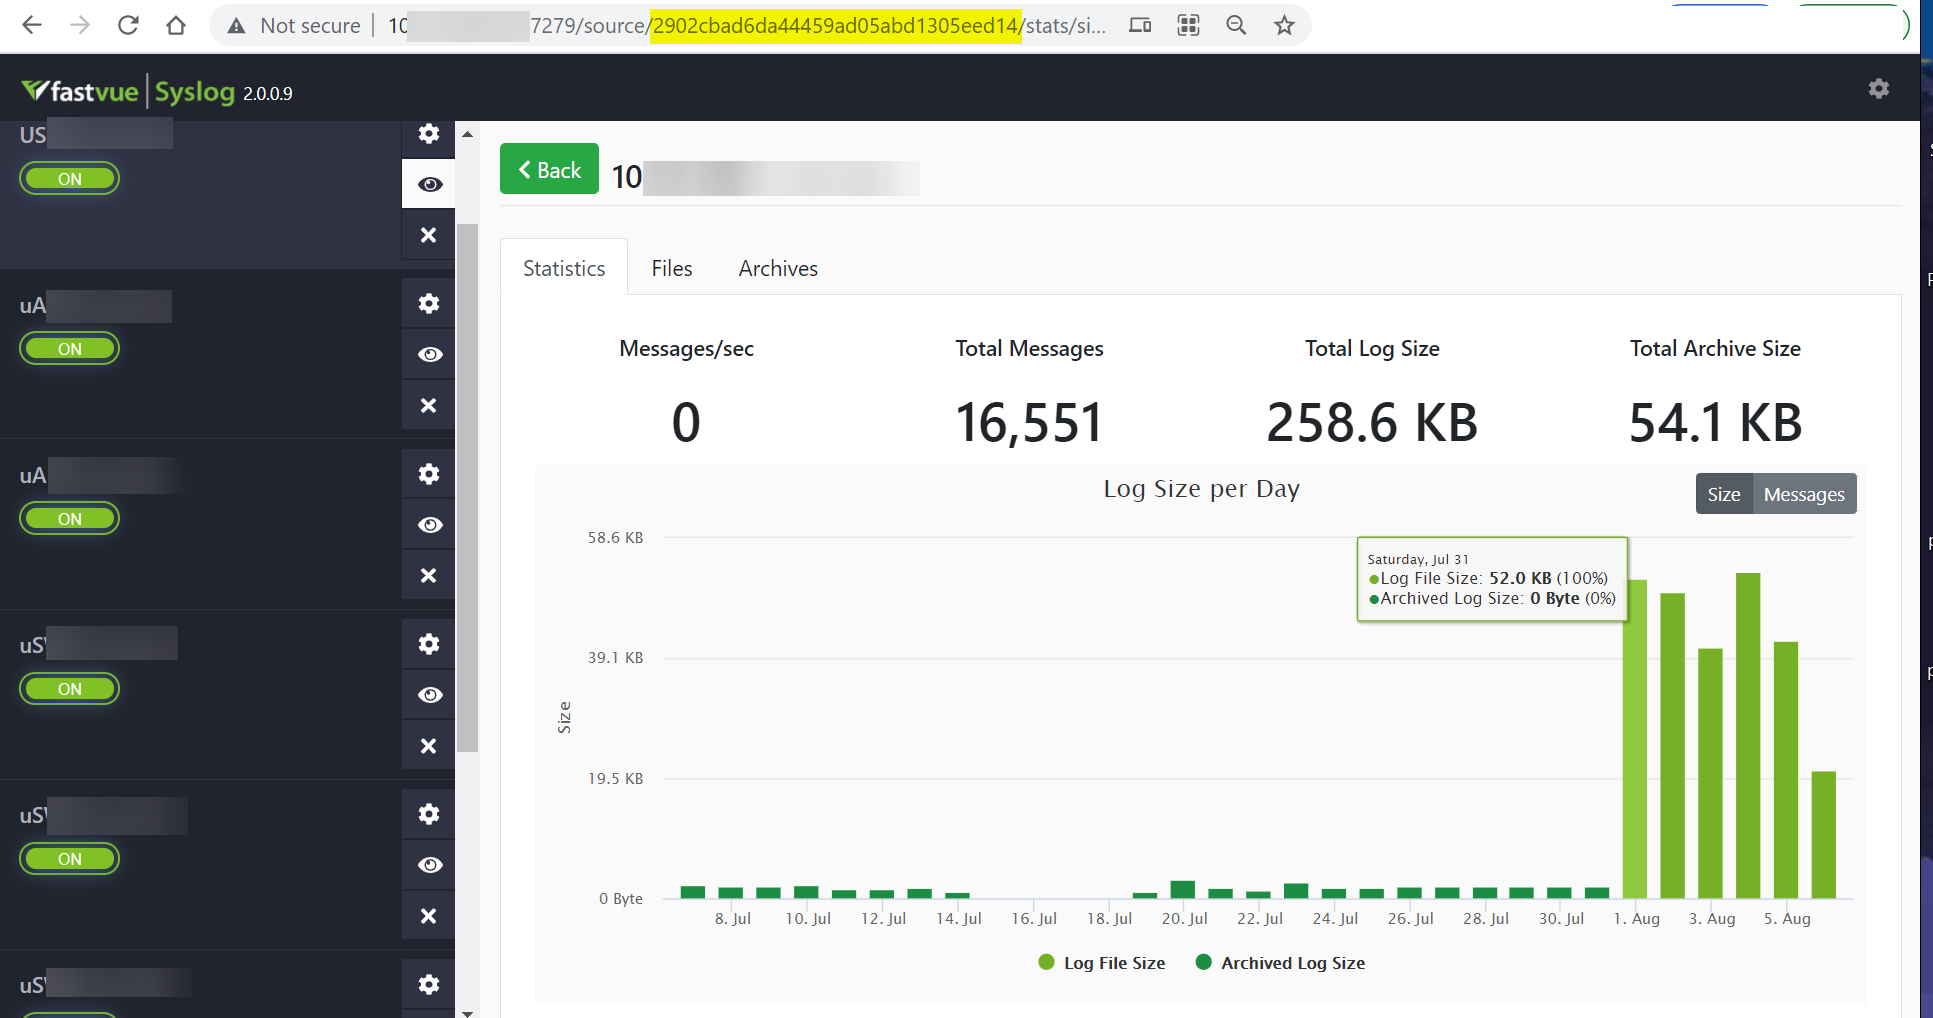
So far, so Syslog. Where things get interesting though, is the built in REST API, as this provides a way for PRTG to access the stats collected by Fastvue. Every defined Syslog source is assigned its own unique ID number, formatted as a hexadecimal string – highlighted in the address bar above and these can be used to retrieve information about specific devices. More on this, later.
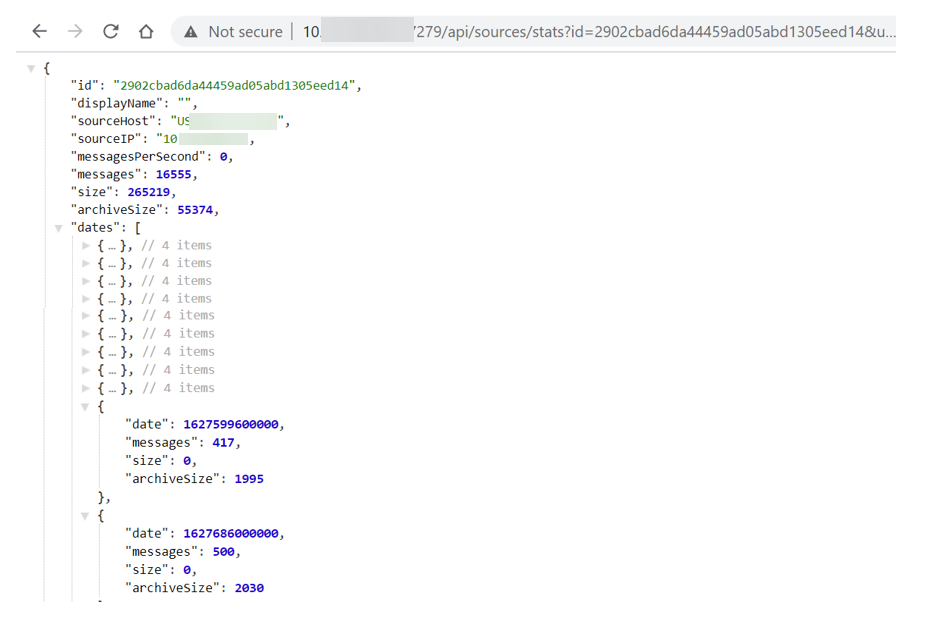
Full documentation for the API can be found here. It can be explored using tools like Postman and like all REST APIs, queries can also be executed simply by using the appropriate URL.
Fastvue & PRTG
Because Fastvue is continuously collecting log information, a new entry is added to every device’s datastore, every day. This means we can’t use PRTG’s Custom REST Sensor to collect data from Fastvue, because the sensor doesn’t allow complex API queries to be constructed. Instead, we need to use a script-based sensor. For the example here, we’ve created a Python Script Advanced Sensor, which can be found in our Gitlab repository.
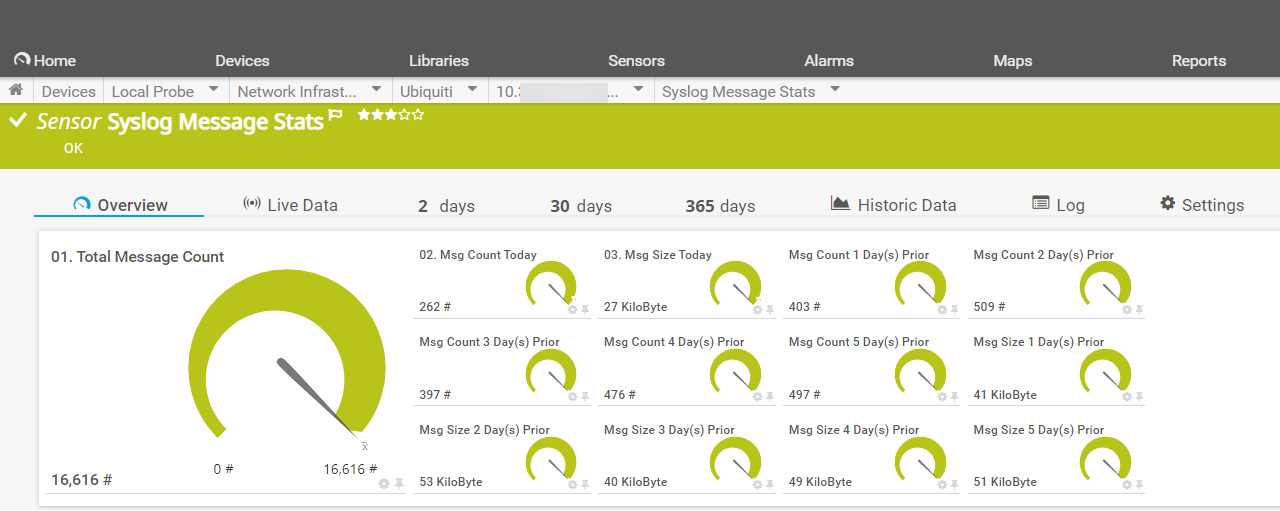
The sensor should be added to the source device in PRTG, not the Fastvue server, as it returns stats about the log source (the device). It returns 13 channels that show:
- Total Message Count
- No of Messages Received Today
- Size of Messages Received Today
- No of Messages Received Over Last Four days
- Size of Messages Received Over Last Four Days
The sensor requires four parameters to be passed to the script, and these are entered in the “Additional Parameters” field of the sensor configuration:

- Device ID: the unique hex identifier for the log source that we noted in the URL, earlier.
- Server: the IP address of the Fastvue server and the port number (default 47279).
- User & Password: credentials for the Fastvue server
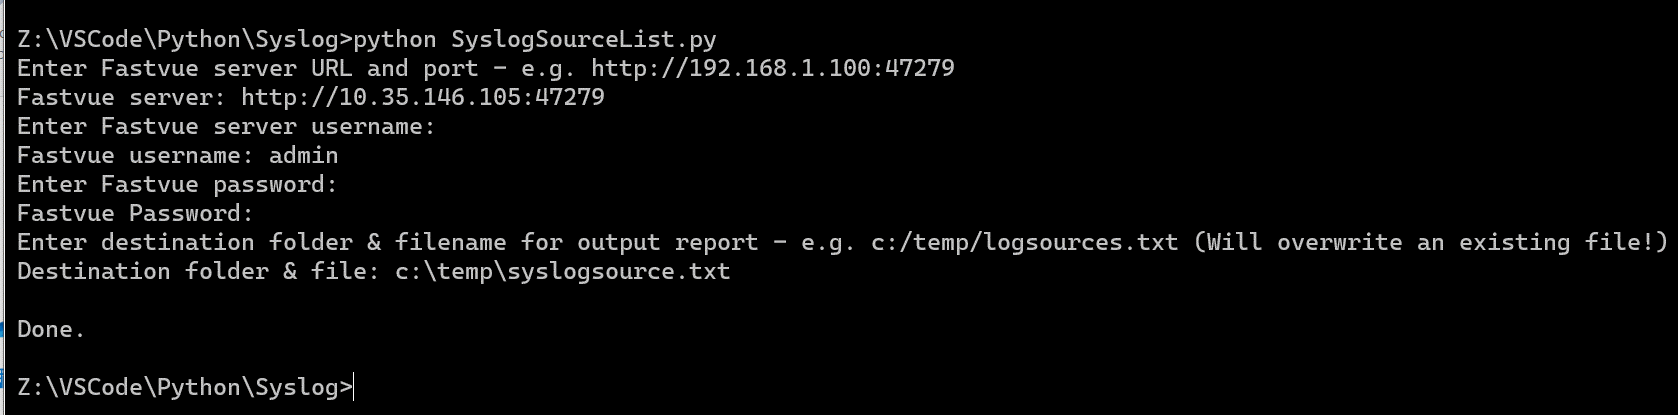
The parameters need to be formatted as a Python “dictionary”, which can be laborious to type out, so to simplify things, the Gitlab archive also contains a “helper script” that will query the Fastvue server and export the details of all defined log sources to a text file, along with a pre-formatted parameter string that can be copied and pasted into the sensor config. The script can be run from any PC that has Python 3 installed and doesn’t need to be run from the PRTG server.
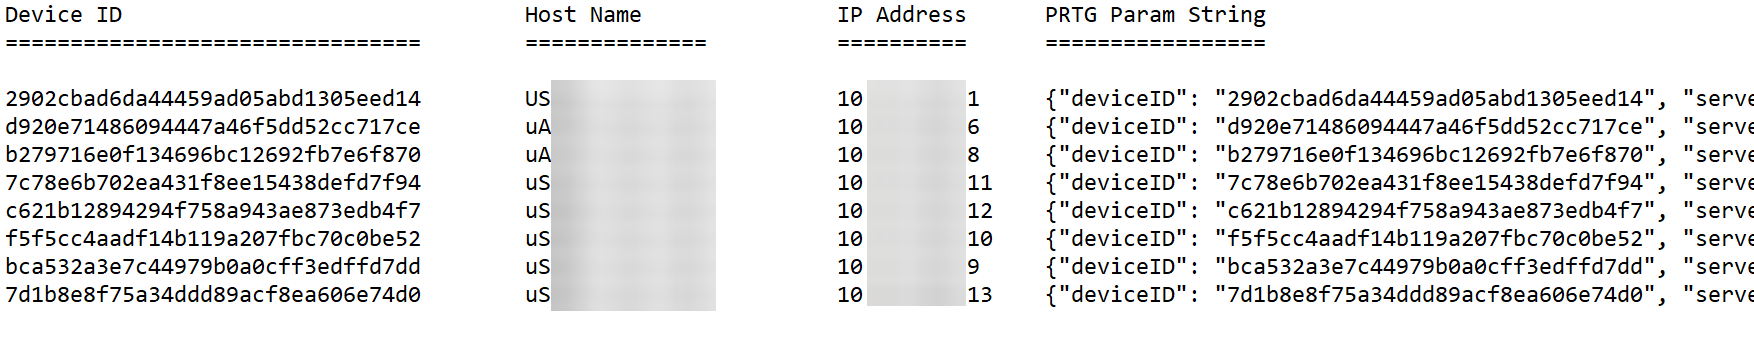
The resulting output file lists the Device ID, Hostname, IP Address and the complete PRTG Parameter String, including credentials. This can then simply be copied and pasted into the sensor config page.
Another useful trick you can use, is to add the path to the Fastvue server into the “Service URL” setting of the device you are monitoring:

This allows you to access the stored Syslog files for the device, simply by right-clicking the device in PRTG, opening the “Device Tools” menu and selecting “Go To Service URL”.
This opens another browser window from where the log and archive files for that device can be opened.
Although PRTG does have a native Syslog sensor, it can’t provide the historical data that would be useful for spotting developing problems, or patterns in Syslog activity. By leveraging the Fastvue Syslog Server’s REST API, Admins can add this missing historical capability into PRTG. They can also access the raw Syslog files, stored on the server, with a just a couple of mouse clicks.

It may have been around for a long time, but Syslog still has a vital part to play in the management and administration of IT networks. By adding API capabilities to their Syslog Server, Fastvue are making sure that this venerable protocol stays relevant and accessible to the latest generation of infrastructure management tools. 🍺 Oh, and don’t forget, on 3rd December, Syslog turns 18, so why not buy it a beer for all its years of outstanding service?