 Published by Guest Author
Last updated on January 23, 2024
•
7 minute read
Did you feel that moment of wondering when you were told that your new applications would be hosted in the cloud? I did. At what point did you really feel ready to manage them?
For many organizations, taking over the operation of a cloud-hosted application is a fairly new reality, and the implications in terms of organization, skills, and tools are still a topic to be addressed.
At the beginning, we don't really have a choice. The cloud provider comes with its own tools, which the integrator who accompanies you is trained to use.
As a result, the administrators find themselves with at least two monitoring tools: one they are used to and work with every day and one that only covers these new infrastructures. Each time you add a new vendor... you also add a new tool!
And that is when their daily life becomes really complicated and an integration mechanism that offers a consolidated overview of the entire information system and all these tools becomes essential.
How can cloud resource metrics be integrated into PRTG?
PRTG has long offered specific sensors for cloud environments such as AWS and, more recently, Azure. But as for the rest of the infrastructure, there is always that famous 20% of specific needs that still need to be covered.
The reason PRTG is an open infrastructure monitoring solution by nature is because there has long been a need for custom sensors. So it makes sense to continue to use PRTG as an aggregator of all your monitoring data including that of these new cloud infrastructures.
The question is how can you do it?
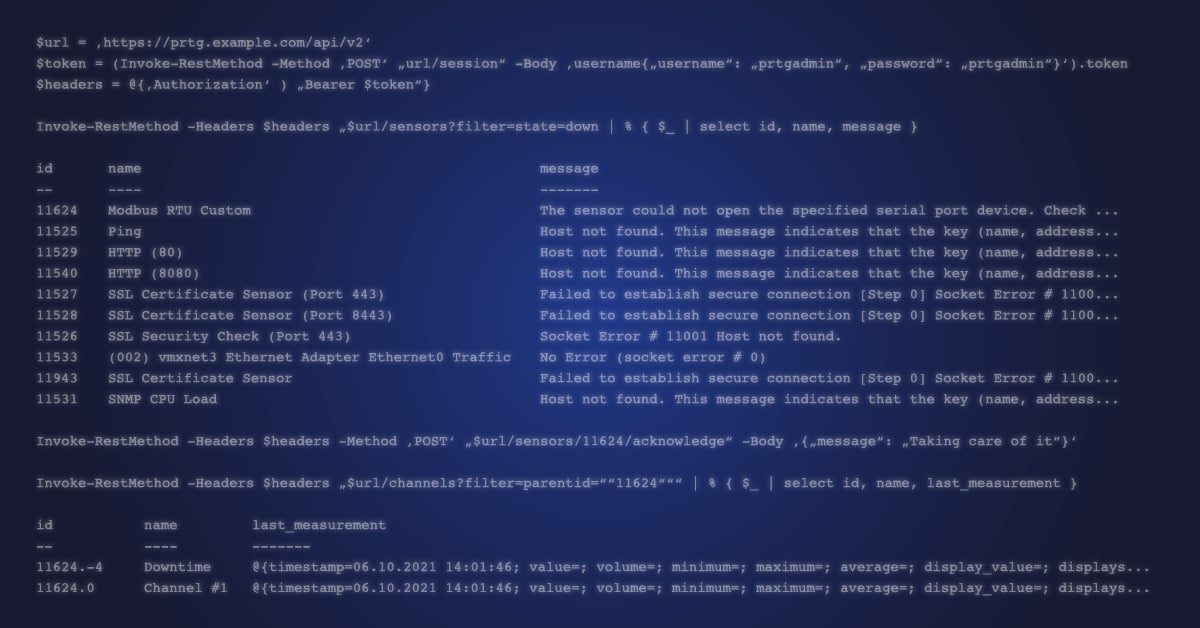
The obvious solution is to use REST or HTTP sensors that can request an endpoint and parse its content. This is an elegant solution as it is not very resource intensive and is suitable for many types of web resources.
But it doesn't cover all cases. Authentication sometimes requires the generation of a session token, and collecting metrics from a resource often requires soliciting multiple endpoints whose responses must be aggregated.
Then, the solution is to write and maintain a PowerShell or Python script. This solves all the abovementioned problems.
Of course, you need to have the time and the skills to do it. Or, you can find ready-made scripts for free or for a fee from vendors. It is also sometimes difficult to manage the execution load of these scripts.
The fact remains that these scripts have to be deployed on each probe where they are needed and they should be updated as often as the APIs of the cloud providers evolve.
This is what we want to draw your attention to. Unlike APIs for internal components such as your storage array or network orchestrator, cloud provider APIs are constantly evolving, which makes maintaining these "hard" scripts quite tedious.
How can you combine the advantages of these two solutions while forgetting their disadvantages?
The Senhub approach
Senhub takes the complexity of writing, maintaining, deploying, and running the scripts off the shoulders of your PRTG platform team and makes the integration of this new sensor as easy as the integration of a native sensor.
Fully functional chain
How do you deploy a sensor with Senhub?
Senhub can be configured via its graphical interface or its REST APIs by your automation tool.
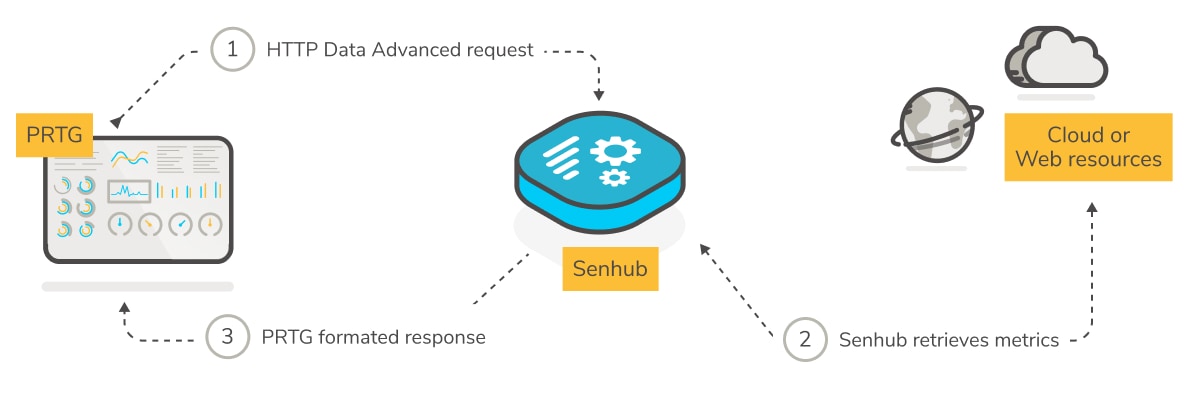
Once the two-step configuration is done (see the example below), Senhub provides you with a unique endpoint that you will be able to configure in an HTTP Data Advanced sensor.

Each time the endpoint is requested, Senhub queries the cloud resource and responds to your platform in the PRTG-specific JSON format. So there is nothing more to do, except to set the thresholds that suit you.
Let's look at two simple examples of the implementation of the solution and its benefits.
Example 1: APM tool integration
Beyond the technical infrastructure monitoring comes the quality of service perceived by the user. To cover this key aspect of what is IT service quality in 2021, we use APM tools like Ekara by ip-label or Synthetics by New Relic to put ourselves in the users' shoes. We measure response times very precisely and verify that the application is working properly.
In concrete terms, the APM tool regularly runs a user scenario (Scenario) or collects metrics of each user transaction for each connection (Real User Monitoring).
By connecting your APM tool to PRTG, we enrich the administrators' cockpit with crucial information. Senhub does this in a very simple 2-step process:
The first step is to provide Senhub with some information like credentials and parameters:
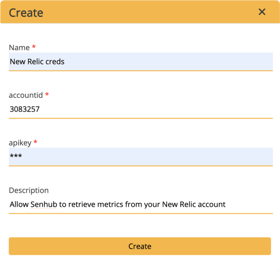
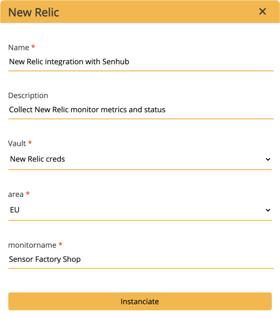
Guided configuration workflow
The second step is to get the dedicated endpoint from Senhub and to configure it in an HTTP Data Advanced sensor.
The third step is, well, there is no third step except to integrate this brand new sensor in your alerting scheme!
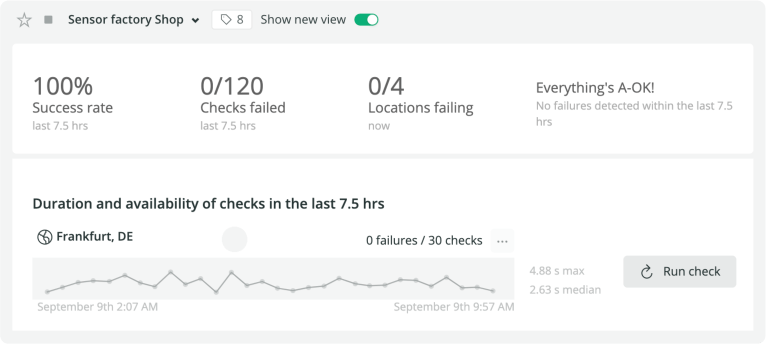
New Relic Synthetics dashboard
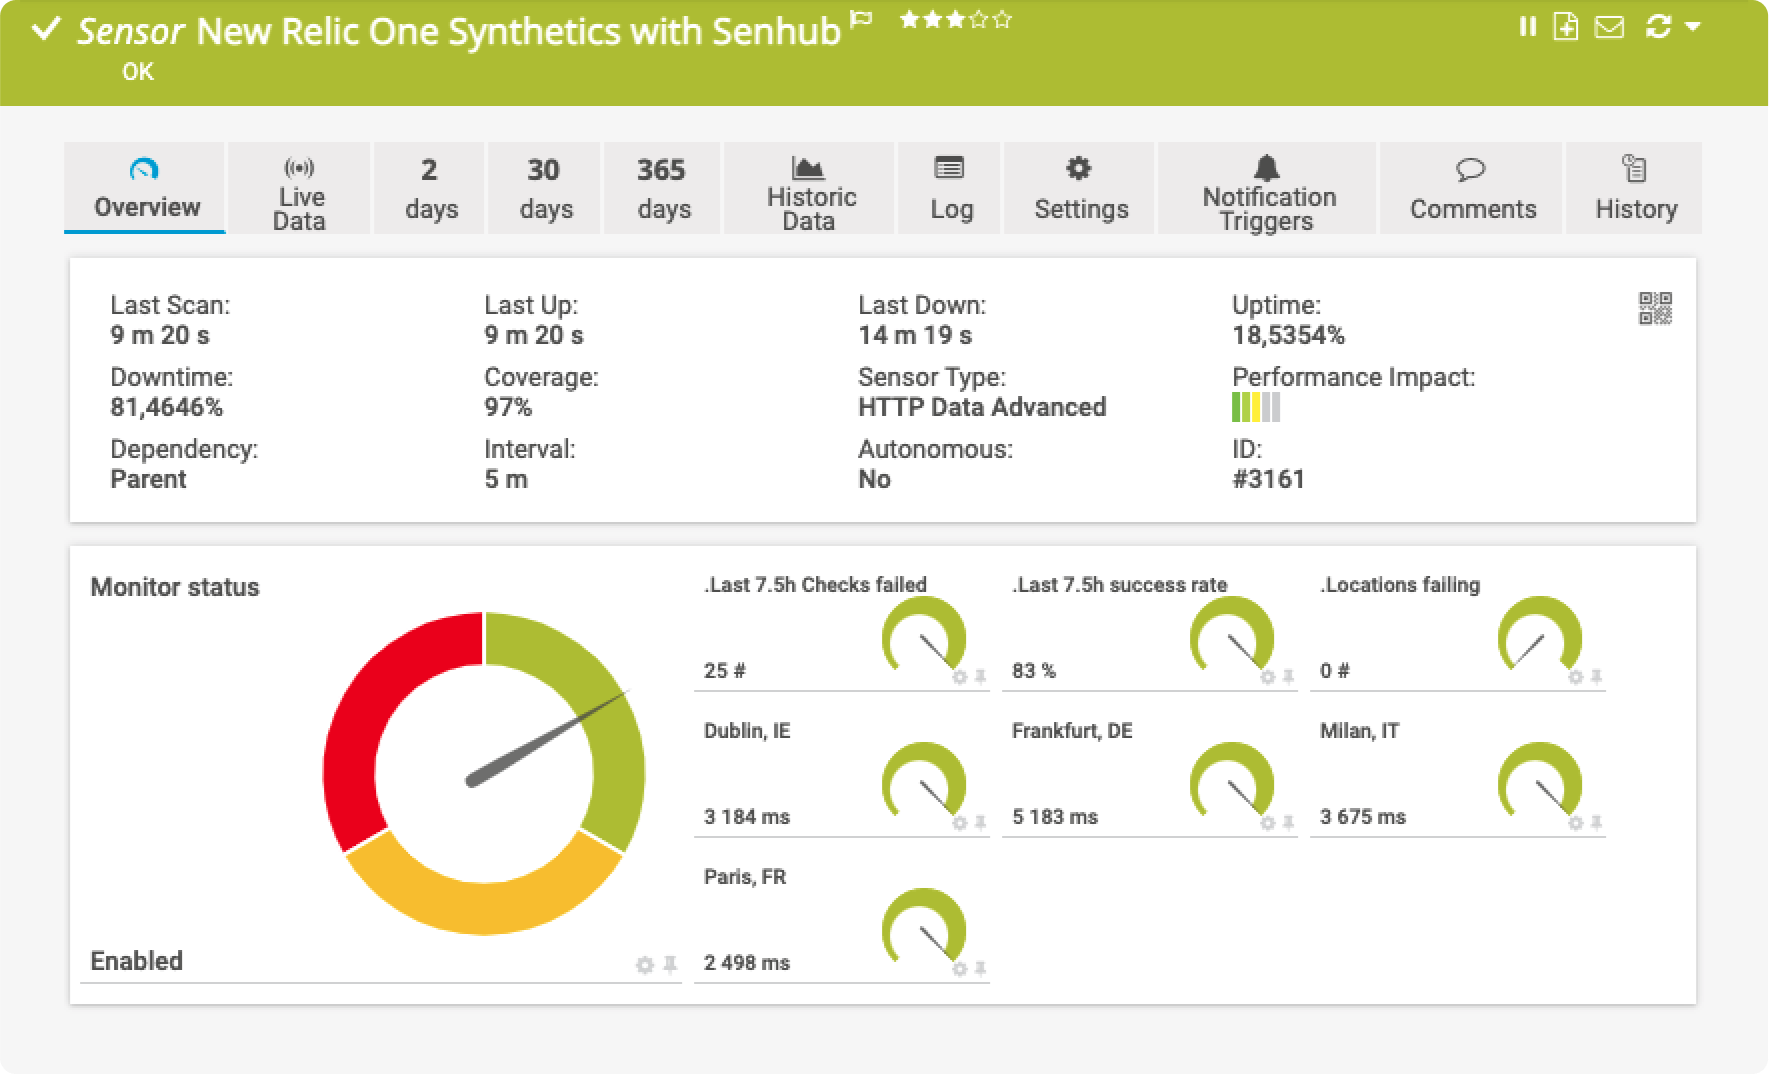
Senhub rendering in PRTG
Example 2: Azure Service Bus deep metrics
Being exhaustive in the world of IT monitoring: it's complicated.
It is impossible to develop and maintain thousands of sensors to meet the specific needs of each administrator. In the same way, APIs sometimes return a plethora of information that cannot always be grouped together within the same sensor, especially if we apply Paessler's recommendation to not exceed 50 channels.
Senhub effectively complements PRTG for these specific needs.
For instance, in recent application architectures, developers use Azure Service Bus components, which are nothing more than the pipes through which applications exchange data with each other. When we say "exchange", we mean "queue" and subscriptions management between applications. We understand that this service bus is a crucial component of the software architecture. Senhub allows you to collect the metrics of each queue in PRTG.
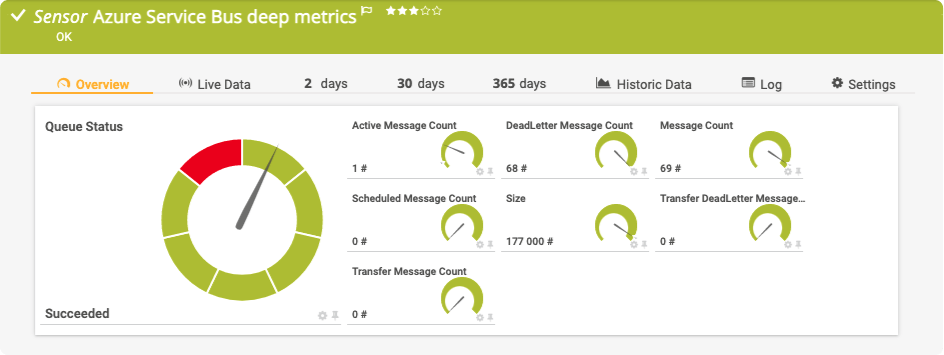
Azure Service Bus queue metrics
The future
After this first decade of the "cloud generation", only few people still say "this is the future, everything must go to the cloud".
The truth lies, as it often does, in a very pragmatic middle ground. Some parts of the information system are much better managed by specialists in the cloud while others continue to be more efficient and hosted in the warmth of your own data center.
The only real issue is keeping an eye on and consolidating all the metrics on the operation of the now hybrid and multi-vendor cloud information system. It is also essential to keep the alerting function centralized and to not complicate the management of the IT team's workflows.
As the French saying goes, "Trust cannot be delegated". If we follow this precept, it is a good idea to keep the control of your monitoring tool and to enrich it with new-generation connectors like Senhub.
Matthieu Noirbusson
Co-founder and President
Read more about Senhub: https://senhub.io
About the author
For more than 20 years, Matthieu Noirbusson has created numerous IT infrastructures and spent a lot of time solving IT production problems. He co-founded Sensor Factory because, as an IT manager, he could not find a partner that was able to help his teams to maintain their IT management tools in operational condition.
After several years of research and development for his customers, he and his DevOps team created Senhub, which is a next-generation metrics mining tool.
When Matthieu is not busy promoting the quality of his teams' work and making sure his children's homework is done, he is sailing in all its forms.