 Published by Sascha Neumeier
Last updated on August 13, 2024
•
7 minute read
Just a short while ago, I introduced you to PRTG Release 21.3.69, with a load of new sensors, and now the next version is ready for installation. And this version also comes with brand new stuff!
Today I’ll show you the new sensor types HPE 3PAR Common Provisioning Group, Microsoft Azure SQL Database, and Microsoft Azure Storage Account. Our labs also crafted the experimental sensor types Local Folder and Redfish System Health for this version.
In addition, we have further improved existing sensors, included new language files and more. So, grab a fresh cup of coffee, find a relaxing seat, and enjoy the next minutes of condensed info about PRTG. ☕
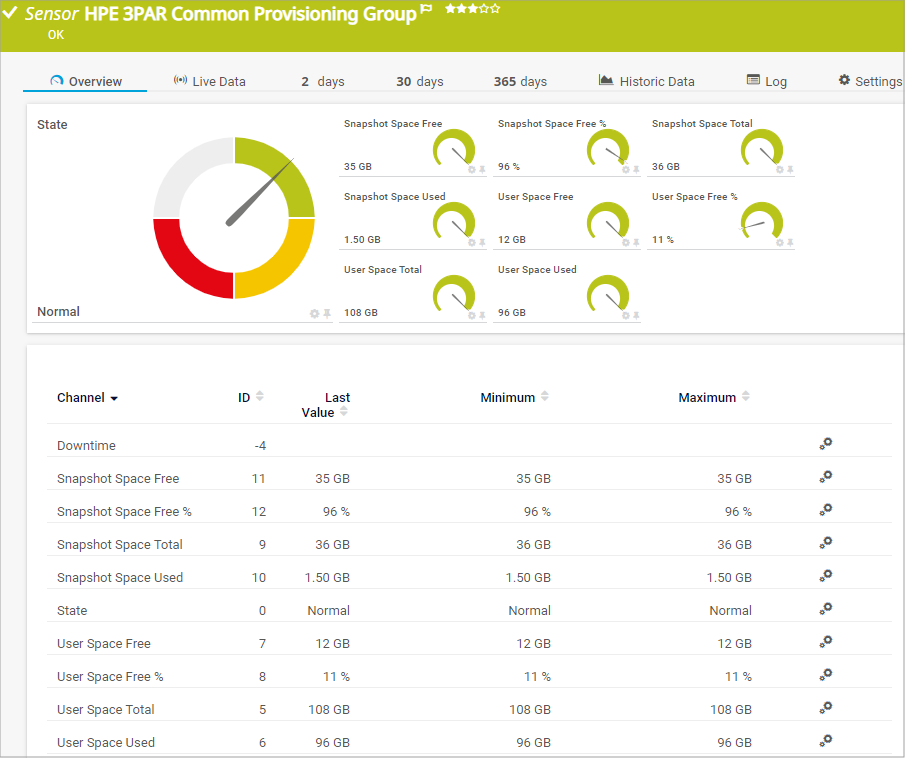
NEW: HPE 3PAR Common Provisioning Group
The HPE 3PAR Common Provisioning Group sensor monitors a CPG of an HPE 3PAR storage system to help you ensure there is enough capacity available on your storage system. The sensor shows the overall state of the CPG as well as free, allocated, and used logical space, snapshot space, and user space.
We introduced this sensor as an experimental version with PRTG 21.1.65, being our first sensor for HPE 3PAR monitoring. From now on, the sensor is available in all installations even if you have not activated the experimental features in PRTG.
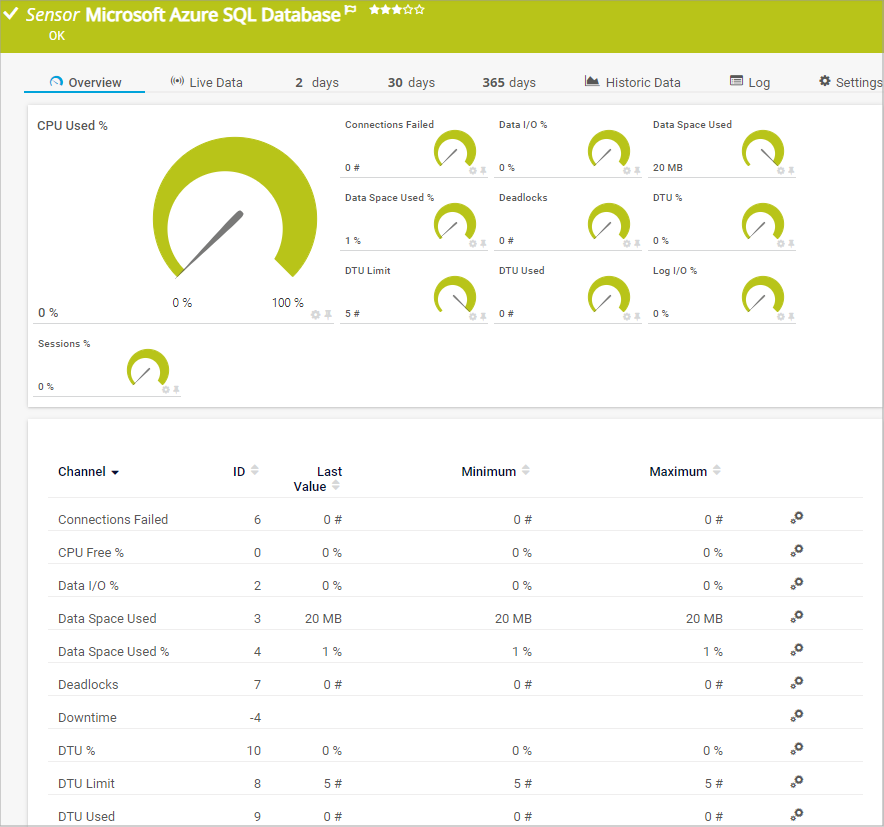
NEW: Microsoft Azure SQL Database and Microsoft Azure Storage Account
The Microsoft Azure SQL Database sensor monitors Microsoft Azure SQL Database instances and shows several metrics for a defined instance type. It can show, for example, CPU and disk usage, number of deadlocks, DTU and eDTU usage and limits, and sessions in percent.
We introduced this sensor as an experimental version with PRTG 20.4.64.
The Microsoft Azure Storage Account sensor monitors the storage account in a Microsoft Azure subscription and shows latency, traffic, and capacity metrics as well as the number of request breakdowns.
We introduced this sensor as an experimental version with PRTG 21.1.65.
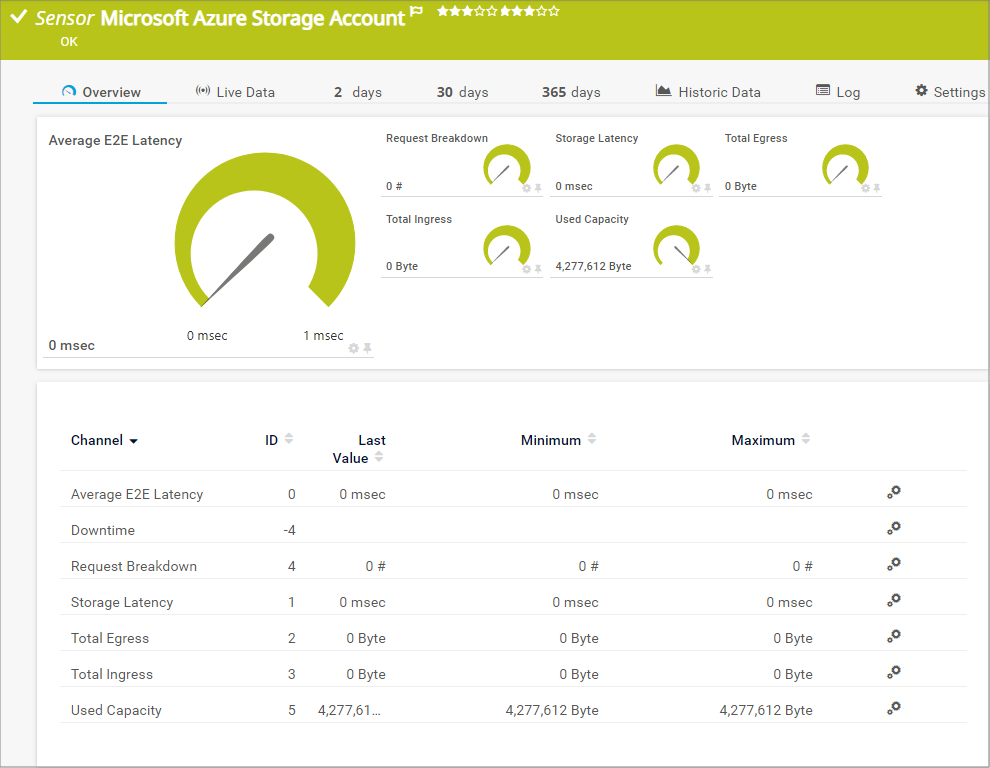
From now on, these sensors are also available in all installations even if you have not activated the experimental features in PRTG.
EXPERIMENTAL: Local Folder and Redfish System Health
Today we also release the Local Folder sensor and our first Redfish sensor. Both start in experimental stage and we would be happy if you give them a try.
If you don’t know what an experimental sensor is or how you can use these sensors in your PRTG infrastructure, I strongly recommend to you read the article New handling of beta sensors in PRTG Network Monitor.
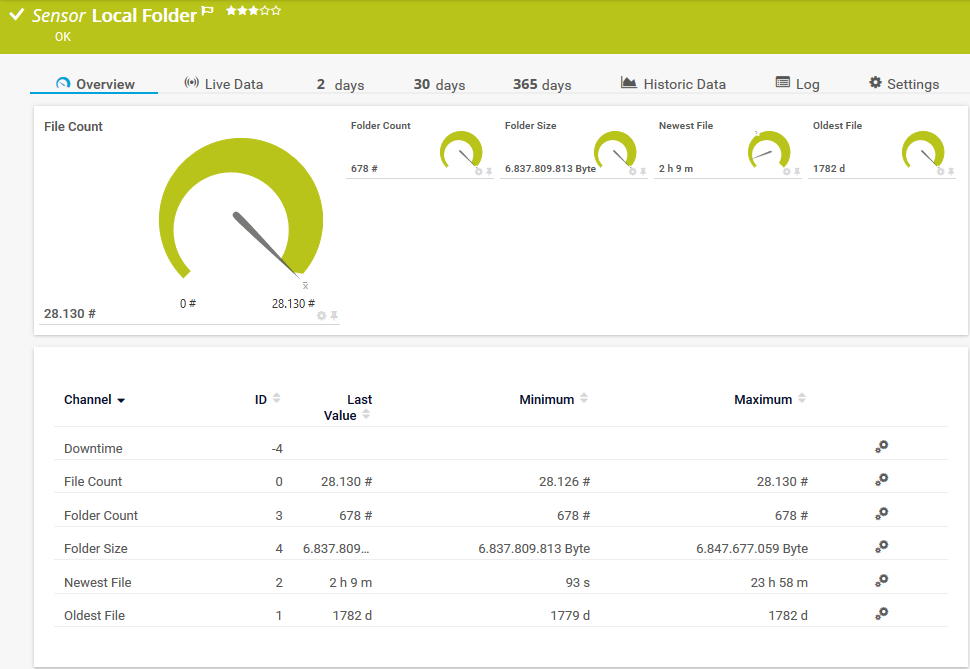
Local Folder sensor
The experimental Local Folder sensor monitors a local folder on the probe device. The initial version of the sensor in PRTG 21.3.70 can already monitor the number of files and folders in a local folder, as well as its size and the age of oldest and newest files. Upcoming versions of the sensor will include more options like the ability to filter for specific files. Further in the future, we also plan a sensor that monitors network shares. Together, they will replace the existing Folder sensor.
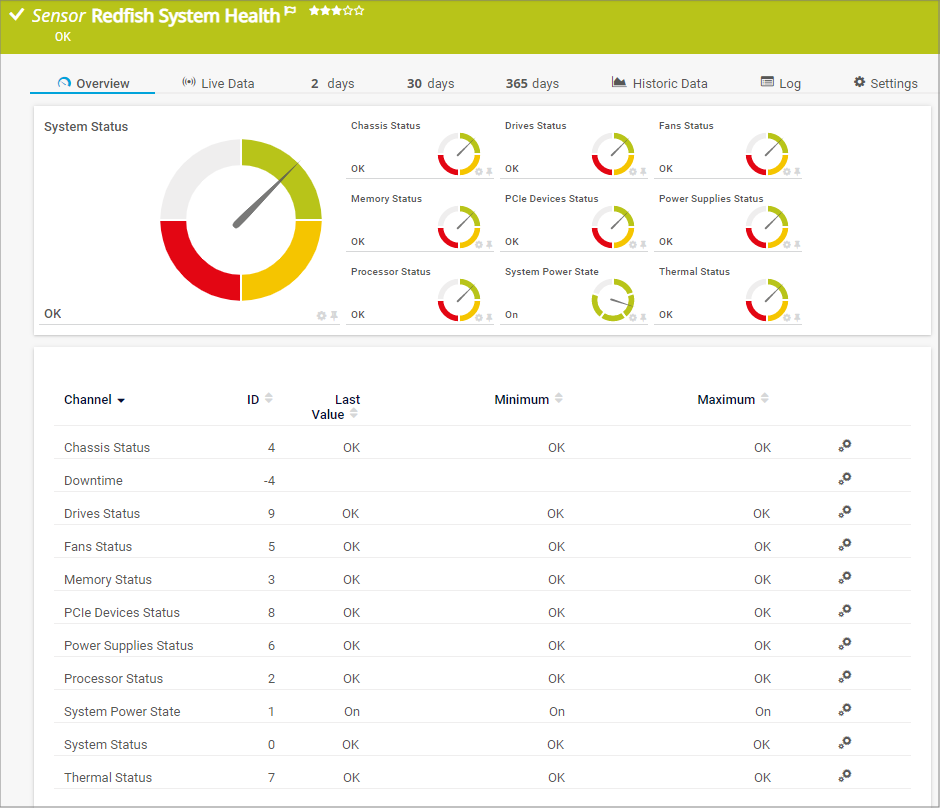
Redfish System Health sensor
Our first Redfish sensor is the Redfish System Health sensor. The sensor monitors the overall system status and the status of various components such as power supplies or PCIe devices, if available.
"Wait, what is Redfish and why do I need it?”
The Redfish standard is a suite of specifications that deliver an industry standard protocol providing a RESTful interface for the management of servers, storage, networking, and converged infrastructure.
Redfish has been slated to replace the Intelligent Platform Management Interface (IPMI) for hardware management over the network.
With Redfish sensors, you can monitor server hardware in the data center using the Redfish protocol from the servers' management controllers like Lenovo XClarity, HPE iLO, or Dell iDRAC.
To learn more, read our brand-new KB article I want to know which of my systems support the Redfish System Health sensor. Can you help me?.
...and much more
In addition to the new features, we also implemented several other improvements for PRTG 21.3.70. The WMI Event Log sensor now supports filtering by multiple event IDs just like the Event Log (Windows API) sensor, the OPC UA Custom sensor supports up to 10 channels, all language files are updated, and you can now include Microsoft 365 Service Status, Microsoft 365 Service Status Advanced, and Zoom Service Status sensors in device templates to deploy them via auto-discovery.
Speaking of auto-discovery, the sensor types OPC UA Certificate and OPC UA Server Status are now included in the initial auto-discovery and in the standard auto-discovery template.
Also check out our PRTG release notes
All in all, PRTG 21.3.70 includes 62 resolved issues. We implemented 16 features and stories, fixed 24 bugs, and finished 22 tasks and ToDos. Find all the details on our release notes page.
If you are a proud user of our cloud solution PRTG Hosted Monitor, you’ll get the latest version of PRTG automatically with the next rollout cycle.
Sneak peek at the next version
Our next PRTG release, which will be version 21.3.71, is planned for the end of September, and a quick talk to our Release Manager reveals that there will be quite some quite things being released.
For example, the Modbus RTU sensor is moving from the experimental stage into all versions, the next Redfish sensor is launching, as well as a massive improvement of the (still experimental) AWS ELB v2 sensor, plus a lot of other news. So, stay tuned and happy monitoring!
Check out our public roadmap
We also offer a public roadmap of PRTG on our website. There, you can read at any time about which features we are currently working on and what kinds of things we want to implement in PRTG in the future.


