 Published by Simon Bell
Last updated on January 23, 2024
•
7 minute read
Frequent visitors, (that’s all of you, right?) may have noticed we’ve recently become very interested in technologies outside of traditional IT-focused monitoring. That’s not to say that we don’t still feel the love for all things “LAN, WAN, server & SAN”. But as most of us at Paessler are hardcore, self-confessed, uber-geeks, we just can’t resist the lure of shiny new tech to play with. That’s why many of our recent blog posts have an IoT or Industrial IoT focus. It’s not just blog posts either: our last few PRTG releases have included new sensor types, specifically for this exciting field – MQTT, Modbus and OPC-UA sensors are now all available in PRTG, and we’ve written extensively about enabling technologies that can help with the sometimes difficult task of merging the IT and OT worlds.
In one of the recent articles, we looked at the INSYS icom range of smart edge gateways, and their ability to run containerised applications directly on the gateway hardware.
As highlighted in that first article, being able to run containerised applications, dev tools or even entire Linux distributions on your edge gateway opens up almost limitless possibilities for processing and sharing data. That includes getting monitoring data into PRTG. As mentioned, we’ve recently added support for several common OT /IIoT protocols to PRTG, but what if you’re running a protocol we don’t yet support? Or you need to do some pre-processing before passing the data to PRTG? That’s where the Node-RED for PRTG Connector can help - acting almost like a Babel Fish - translating data between different protocols and formats.
We’ve already written about how Node-RED and the PRTG Connector can be used to collect data from hundreds of different applications, systems and protocols, process that data and then forward it into PRTG.

Now we’ve taken that capability and built an LXC containerised version of it that can run directly on an INSYS icom MRX Smart Edge Gateway. The container is freely available directly from the INSYS icom container library. So, how does it work?
Simply download the Node-RED PRTG Network Monitoring Edition container from the INSYS icom library, and import it into your MRX device (or any other INSYS icom device that runs on icom OS), using the GUI:
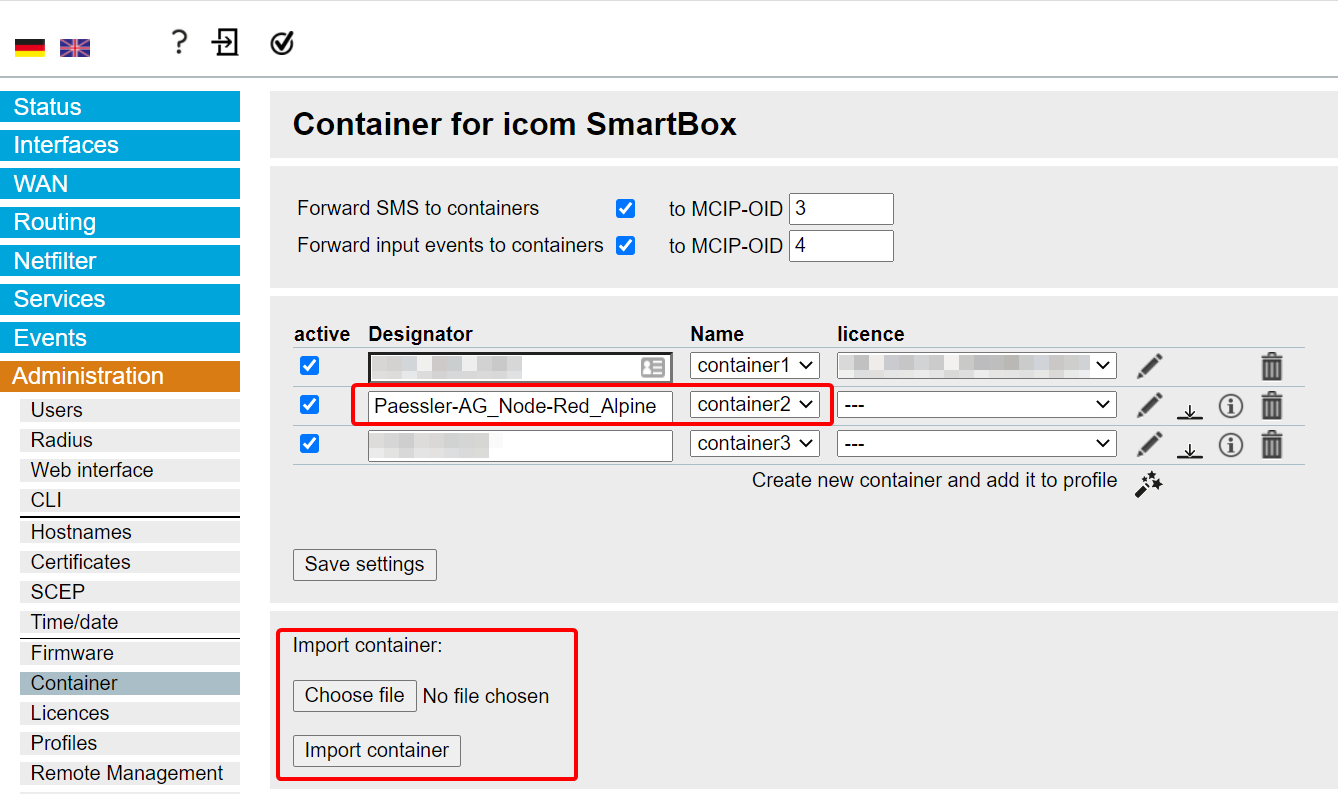
Once the container is imported, click the pencil icon, to configure the settings.
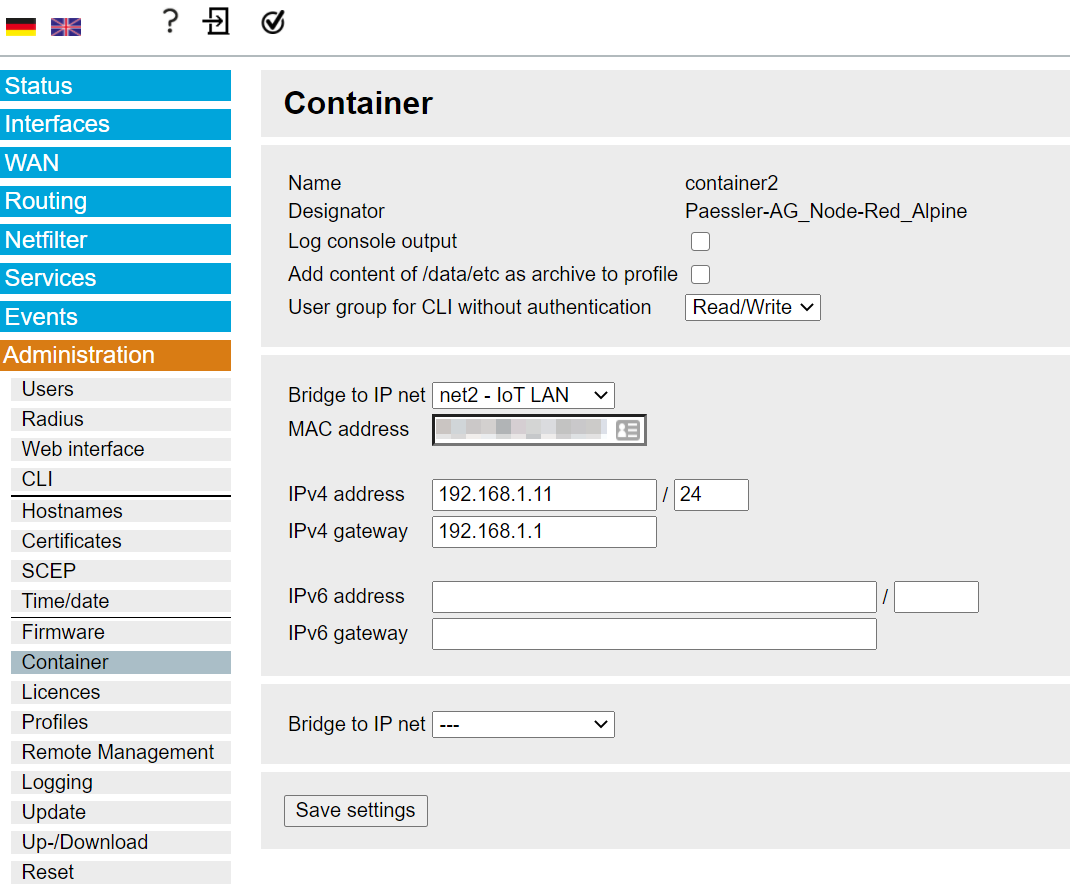
Here, you simply need to assign an IP address to the container and save the settings, and finally “activate the profile” by clicking the flashing icon on the INSYS icom menu at the top of the screen.
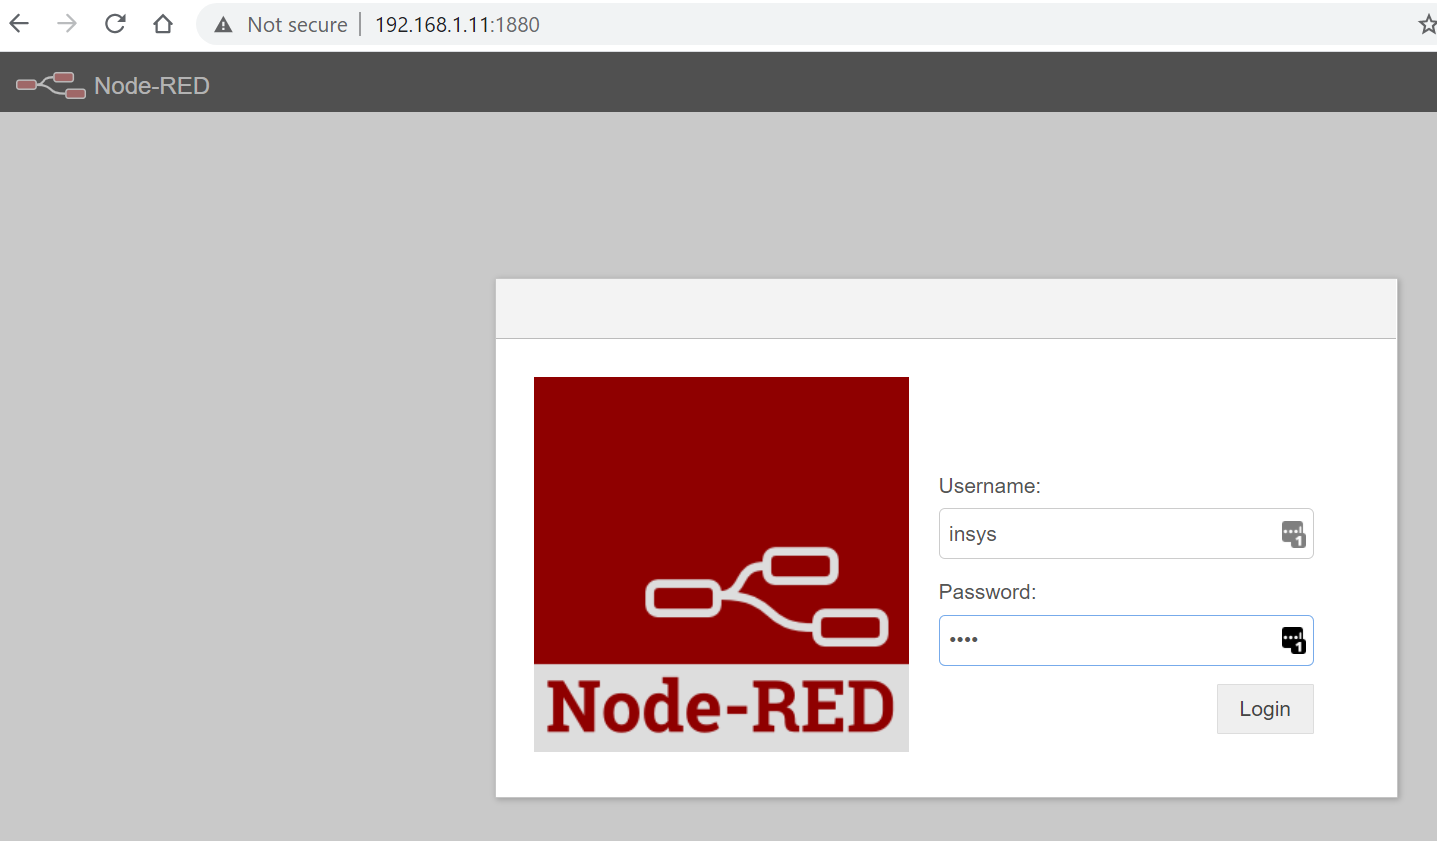
Now you should be able to point your browser to the default Node-RED port of 1880, at the configured IP address, and login using the default credentials (ID: insys PW: icom).
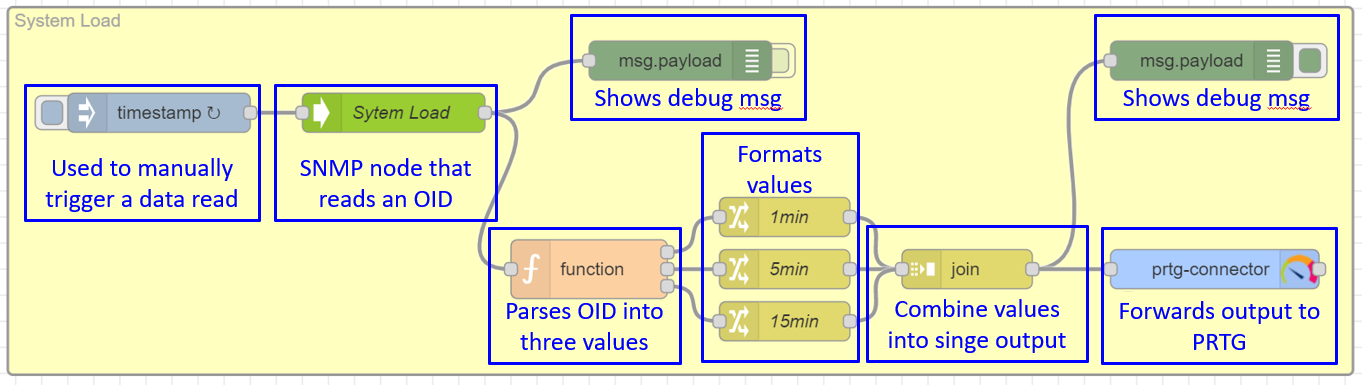
Node-RED should now open and be ready for you to start creating flows. We’ve provided a couple of examples to get you started – a flow that retrieves data from the icom Data Suite, which we talked about in the previous post, and passes it to PRTG, via the Connector. The second sample flow retrieves SNMP metrics from the MRX device, parses the output, and passes the result to PRTG, again using the connector. We’ll use the “System Load” sub-flow to walk through the configuration steps.
Before getting into the config details, let’s have a look at the System Load flow, and what each component does:
There are a few configuration changes needed to adapt the flow to your environment. To start, we need to enable the flow - double click the INSYS icom MRX (via SNMP) tab. Then click the Enable / Disable button at bottom left of the Flow Settings page, then click “Done”:
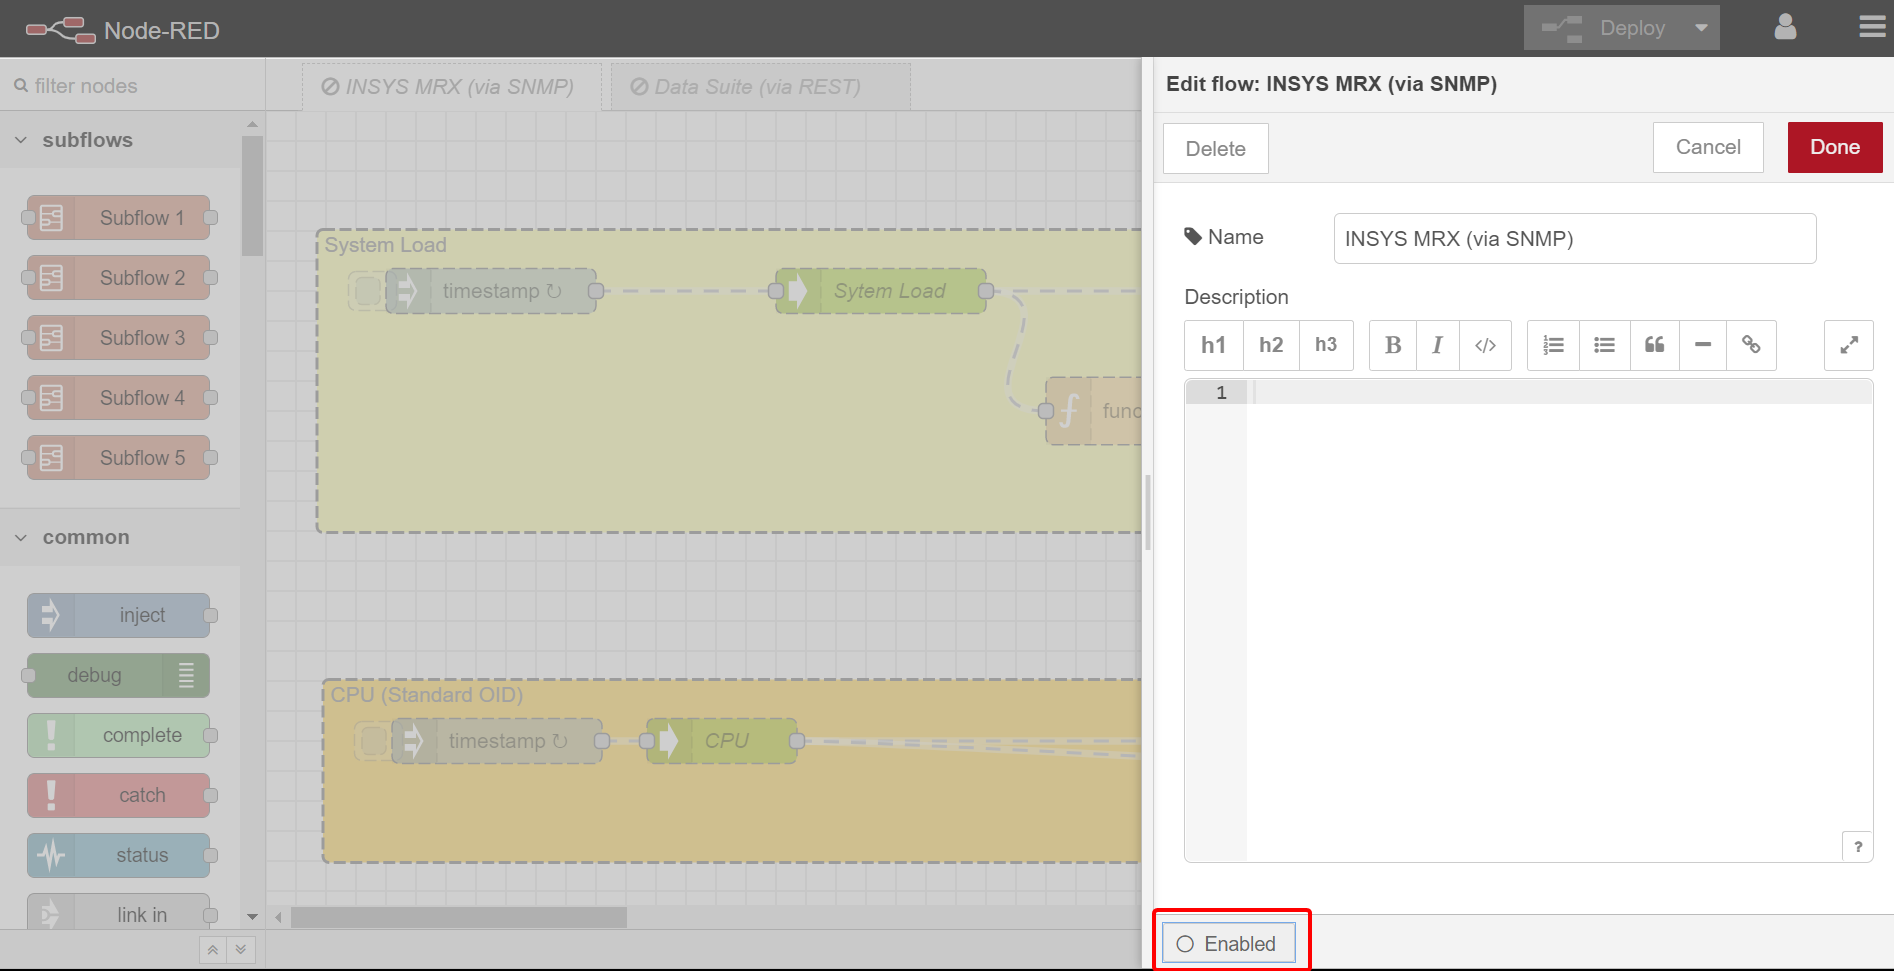
You’ll know the flow is enabled when the tab title is in bold text, and the flow components have solid (not dashed) borders.
Next, the “System Load” SNMP node needs to be edited to match your own settings. Double click the node and enter the IP address, Community String and verify the SNMP version, used by your MRX device. (Don’t change the OID as this is pre-configured to retrieve the System Load values.
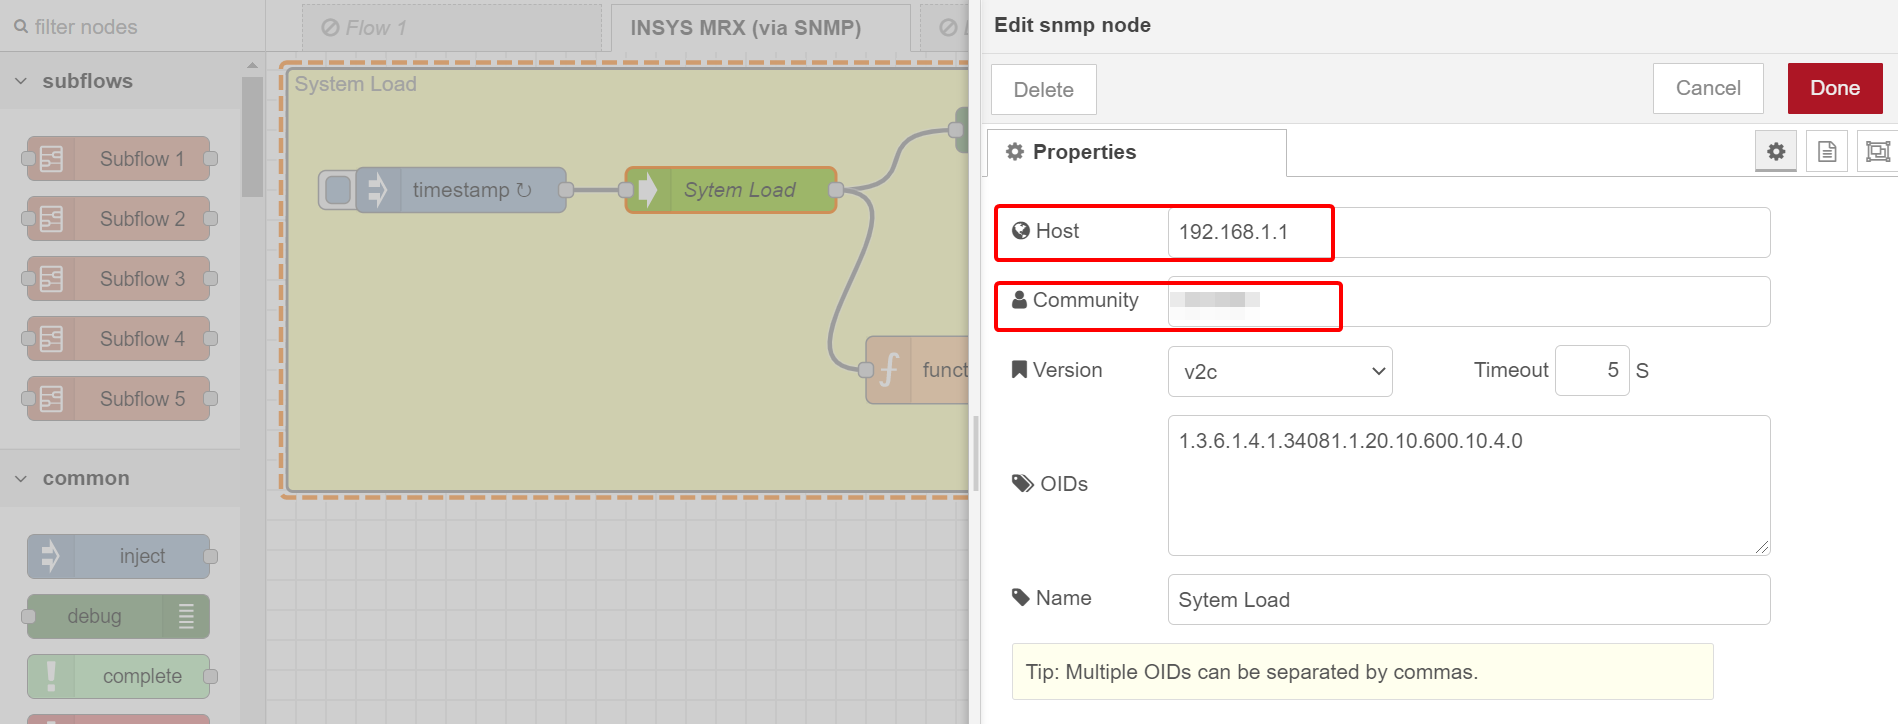
Click Done.
Next, we need to configure the PRTG connector. Double click the Connector icon, in the flow:
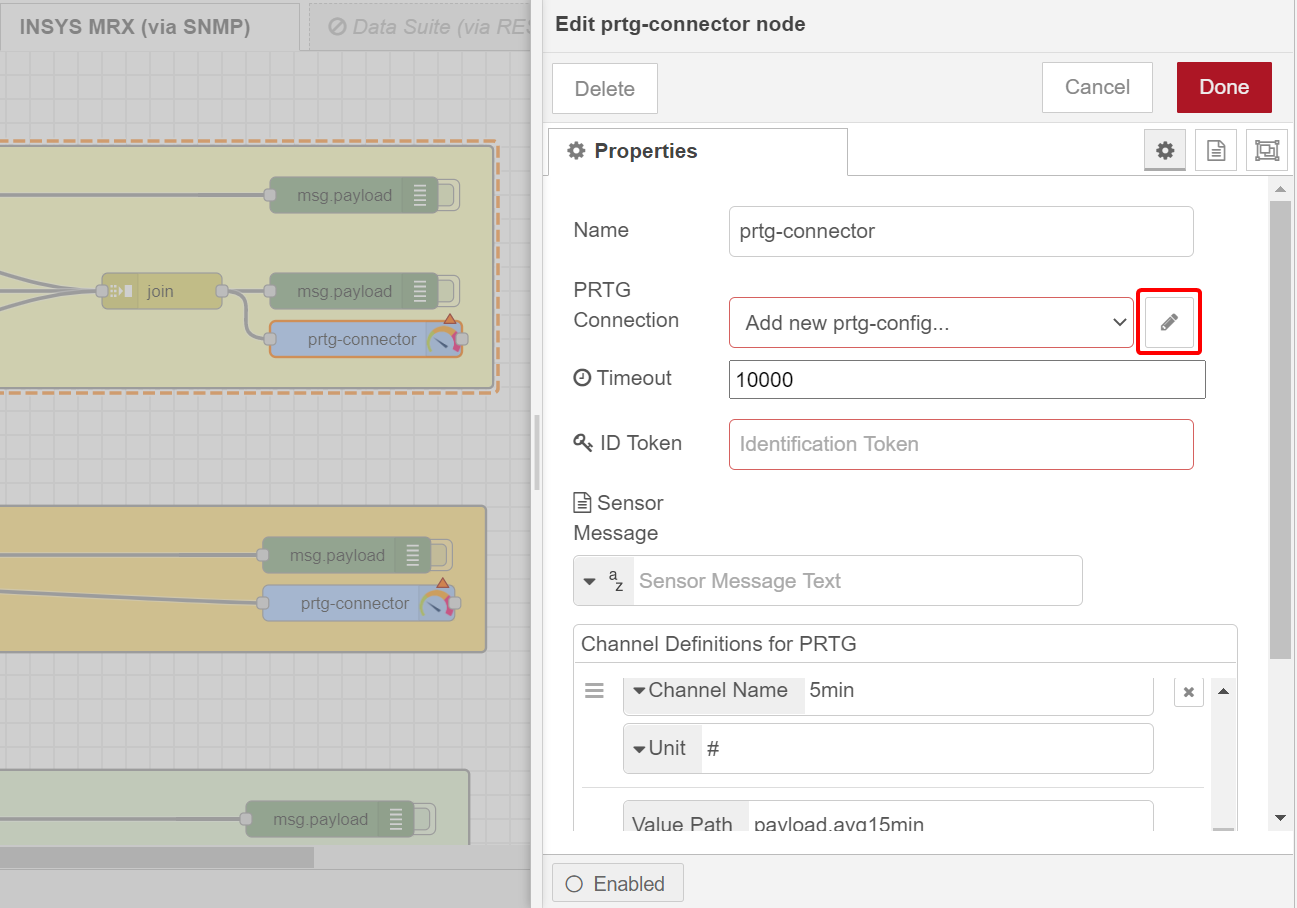
Then, click the pencil icon, next to “PRTG Connection".
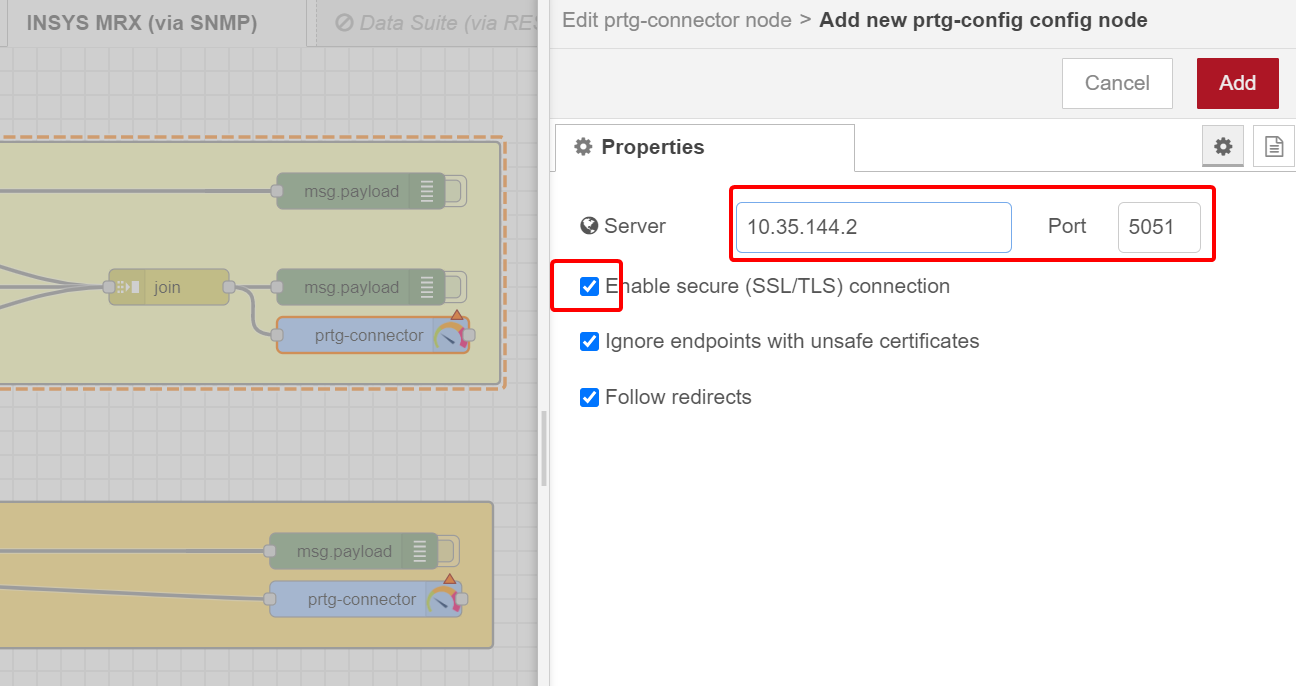
Add the IP address of your PRTG Server, and make sure the port is set to 5051 (the default port for the IoT HTTP IoT Push Data Advanced Sensor, we’ll be using to collect the data in PRTG). Also make sure “Enable Secure (SSL/TLS) Connection” is enabled. It’s important to check this because if you copy & paste, or duplicate flows containing the PRTG Connector, Node-RED will disable this option for security reasons, leading to errors. When you’re done, click Add.
The Connector Properties page should now reflect your changes:
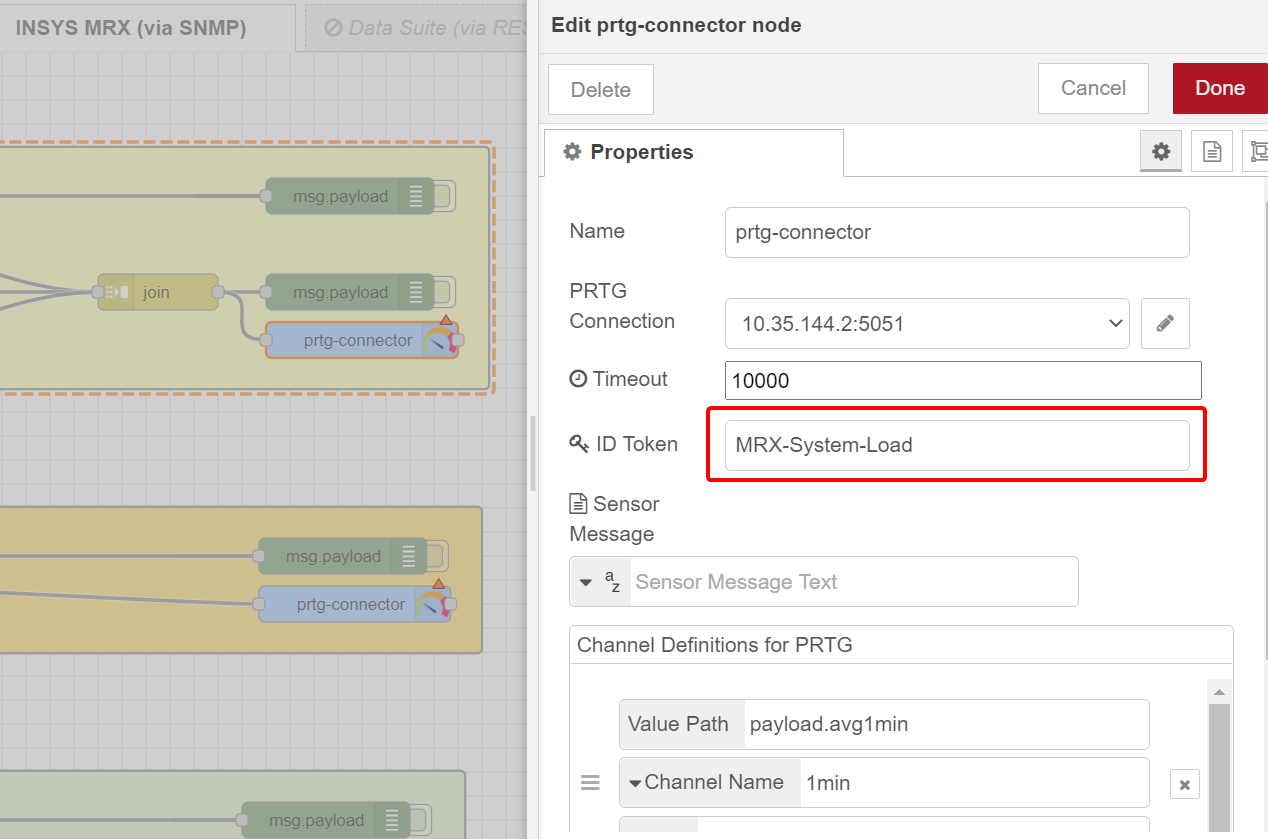
You also need to specify an ID Token, and for this there are two choices. You can either let PRTG create a random GUID, when you create the IoT HTTP IoT Push Data Advanced Sensor, which you need to copy and paste into the ID Token field in the PRTG Connector details. Or, as I have done here, you can specify a unique identifier of your own, which we’ll need to paste into the sensor config in PRTG. Click Done, once the settings are configured.
Remember, in Node-RED, you MUST click the “Deploy” button to activate any changes you make. (I forget to do this almost every time 😊).
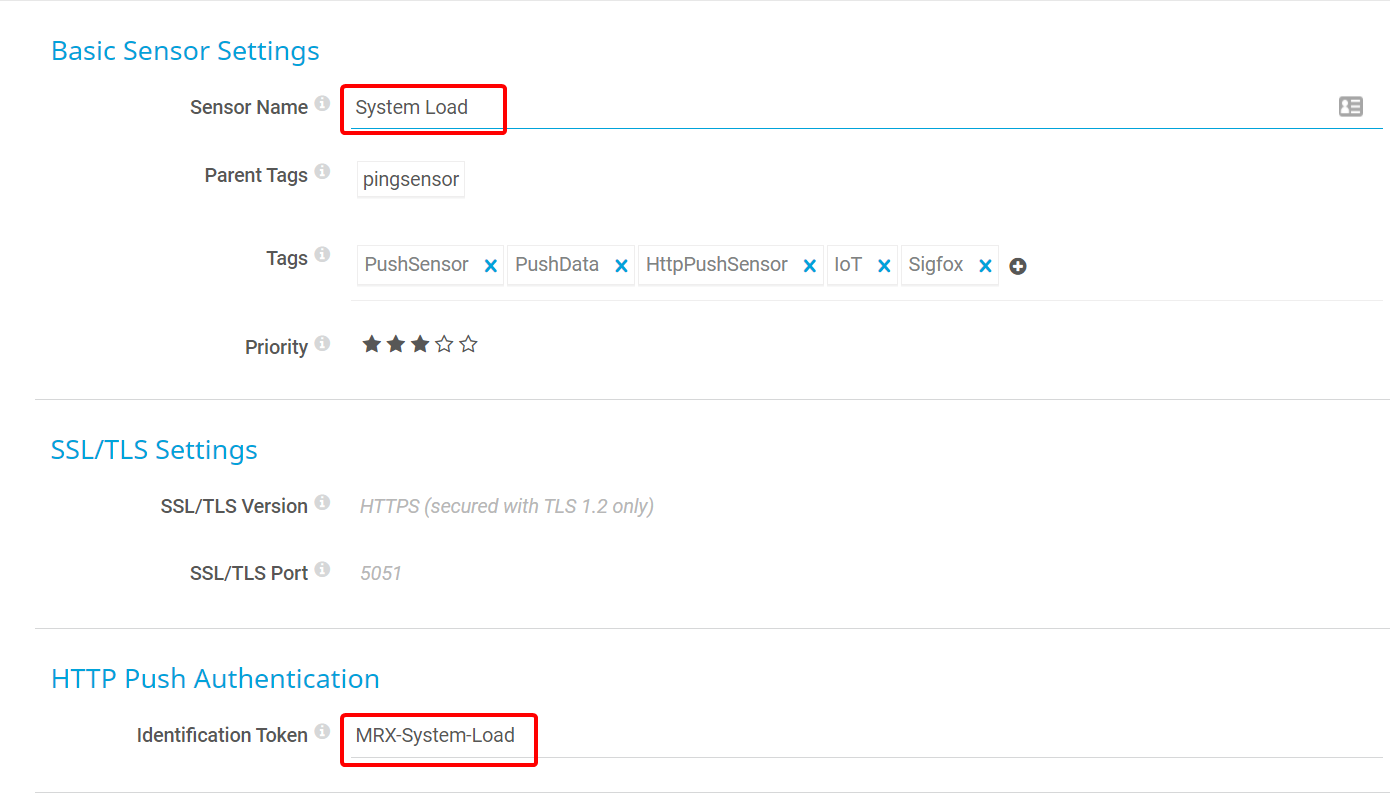
Moving to PRTG - I’ll assume you’ve already added the INSYS icom device - add a new HTTP IoT Push Data Advanced sensor to the device. Give the new sensor a meaningful name, and add the Identification Token:
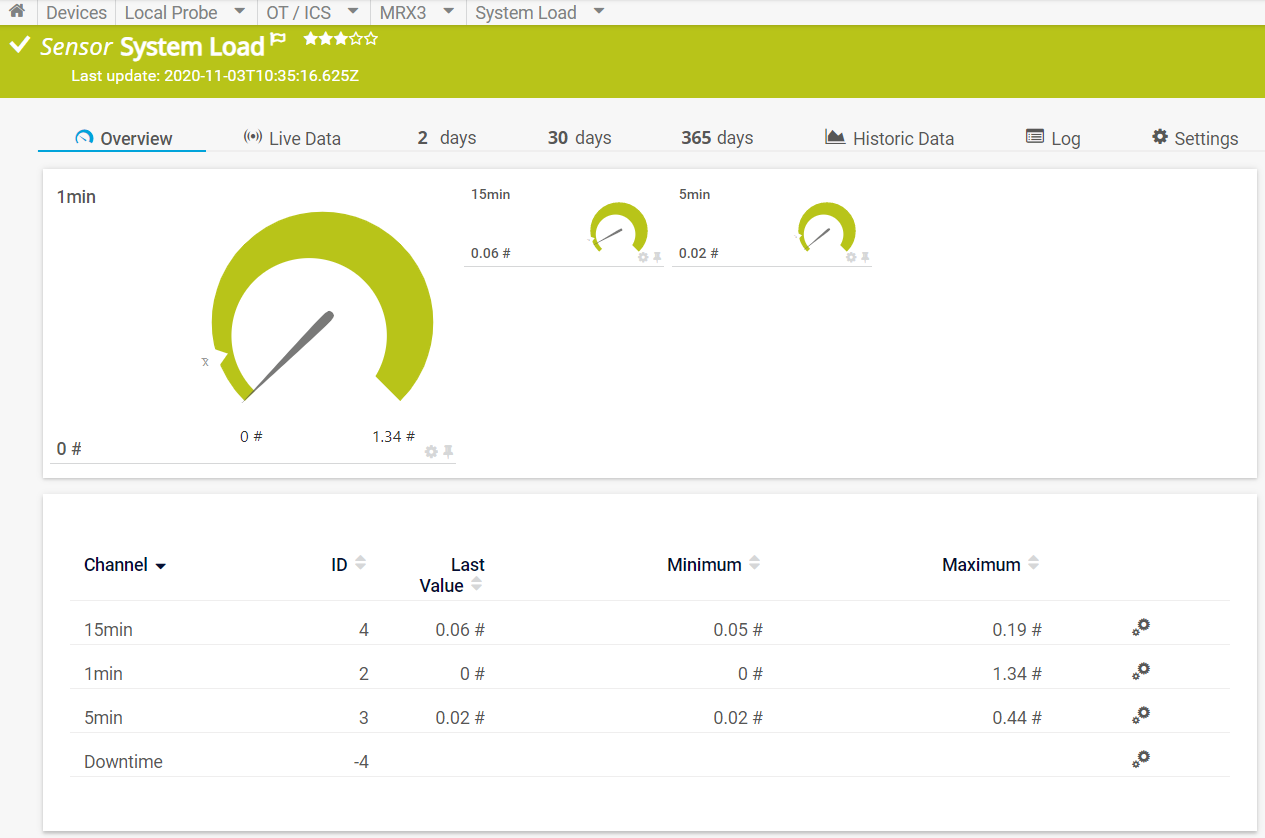
After a short delay, the sensor channels will be created and data will be displayed.
Combining the power of PRTG with the flexibility of Node-RED and the versatile, modular hardware of the MRX smart edge gateway provides a simple, efficient and low-cost solution for sharing monitoring data between OT and IT environments.


