 Published by Shaun Behrens
Last updated on July 06, 2026
•
10 minute read
In the world of industrial IT, there have traditionally been two kinds of monitoring solutions: those for the IT side, and those for Operational Technology (OT). But the convergence of IT and OT in industrial environments demands something better — a unified, real-time monitoring system that gives you full visibility into both worlds. That's exactly what PRTG delivers. With robust support for industrial protocols, real-time data collection, and a scalable sensor-based licensing model, PRTG has become a go-to industrial monitoring solution for industrial operations of all sizes.
Whether you're dealing with production lines, control systems, PLCs, or SCADA systems - PRTG brings all your monitoring data into a single interface, helping you optimize operational efficiency, reduce downtime, and streamline decision-making across your entire infrastructure.
PRTG is the perfect holistic monitoring system for your plant: powerful IT monitoring, support for the most common industrial protocols, and a license that doesn't restrict the number of users (PRTG is licensed by the number of sensors, or "data collectors" you need).
Watch the video below and read on for a detailed look at how PRTG fits into industrial environments.
IT and OT convergence
IT (servers, routers, switches, and so on) and OT (the automation equipment that controls and executes the production process) have become increasingly interconnected — with each other, and with external systems in the cloud or in data centers. Robots, PLCs, SCADA systems, MES platforms, and ERP integrations are no longer isolated islands. They're part of a complex, interdependent ecosystem where a single disruption can cascade across your entire production process.
This convergence has a direct impact on how you monitor your infrastructure. Where it used to be enough to have separate views of OT and IT, today you need a holistic picture — with real-time visibility across all layers. Especially where there are dependencies between systems: Is the smart industrial gateway up and sending data as it should be? If there's a failure in connectivity, does the problem lie with the machine, the gateway, or somewhere in the ethernet network? Without real-time monitoring across both worlds, finding the root cause of a problem takes far too long — and downtime is the price you pay. In industrial operations, that's a price nobody wants to pay.
These (and many other questions) are easier to answer if you have a more complete view. This means bringing OT and IT together into a single monitoring concept — something that we've written about before. How exactly have we done this with PRTG?
Ready to get real-time visibility into your industrial IT infrastructure?
Try PRTG free for 30 days — no commitment, no complexity, just monitoring that works from day one.

Monitoring the data flow in a factory
PRTG is well-known for its out-of-the-box support for most IT protocols and standards — SNMP, Flow protocols for bandwidth monitoring, packet sniffing, RESTful API for device metrics. But that support now extends well into the realm of industrial IT, too, primarily through protocols commonly found in OT environments. Over the past several releases, PRTG has added a growing set of options for industrial monitoring, covering everything from production lines and control systems to PLCs, SCADA systems, and IIoT devices on the factory floor.
The goal? Give IT administrators like you a single, unified monitoring system that covers both your classic IT infrastructure and your industrial processes — without the need for separate, expensive monitoring tools that don't talk to each other. Think of it as your industrial IT command center: real-time data from every corner of your operation, all in one place.
Here's an overview of the key functionality for bringing OT data into PRTG.
PRTG is well-known for its out-of-the-box support for most IT protocols and standards, which help system administrators to monitor their environments. This includes SNMP capabilities, monitoring bandwidth using common methods like Flow protocols or packet sniffing, and getting device metrics using RESTful API. But now this support is being extended into the realm of industrial IT, too, primarily through support for protocols commonly found in OT. Over the past few releases, several options for monitoring OT have been added to PRTG.
Here's an overview of the new functionality for bringing OT data into PRTG.
OPC UA
Open Platform Communication United Architecture, or OPC UA, is a widely adopted, platform-independent, service-oriented architecture for industrial automation. As more and more manufacturers have adopted the standard, it has become a principle  way for OT devices to connect and communicate with each other and with external sources.
PRTG supports OPC UA monitoring with multiple sensors. The OPC UA Server Status sensor monitors the status, uptime, and diagnostics of your OPC UA server. Beyond that, the OPC UA Custom sensor lets you collect real-time data from any device communicating via OPC UA — giving you flexible, deep access to your industrial processes and process control interfaces without additional tooling. For IT admins who need to monitor industrial environments without becoming OT specialists overnight, this kind of out-of-the-box functionality is a real game-changer.
MQTT
With the rise of the Industrial Internet of Things (IIoT), more devices than ever are using MQTT - a lightweight, publish-subscribe protocol - to transmit their data. MQTT is particularly useful for collecting metrics from large numbers of sensors tracking data points like temperature, energy consumption, health status, or object motion on the factory floor. In industrial IoT environments where thousands of data points need to flow in real time, MQTT is often the protocol of choice
Smart industrial gateways, which collect data from OT devices and systems, often send information to external data targets (like the cloud or data centers) using MQTT. This makes MQTT a critical piece in the puzzle of connecting OT and IT — and a key enabler for remote monitoring across distributed industrial environments. As a practical example, consider how PRTG can be used to get data from an INSYS icom smart gateway.
PRTG offers three new sensors for monitoring MQTT data:
- MQTT Subscribe Sensor - subscribe to a specific topic to bring in data sent by devices about that topic, and send out MQTT-based notifications
- MQTT Statistics Sensor - track statistics such as the volume of MQTT messages being broadcast by the MQTT broker about different topics.
- MQTT Roundtrip Sensor - ensure that MQTT devices are up and available for communication.
Modbus TCP
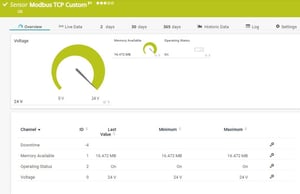
The Modbus TCP protocol has a massive installed base and is used by a huge variety of devices in the industrial, energy, and building-automation spaces. PRTG offers a Modbus TCP sensor that can access data from this equipment and monitor up to five metrics per device — think cooling units, power supplies, backup generators, or virtually any Modbus-compatible hardware. No need to replace legacy equipment just to gain visibility into your data acquisition processes. This is especially valuable in older industrial environments where replacing hardware is not an option, but monitoring operational costs and uptime absolutely is.
Soffico Orchestra
Soffico Orchestra is used in industrial technology to manage and automate manufacturing processes. PRTG includes a Soffico Orchestra Channel Health sensor that monitors the status of Soffico Orchestra and shows the number of successful and failed channel calls — helping you detect deviations and disruptions before they escalate into real problems. In complex industrial processes where even small anomalies can affect product quality or trigger equipment failures, this kind of early-warning diagnostics is invaluable.
These sensors are just part of the picture. PRTG continues to expand its industrial monitoring capabilities — including integration into the Siemens Industrial Edge ecosystem, which brings unified visibility across IT and OT environments in manufacturing and production facilities. More use cases, more protocols, more devices: the roadmap for industrial IT monitoring with PRTG is growing steadily.

Bringing the information into one view
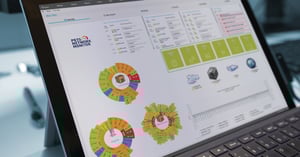
Something that PRTG has always done well is create a unified overview of an entire infrastructure. With full support for industrial protocols and devices, PRTG offers out-of-the-box functionality for bringing OT monitoring into your IT monitoring concept — without the cost and complexity of a dedicated SCADA system.
The real value shows up in the dashboards. You can use PRTG's map editor to drag and drop your way to a custom visualization of your entire environment — IT and OT side by side, in real time. Set thresholds, define alerts and notifications, and use your monitoring data to support predictive maintenance and smarter decision-making. Spot deviations early, identify the root cause of disruptions faster, and reduce the risk of unexpected breakdowns on your production lines. Whether you're managing industrial processes on-site or keeping an eye on remote monitoring across multiple locations, PRTG gives you the operational efficiency and real-time monitoring you need to stay ahead of equipment failures.
The sustainability angle is worth mentioning, too. With real-time data on energy consumption across your devices and systems, you can identify inefficiencies, reduce operational costs, and make your industrial operations more sustainable — all from the same monitoring system you use for your classic IT infrastructure.
And because PRTG is scalable, it grows with you — whether you're monitoring a single factory floor or a distributed network of industrial environments across multiple sites. There's no need to invest in separate monitoring tools for IT and OT. One platform, one set of dashboards, one place to find your answers.
For some examples of how to use PRTG to monitor industrial IT, here are three use cases.


