As a testbed and demonstration website for the "Remote Probe" feature of our monitoring software PRTG Network Monitor (and out of technical curiosity) we have set up a network of monitoring stations around the globe based on PRTG.
We used the following locations and hosting companies:
| Location | Hosting Company | Monthly Cost (US$) | Reliability Rating |
| San Francisco USA | GoGrid.com | $75 | ***** |
| London UK | webhosting.co.uk | $43 | **** |
| Edinburgh UK | FlexiScale.com | ($105) | * |
| Cologne DE | HostEurope.de | $27 | ***** |
| Singapore SG | usonyx.net | $75 | **** |
| Nuremberg DE | Our own office datacenter | $0 |
- Amazon recently announced support for virtual Windows machines on its EC2 computing cloud, we will try that when it becomes publicly available.
- elastichosts.com in the UK has announced cloud computing based virtual servers starting at US$48 per month for a Windows server (but they have repeatedly postponed their public start)
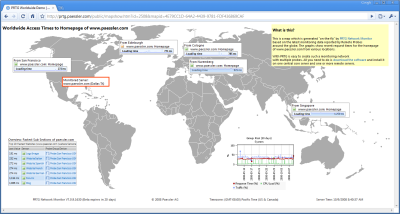
Sample Graph 1: Live Map of Request Times of www.paessler.com
This map from PRTG shows graphs with recent measurements of HTTP requests to the homepage of www.paessler.com (located in Dallas, TX) reported by our probes in Cologne, Nuremberg, San Francisco, Singapore and Edinburgh.
Sample Graph 2: Historic Graph
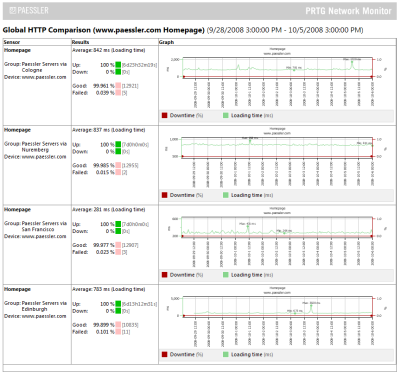
The following report from PRTG shows graphs with the hourly averages for HTTP requests to the homepage of www.paessler.com (located in Dallas, TX) reported by our probes in Cologne, Nuremberg, San Francisco and Edinburgh during the month of September. It is interesting to see that despite the fact that all probes run on virtual systems, in the long run the measured values are quite constant. Regarding uptime measurements all probes have the same result of 100%. Click the image to zoom in!
Sample Graph 3: Live Data Tables of Request Times
Another sample is this public map from PRTG that shows the download times for some URLs on our servers from the different locations.
 Published by
