.jpg) Published by Jasmin Kahriman
Published by Jasmin Kahriman
Last updated on January 23, 2024
•
9 minute read
Most of today's virtualization environments are powered by VMware. It just works, it is stable, reliable, scalable and powerful. Besides the proper architecture design and configuration, it is also important to keep an eye on performance, from the physical layer up to the virtual machines and hosted apps. PRTG is an all-in-one solution that can help you to monitor your physical servers, VMware, datastore, network cards, virtual machines, guest operating systems, and much more. The best practice is to start monitoring from physical servers, so you know that the underlying hardware is working properly. For this, I recommend my article, Track the health status of physical servers via iDRAC, iLO, iRMC and IMM.
PRTG has six native sensors you can use to monitor host hardware, datastore, and virtual machines. It uses WBEM (Web-Based Enterprise Management), SOAP (Simple Object Access Protocol), and Rest API to collect metrics and display them within sensors. If you are not familiar with the PRTG sensor concept, check this link.
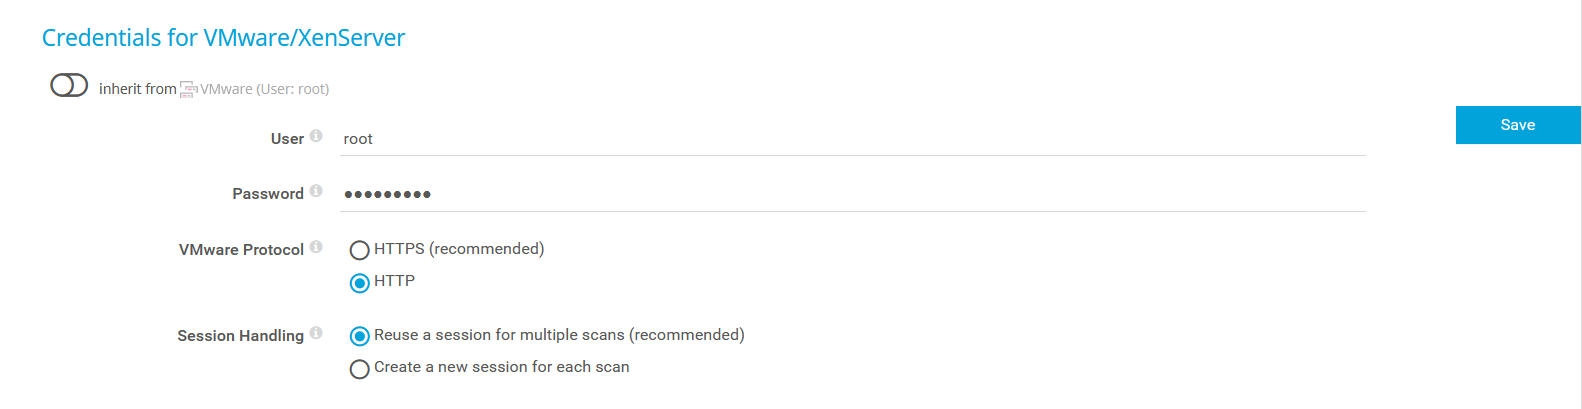
All the sensors, excluding the Dell EMC Unity VMware Datastore v2 Sensor, require VMware ESXi server version 5.2 or later and .NET Framework 4.7.2 or later on the probe system (not relevant to the WBEM sensor). All six sensors support IPv4 and IPv6. Native VMware sensors require credentials for VMware in the settings of the parent device. Ensure that you enter a user with sufficient access rights to obtain statistics (read-only usually works). You can add credentials under Your VMWare ESXi > Settings > Credentials for VMware/XenServer.
Monitoring a VMware host
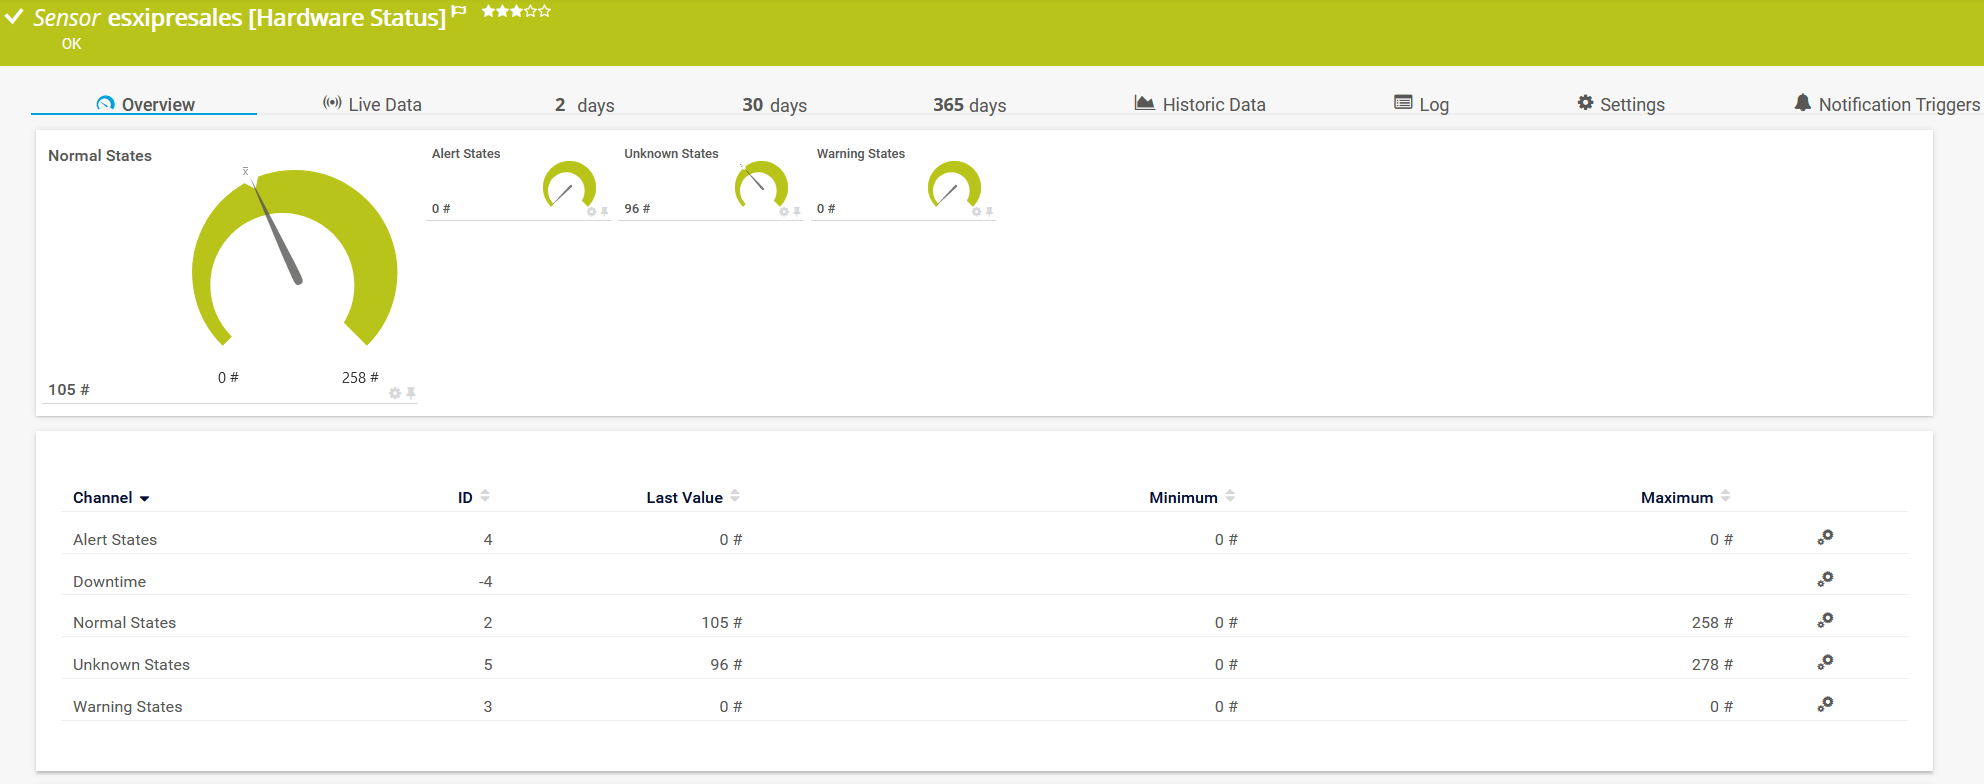
There are in total three native sensors you can use to monitor your host. The VMware Host Hardware Status (SOAP) sensor monitors the hardware status of a VMware host server using the Simple Object Access Protocol (SOAP). It gives you a general status overview of the host by showing alerts as well as normal, unknown, and warning states. It shows the same information as when you navigate to ESXi health state in vSphere Client or vCenter.
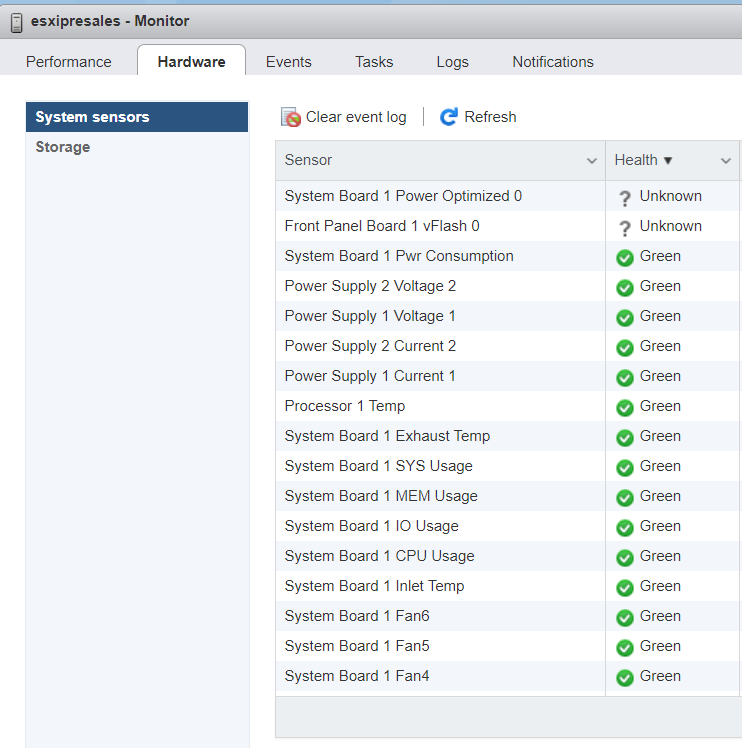
The sensor output looks as shown below. In case any hardware component fails, this sensor will go into a warning or down state.
Memory usage, ESXi temperature monitoring and more: The Vmware Host Hardware (WBEM) sensor
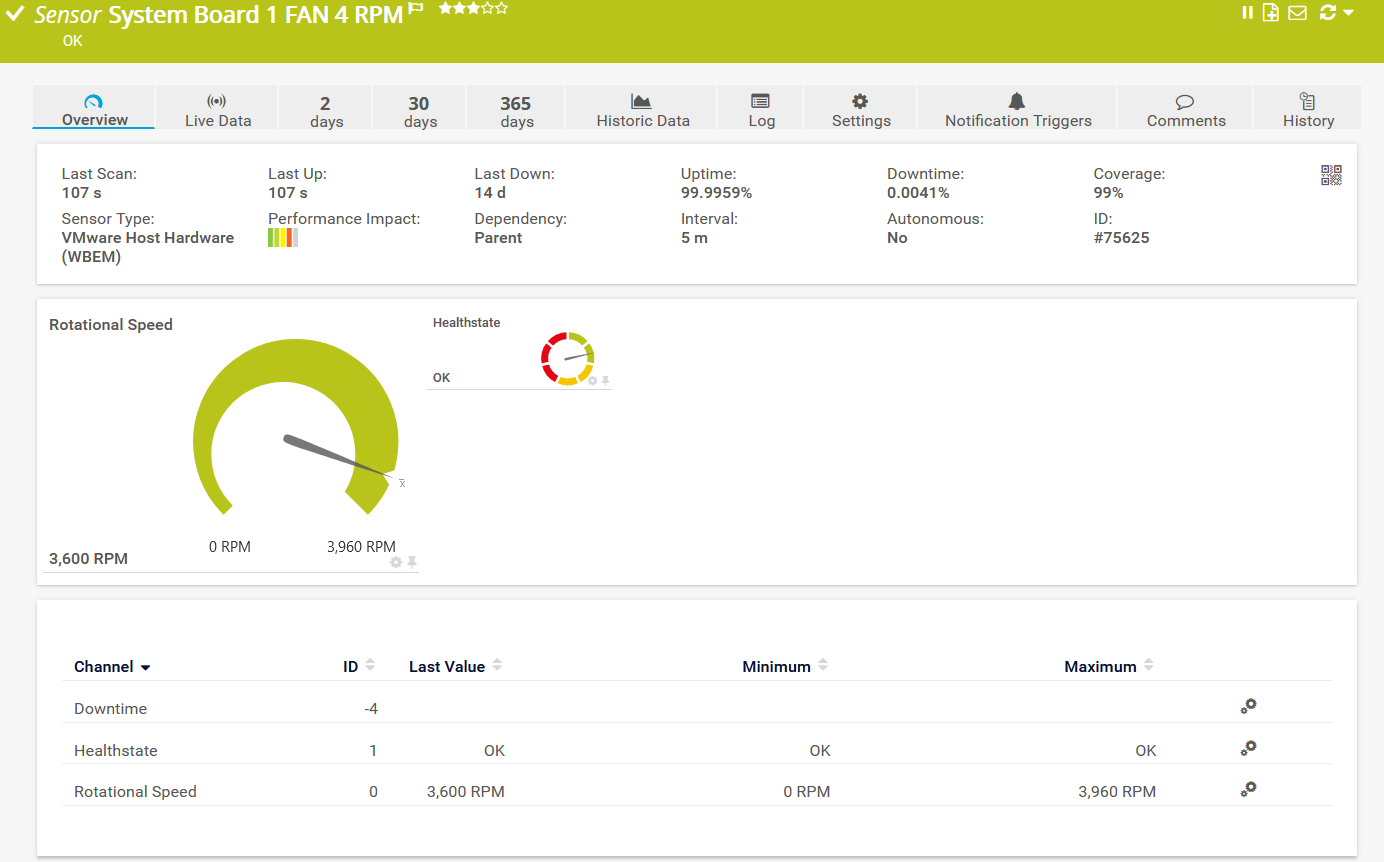
The VMware Host Hardware (WBEM) sensor monitors information about the hardware of an ESXi server using Web-based Enterprise Management (WBEM). Once you add this sensor, it will do a meta scan to detect available hardware elements such as system board power consumption, inlet and exhaust temperature, power supply status, system usage, memory usage, IO usage, CPU usage, and fan status. PRTG creates one sensor for each element that you select. This sensor requires that the CIM interface is enabled on the ESXi host.
On ESXi 6.5 and later, you have to manually enable CIM. This sensor uses lookups to determine the status values of one or more channels. This means that possible states are defined in a lookup file. You can change the behavior of a channel by editing the lookup file that the channel uses. For details, see the section Define Lookups in our user manual. In the screenshot below, you can see a sensor that monitors fan RPM.
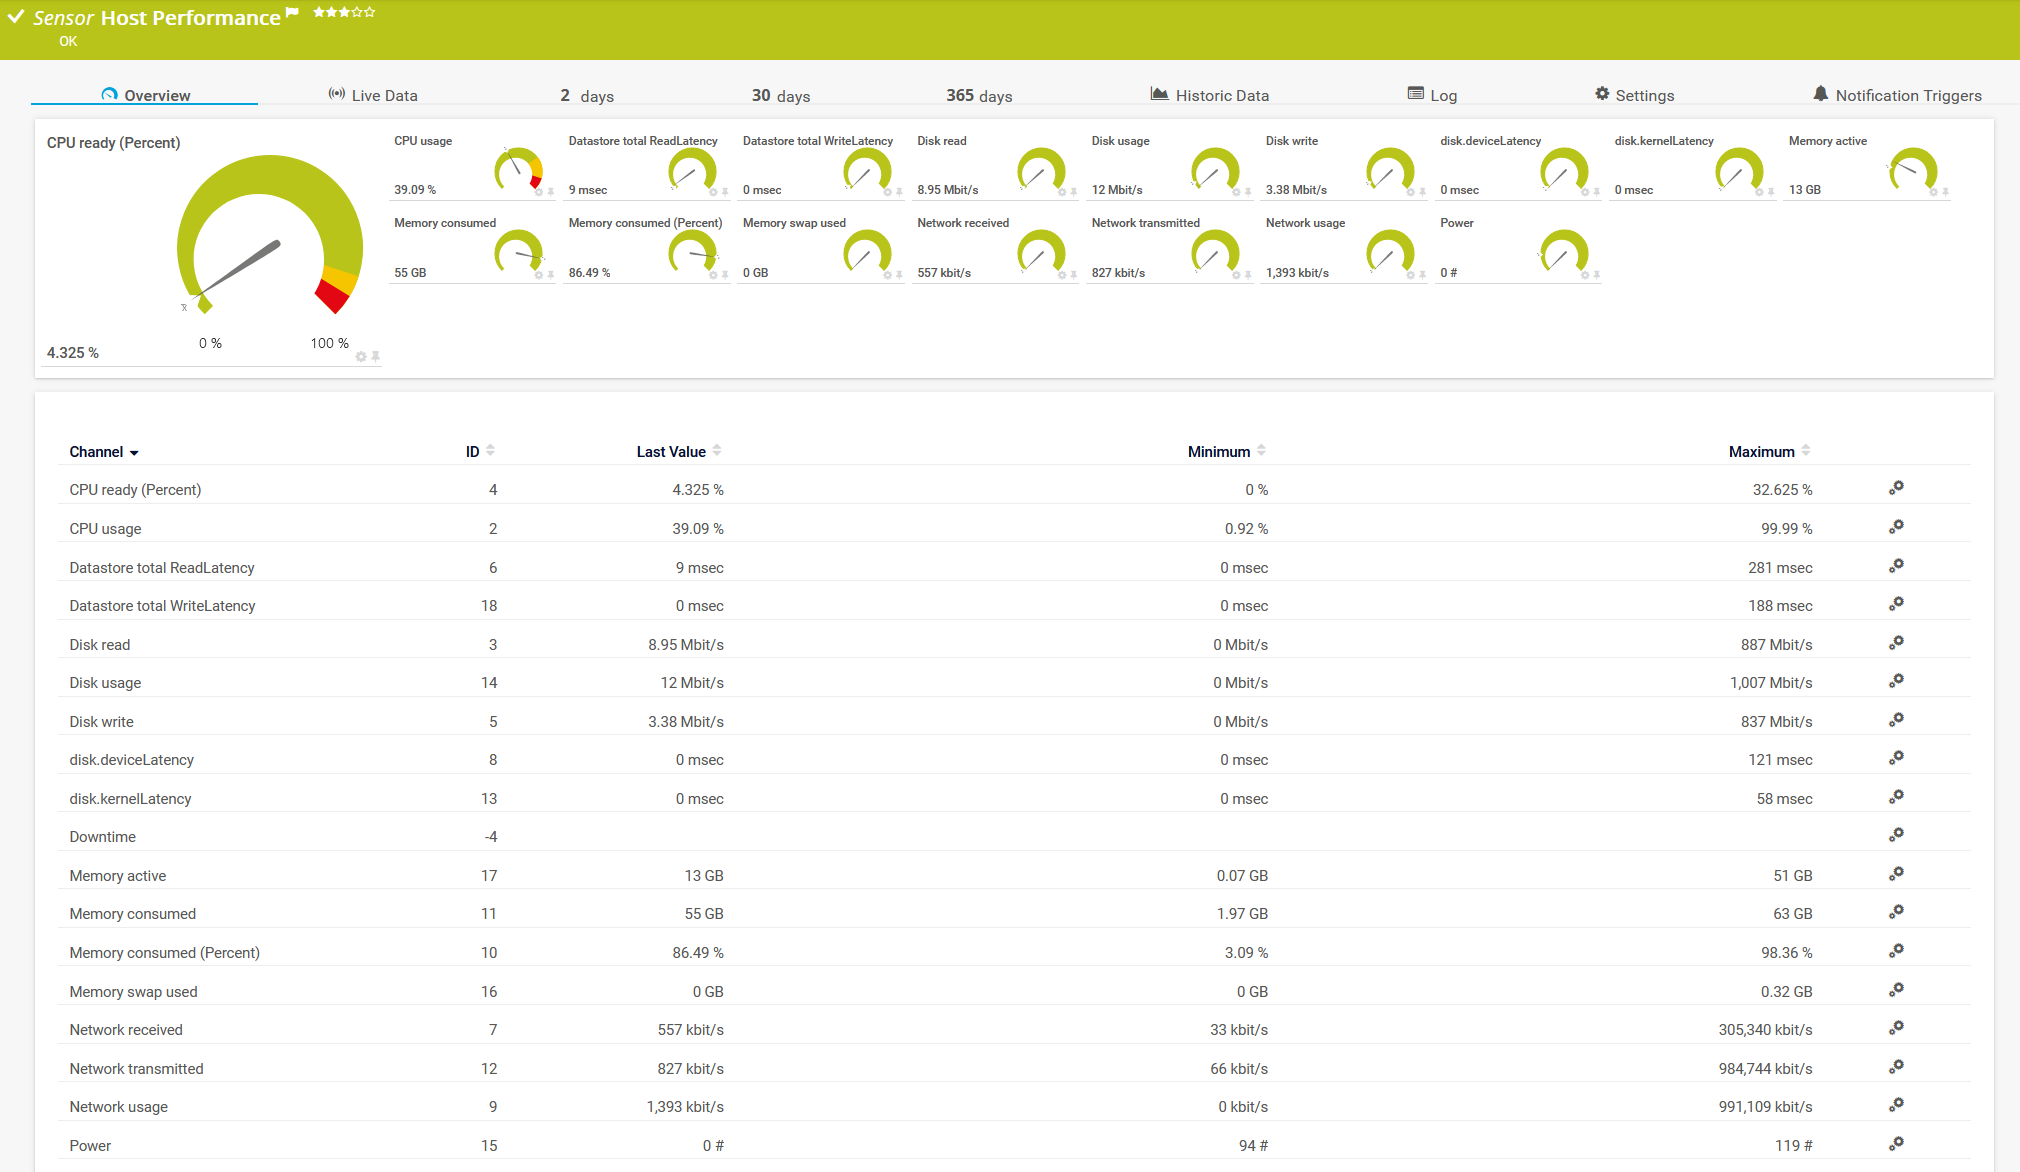
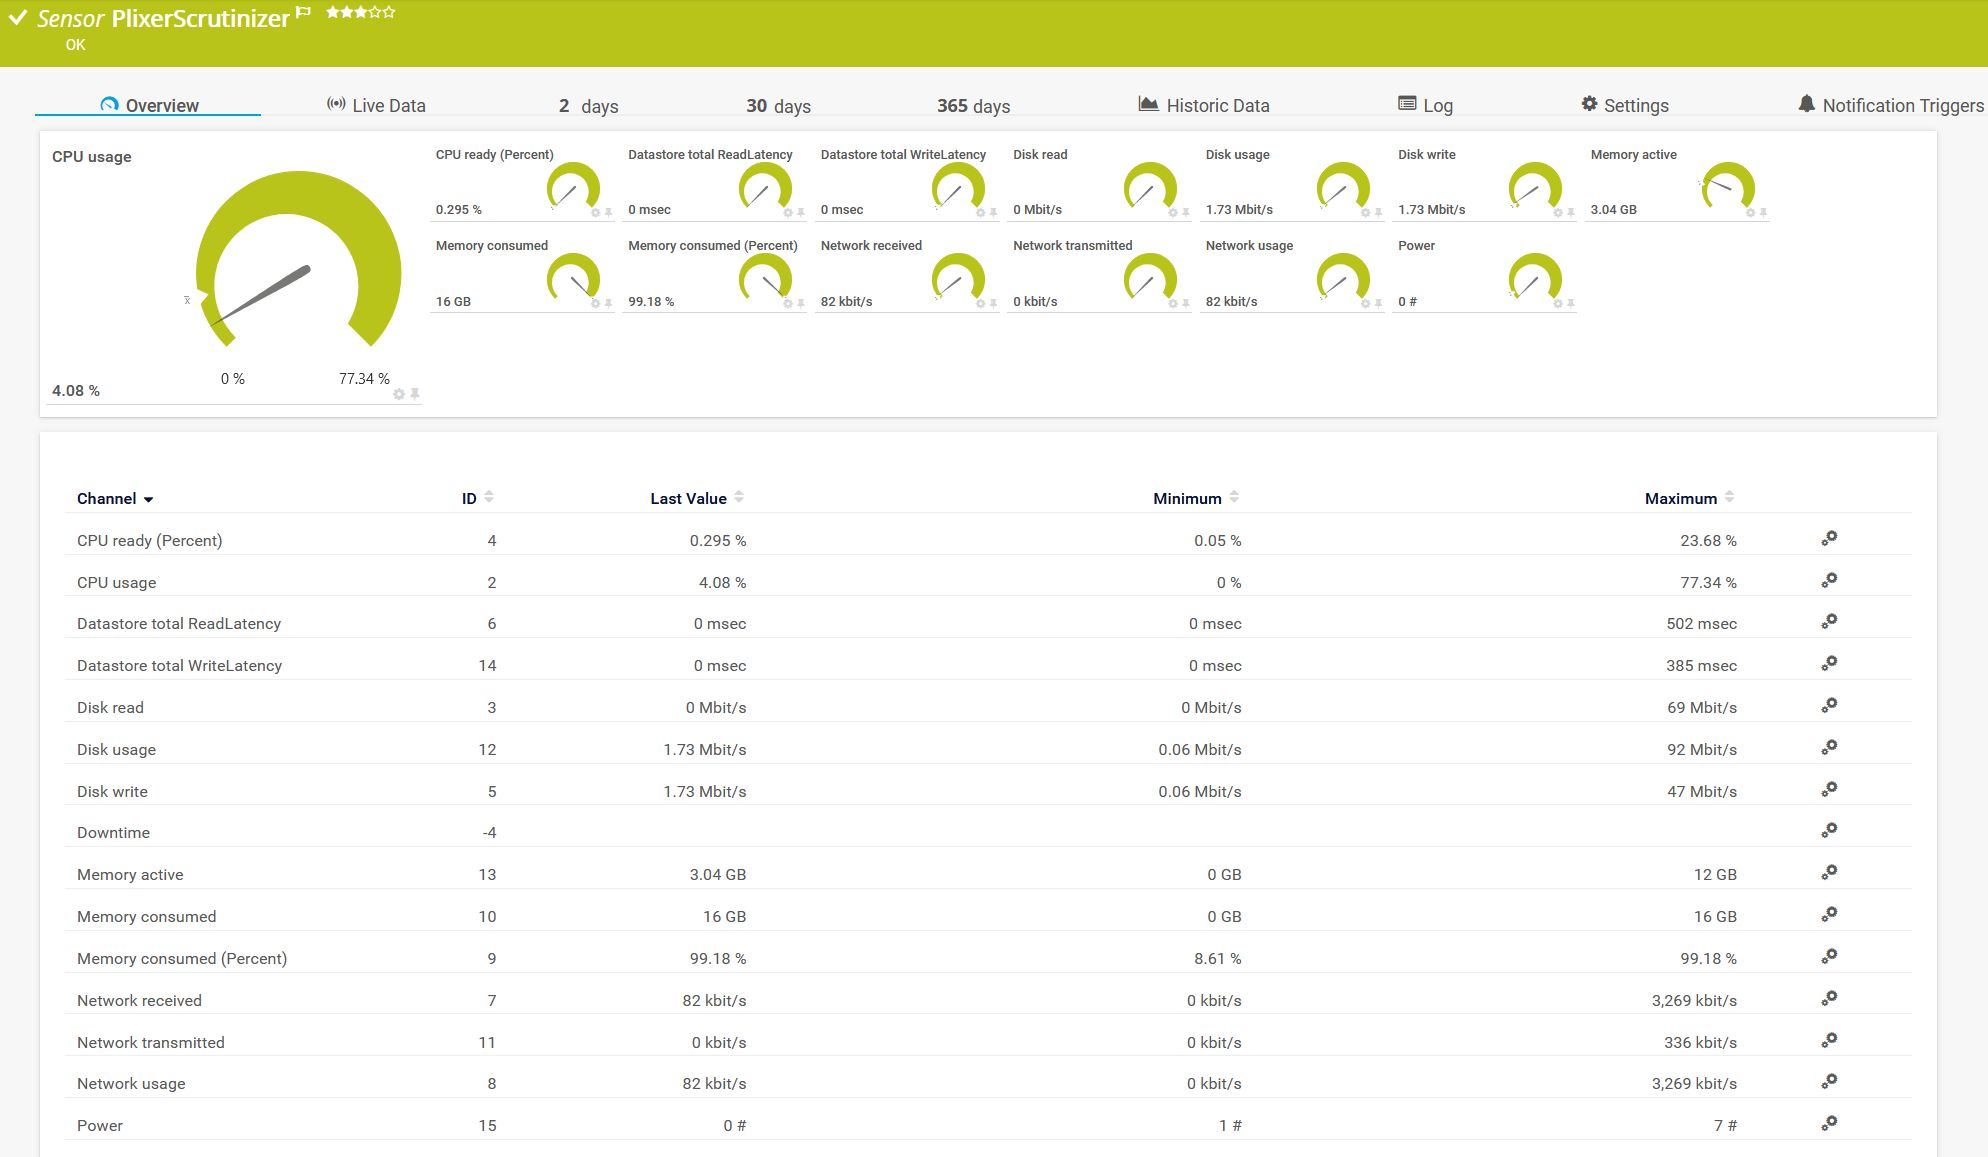
The VMware Host Performance (SOAP) sensor monitors a VMware host server using the Simple Object Access Protocol (SOAP). It shows the following metrics from the host level: CPU utilization, datastore read and write latency, disk utilization, memory utilization, network usage, and power.
Monitoring a VMware datastore
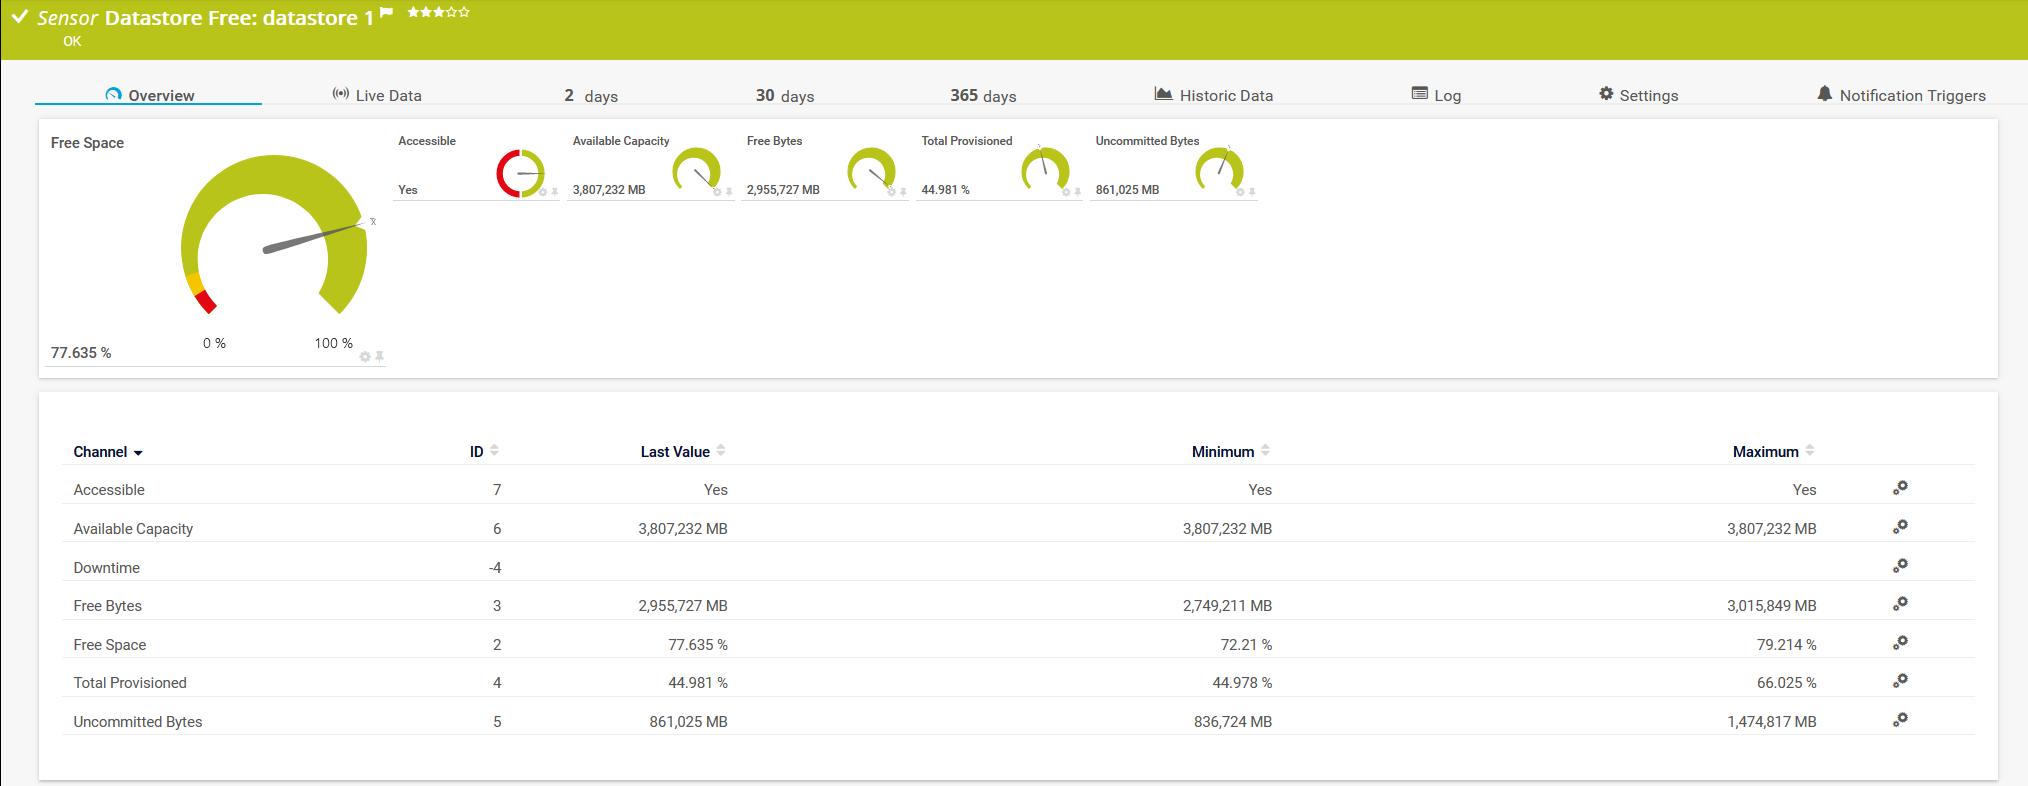
There are two native sensors for monitoring the datastore: VMware Datastore (SOAP) sensor, and Dell EMC Unity VMware Datastore v2 sensor. The VMware Datastore (SOAP) sensor monitors the disk usage of a VMware datastore using the Simple Object Access Protocol (SOAP). This sensor type shows datastore accessibility, available capacity and free space, total provisioned space, and uncommitted bytes.
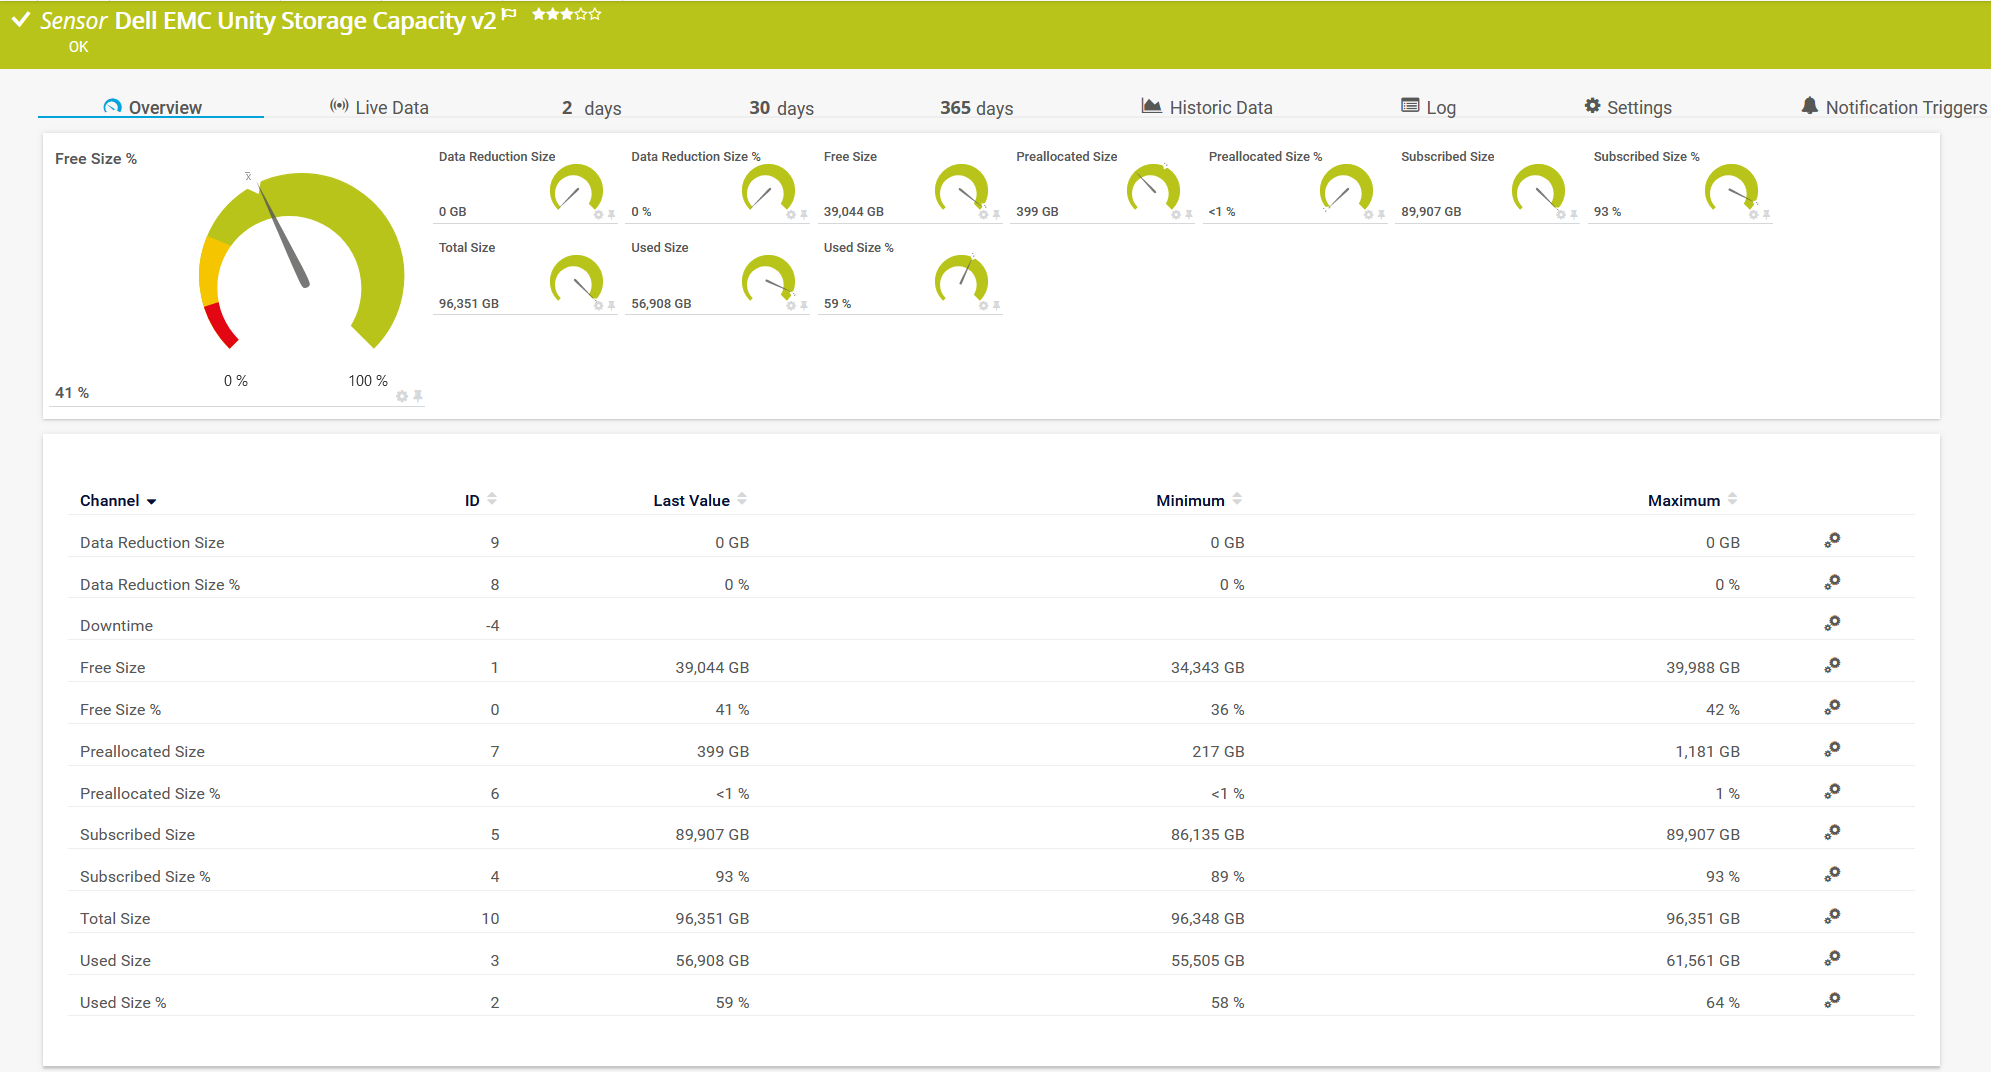
If your datastore is hosted on Dell EMC Unity storage, you can monitor it via REST API using the Dell EMC Unity VMware Datastore v2 sensor. This sensor only supports systems from the Dell EMC Unity family with Unity OE 5.x. It requires credentials for Dell EMC in settings that are higher in the object hierarchy, for example, in the settings of the parent device (Settings > Credentials for Dell EMC). This sensor shows data reduction size, free size, pre-allocated size, subscribed size, total and used size.
Monitoring VMware VMs
The VMware Virtual Machine (SOAP) sensor monitors a virtual machine (VM) on a VMware host server using the Simple Object Access Protocol (SOAP). It shows metrics about CPU usage, datastore and disk usage, memory consumption, network transmission and power. All metrics are related to VM from a VMware perspective, and not the guest operating system. If you want to monitor your guest operating system, you can do it by using WMI and SNMP for Windows and SNMP and SSH for Linux.
3rd party PowerShell scripts
Besides native VMware sensors, PRTG gives you the flexibility to create your own scripts and use them in combination with custom PRTG sensors. Thanks to our customer Jannos-443, we can extend monitoring to VMware status, alerts, and snapshots. Once you download the scripts, you should add them to the corresponding \Custom Sensors\EXE subfolder of the PRTG program directory on the probe system and add them to PRTG by using EXE/Script Advanced sensor.
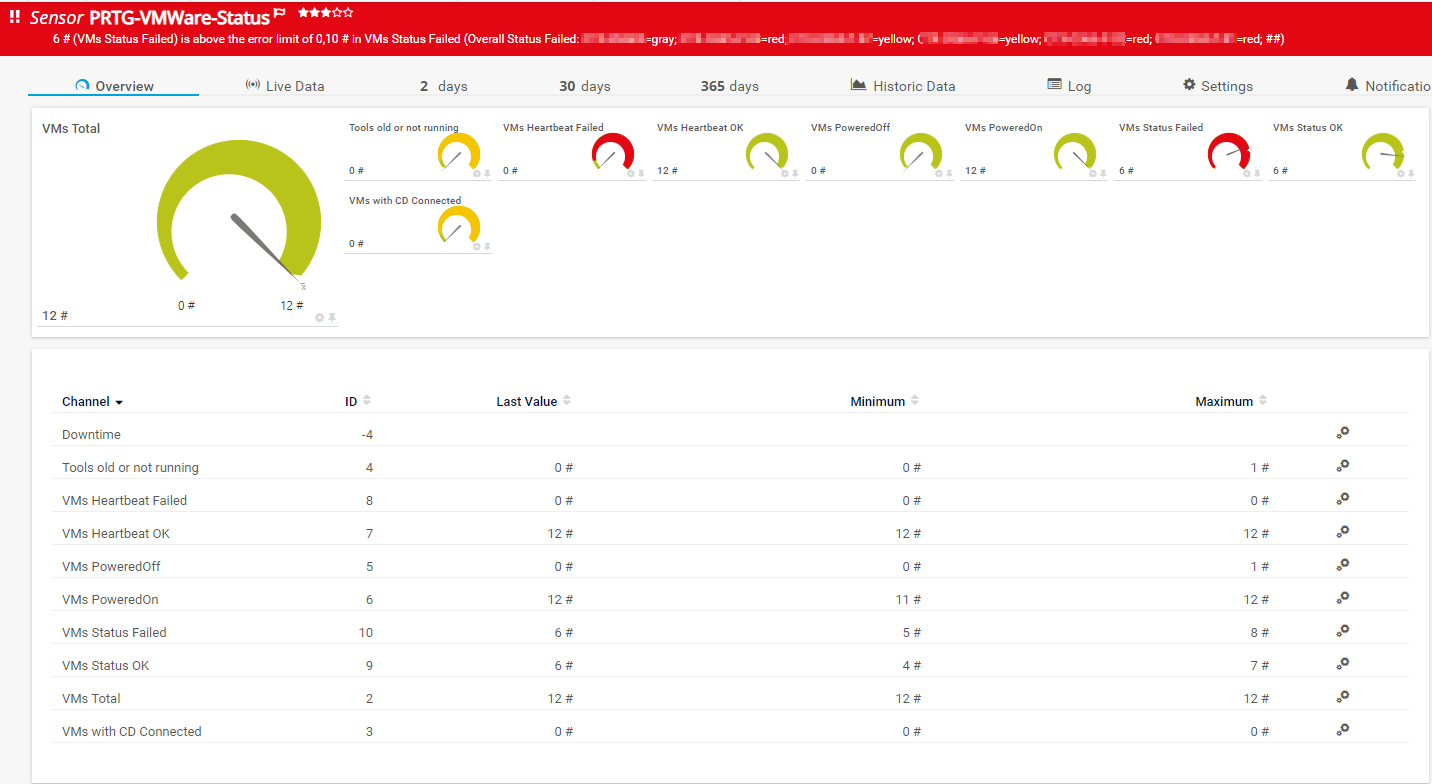
The PRTG-VMWare-Status script checks VMware VM Status, for example VMware Tools, Heartbeat, CDDrive Connected and Overall State. Get more instructions here.
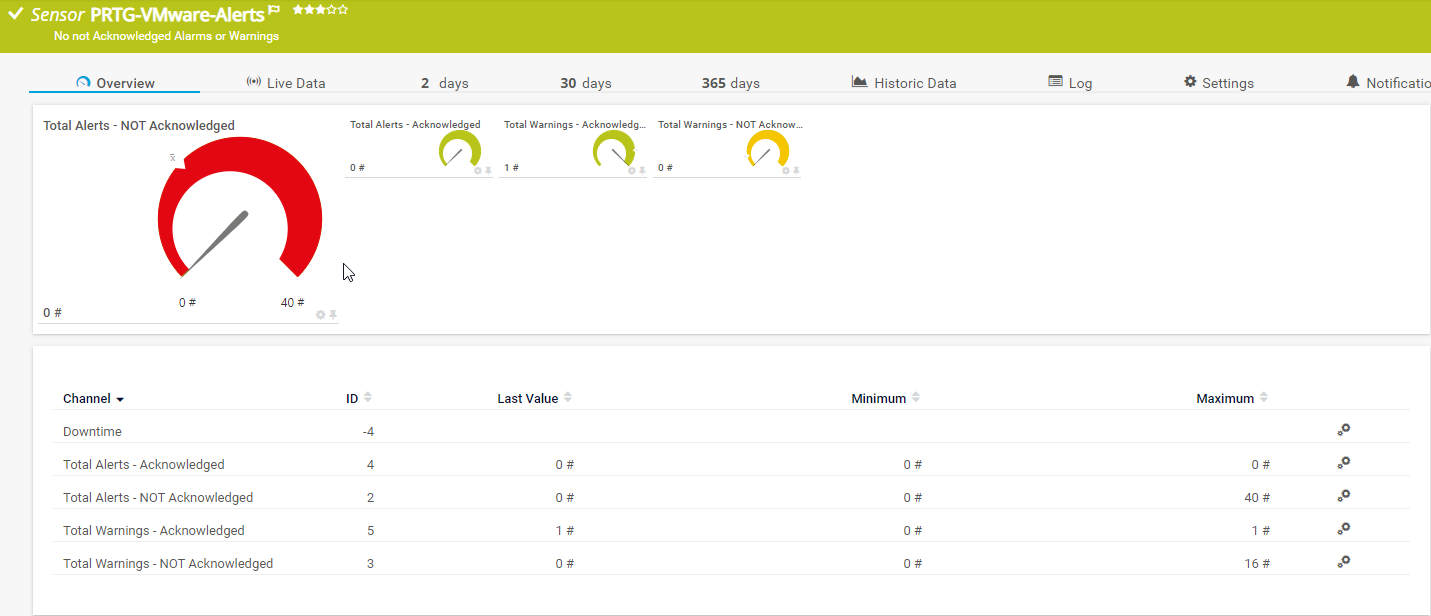
The PRTG-VMWare-Alerts script checks VMware Alerts and Warnings. Get more instructions here.
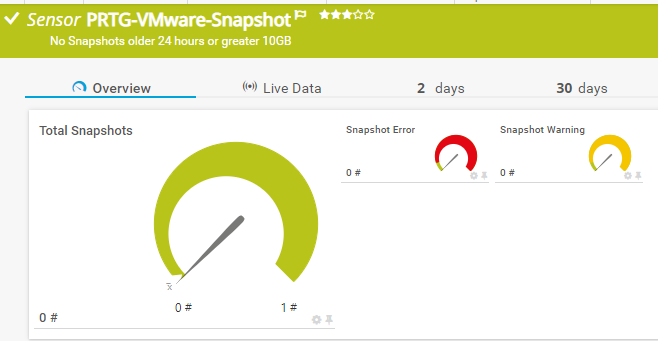
PRTG-VMware-Snapshot monitors snapshots with specific Age or Size. Get more instructions here.
That was all for now for VMware ESXi monitoring. I hope you found this article useful. I'm curious to learn more about how you monitor your VMware ESXi environment - let me know in the comments!


