 Published by Michael Becker
Last updated on April 11, 2022
•
7 minute read
Welcome to the second part of this blog series where I show you 15 things about PRTG that can make your everyday use of PRTG easier. If you missed the first part, which was about topics like ticketing system, libraries, viewing sensors by label or type, and tracking changes, I recommend you take a look here:
👉 15 things that make it easier for you to use PRTG (Part 1/3)
Today I will show you 5 more interesting features and functions of Paessler PRTG that you may not know about. Here we go!

- Maintenance & sensors available
- Users logged in
- Own scan intervals
- Historic sensor data
- Personal start page
6. Overview of maintenance and sensors available
It is always important to know when a maintenance contract ends in order to extend it in time to benefit from the full scope of a software. In PRTG you can find this information on the default home page of the web interface. However, since this welcome page can be changed at any time for each individual user (more on this later), this source of information is often forgotten.
On this page you will also find other useful information such as the number of sensors still available, an overview of the status of all sensors and our latest blog articles. 😉
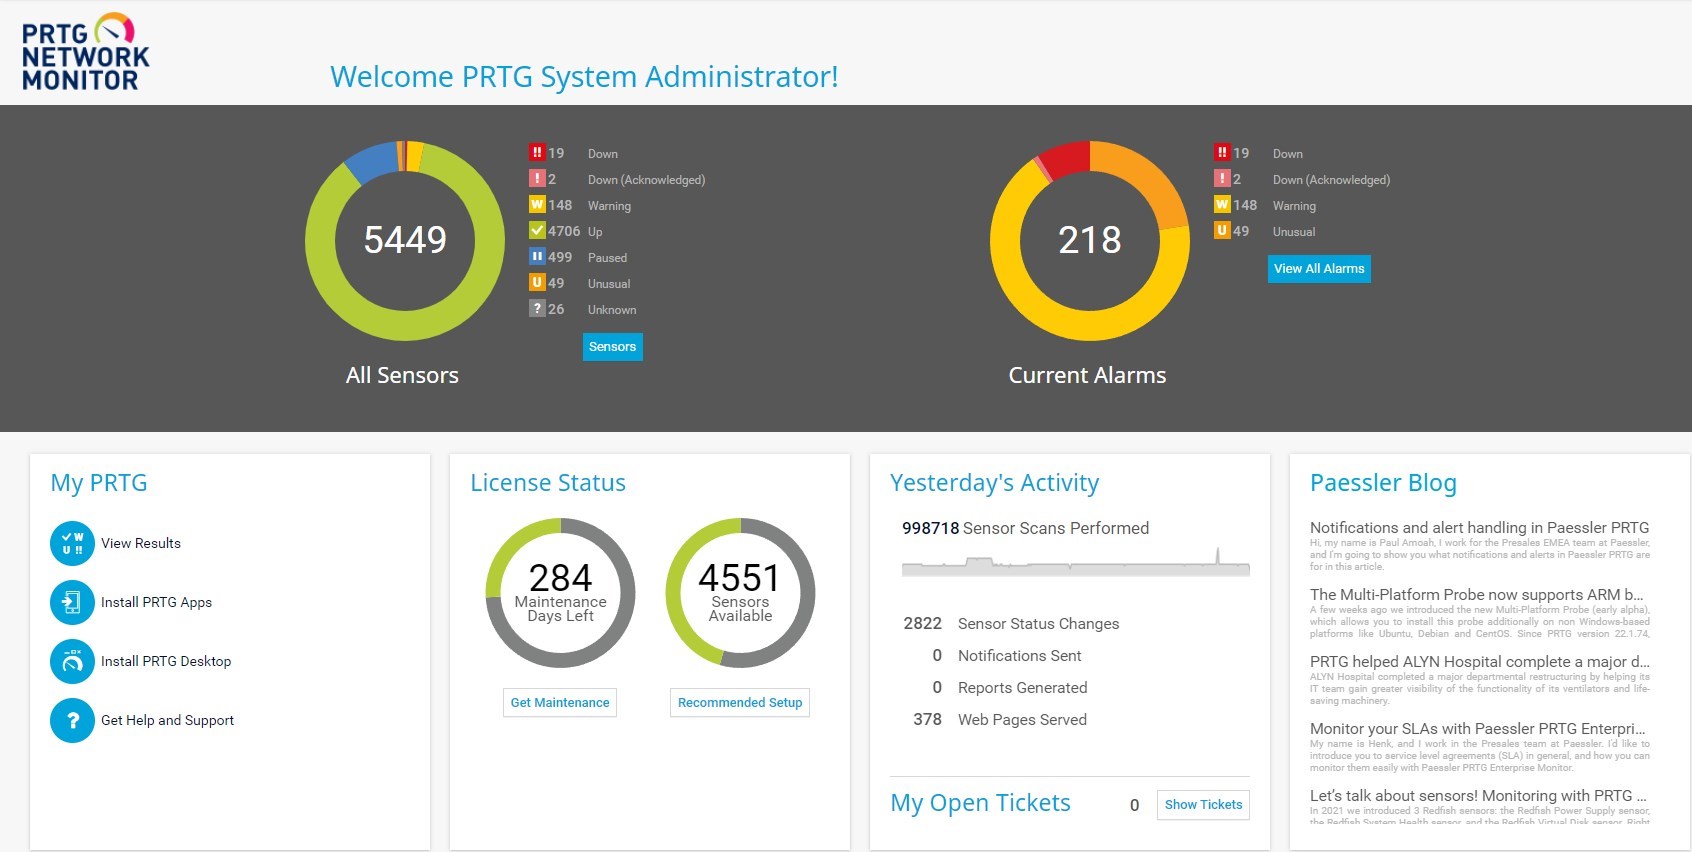
You can access this page by hovering your mouse over "Home" and then clicking on "Welcome to PRTG".
7. Show all users currently logged in to PRTG
In addition to a lot of other information* about your PRTG instance, you can also find information about the currently active user sessions on the System Status page. This information can be important, for example, if the underlying server needs to be restarted due to pending updates. This way you can see at a glance who might need to be notified about this.
To access this page, hover your mouse over "Setup" and then click on "PRTG Status":
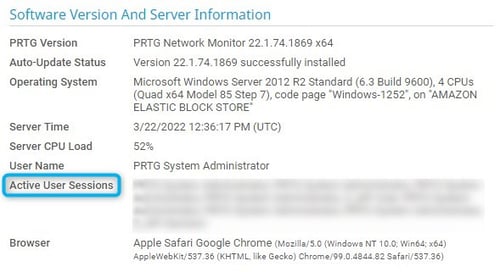
*On the System Status page you will also find all sensors used, sorted by scan interval. This information can help you to improve the performance of your PRTG installation.

8. Define your own scan intervals
As just mentioned, the scanning interval plays a major role in the performance of a PRTG instance. For example, there are sensors for which a more frequent update is more important than for other sensors. To configure PRTG in the best possible way and individually, you also have the option to create predefined scan intervals yourself.
To do this move the mouse over "Setup", then "System Administration" and click on "Monitoring":
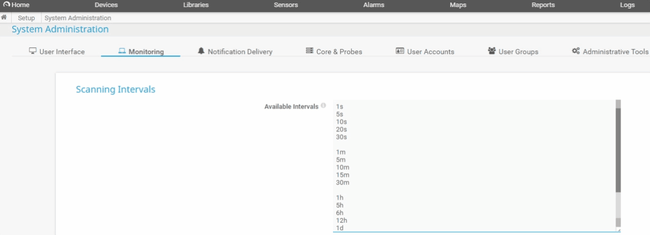
Now enter the desired interval in the list. Use the characters 's', 'm', 'h', and 'd' to define seconds, minutes, hours, and days as units for an interval number.
If you'd like to know more about scanning intervals please have a look at this page:
👉 How to set up scanning intervals of sensors in 3 steps
Tip: If you want to change the scanning interval for all deployed sensors of a specific type, please have a look here: "How do I change scanning interval for all deployed servers of a specific sensor type?"
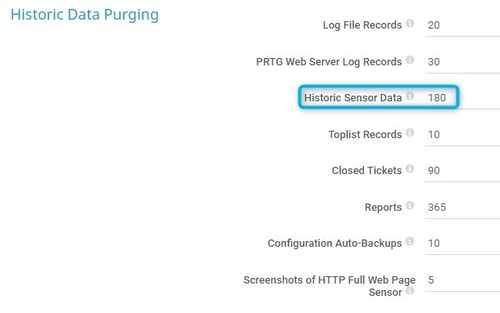
9. Historic sensor data
PRTG stores historical sensor data for 180 days by default which are the basis for reports. If you want to extend this period, for example to be able to create reports that covers an entire year, you can change this value. (Of course, you can also reduce this value.) Please have a look here for more details about historic data:
To change this setting, hover over "Setup", then "System Administration", and click on "Core & Probes". At the bottom of this page you will find the item "Historic Sensor Data":
10. Define your personal start page
As mentioned above, every PRTG user can define an individual start page after logging in. This can be, for example, a dashboard, your assigned tickets, or even a single sensor. Basically, every view in PRTG can be defined as a individual start page.
For example, if you want to see the device tree directly after logging in, right-click on the page and select "Make This My Homepage" from the context menu:
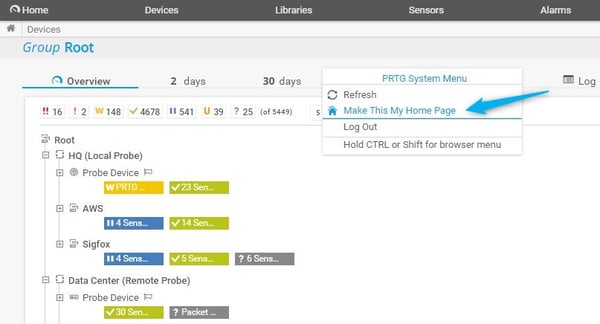
Alternatively, you can hover your mouse over "Home" on any page and select "Make This My Homepage".
Including the first article of this series, these are now 10 things in PRTG you should know about. This time, I hope to have shown you features and functions you weren't aware of yet. The third and last part of this series will cover topics like comments, notifications and navigation in PRTG. Stay tuned!
Did you find this helpful? We look forward to your comment!


