 Published by Michael Becker
Last updated on April 04, 2022
•
7 minute read
Paessler PRTG is powerful monitoring software that allows you to monitor your IT infrastructure holistically. In addition to reliable notifications through various channels, the ability to create meaningful maps and more than 250 native sensor types, PRTG also offers a variety of other features and functions. In this three-part series, I will show you 15 things in PRTG that you should know and that can make daily use easier. Here's what I'm covering in the first article:
Let's start!
1. Ticketing system
Paessler PRTG includes its own ticketing system, which could also be considered a process flow for alarms. A ticket includes information about recent events in your PRTG installation that need a closer look. Each ticket is a task for a particular user or user group and has a unique ID, a priority, and a status. You can open, resolve, or close a ticket.
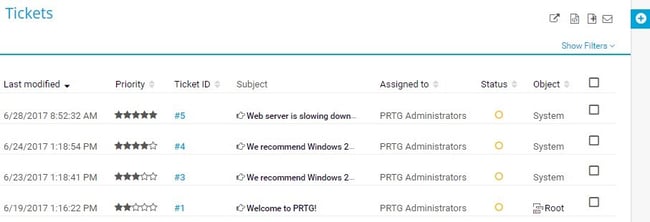
PRTG automatically creates tickets – for example, when auto-discovery has completed – and you can create tickets for every kind of issue as well. In addition, you can set up notifications that open a ticket when an issue occurs. The tickets can be used to keep track of all network-related issues by following the status of a problem and its resolution. Each ticket reports on one particular problem, its status, the steps that were taken to solve it, and which people were involved in resolving it.
Have a look at the following links for more information:
2. Libraries - your custom device tree
With libraries, you can create custom device tree views of your network's status and monitoring data. PRTG updates these views in the same interval as your device tree. The library views display the same monitoring data, but arranged the way you want, for example, based on target groups or a specific use case.
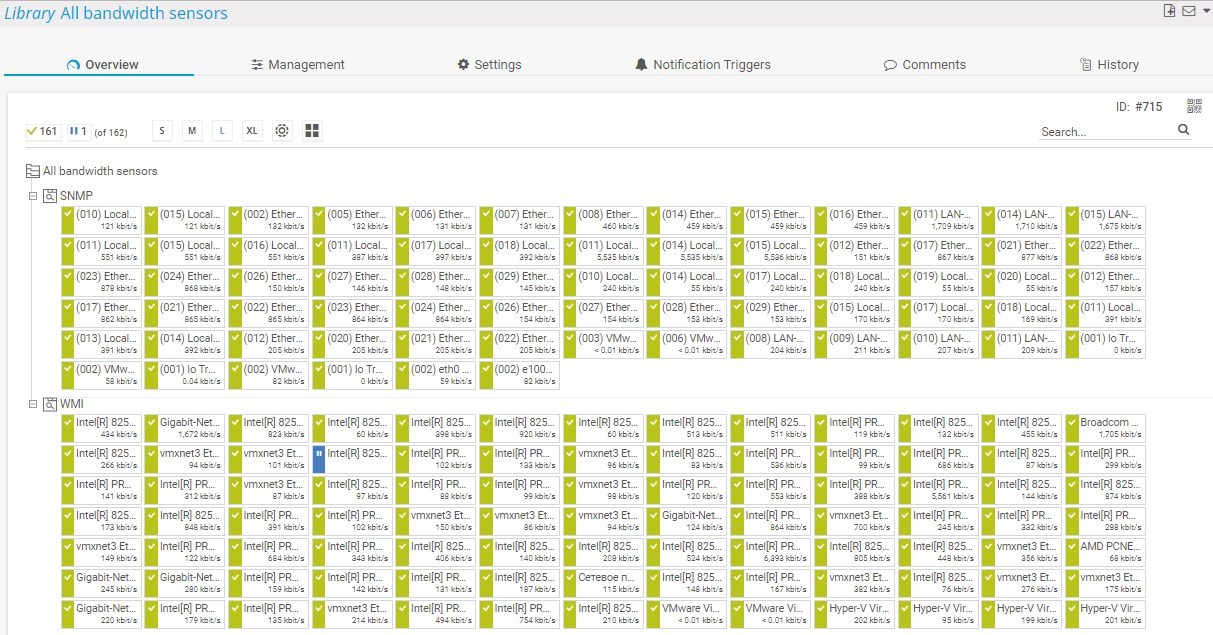
You could also create a library that contains an overview of all your bandwidth monitoring sensors, regardless of the device that they run on. Or you can set up notifications based on a library that differ from the notifications that you previously created for specific sensors.
If you'd like to know more about libraries in PRTG, have a look here:
👉 How to: Use Libraries in 4 steps
3. Show sensors by tag
You can define tags in the object settings for every object in your PRTG instance to categorize them. Although some tags are predefined when you add objects, you can add further tags. For example, you can mark all bandwidth sensors that are especially important for you with the tag bandwidthimportant.
To display all sensors with a specific label, hover the mouse over Sensors --> By Tag and then click on the desired (alphabetically sorted) tag:
We have summarized all information about tags on this page:
4. Show sensors by type
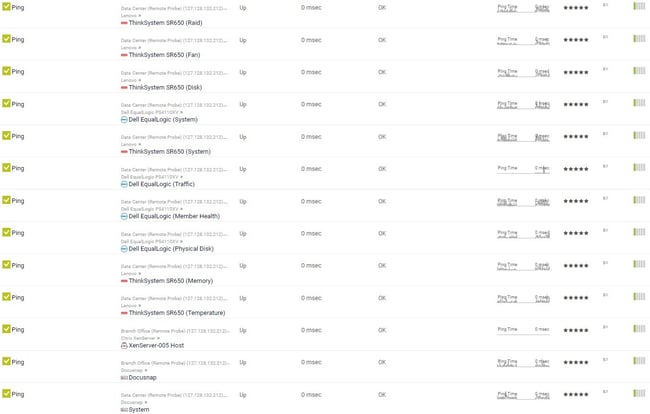
Similar to displaying sensors by tag, PRTG also gives you the option to display all sensors of a certain type. Since there are over 250 different sensor types, this is an easy way to display them in one overview. For example, you can display all ping sensors at once to quickly get an overview of the general availability of devices in your network.
To display all sensors of a specific type, hover the mouse over Sensors --> By Type and then click on the desired (alphabetically sorted) type.
5. Tracking of changes applied to objects
Especially in larger IT teams, it is important to be able to track changes. In PRTG, changes to sensors, devices or even probe devices can be easily viewed using the history. The following example shows the changes made to a ping sensor:
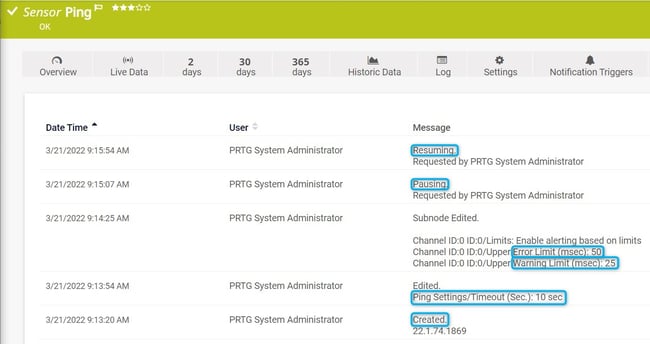
- The sensor was created
- The timeout setting was changed to 10 sec.
- The limits for warning and error state were defined
- The sensor was paused
- The sensor was resumed
Similar to this example, you can view and track all changes in PRTG using the history function. To do this, first select the object (sensor, device, group, probe) in PRTG and then click on History in the page header bar.
By using the API you would also be able to export the history of a device to XML.
👉 Knowledge base: Report for tracking system changes
This was the first part of this blog series. I hope you got some interesting information from it. The next part will be about historical data in PRTG and logged in users, among other things.
As always, we are happy to read your comments!


