To ensure the smooth operation of a data center, your first priority is to avoid errors and problems with the server hardware. In the age of virtualization, it is crucial to keep an eye on the hypervisors and to eliminate incipient problems before they lead to malfunctions or even failures - regardless of which manufacturer your server hardware is made by.
Hardware is the first layer of an IT infrastructure - if it fails, everything else fails, from servers to operating systems to applications and processes. Your hardware can fail at a variety of points, and that's why it's so important that it's monitored automatically.
PRTG scans and monitors all your hardware from manufacturers such as Dell, HPE, IBM and other well-known manufacturers. With a variety of notification options, no problem goes unnoticed, allowing you to act quickly in case of an emergency. Among other things, PRTG has numerous vendor-specific hardware sensors that include monitoring of system health as well as individual components. Here are the top sensors in PRTG to monitor your hardware from Dell, HPE and IBM:
Ping sensor
Hardware monitoring starts with a simple ping test. This is a simple way to check whether all servers are reachable. If the ping test fails, the server may be turned off, there may be a problem with a switch, or the error may be due to an unplugged or damaged cable. PRTG provides the Ping sensor and the Cloud Ping v2 sensor for this purpose.
System Uptime sensor
In addition to the accessibility of a server, its uptime is decisive. In terms of a network, uptime is defined by the availability and reliability of servers. Uptime is also almost always an important metric for SLAs. By using the SNMP System Uptime sensor, you can have the current, minimum and maximum uptime of your servers always in view.
Additionally, it is recommended to integrate this sensor into the reporting to document the availability of your servers.
CPU sensor
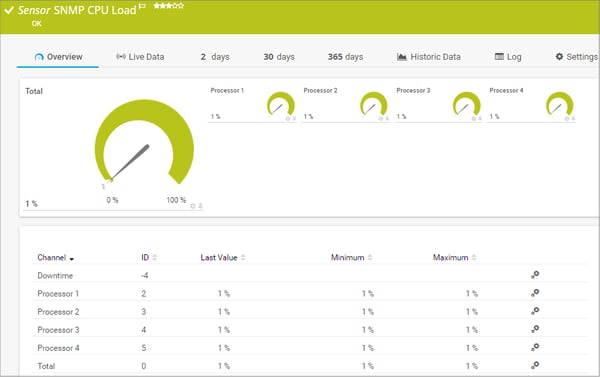
The heart of every server is its CPUs. A high load, caused for example by services or processes, usually has noticeable negative effects. Virtual servers or applications react sluggishly and in the worst case the server is no longer accessible. Monitoring of this component is therefore essential. The SNMP CPU Load sensor monitors the load of the processors of your servers and shows you where action is required.
Memory sensor
RAM also plays a crucial role in ensuring smooth operation. RAM Monitoring keeps a constant eye on the memory of all your systems. It helps identify resource-intensive applications and heavily loaded servers, because sometimes even the simplest applications can consume a lot of memory and impact overall server performance. The SNMP Memory sensor monitors the status of the RAM and the memory usage of a system.
Physical Disk sensor
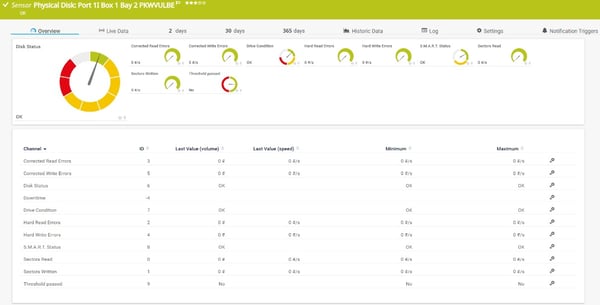
In addition to the information about the memory utilization of the hard disks, it is very important to be informed about the state of the individual physical hard disks. Nowadays, thanks to RAID, the failure of a single disk can be tolerated and is usually not a major problem, but in some cases it can have a significant impact. It is therefore advisable to monitor the status of individual hard disks. PRTG offers numerous manufacturer-specific sensors such as the SNMP HPE ProLiant Physical Disk sensor, the SNMP Dell PowerEdge Physical Disk sensor or the SNMP IBM System X Physical disk Sensor. There are also sensors available for storage systems.
Logical Disk sensor
Just as for monitoring individual physical disks, PRTG provides sensors for monitoring logical disks (also called logical volumes or virtual disks). Unlike a physical disk, a logical disk consists of multiple physical disks that, depending on the configuration, can prevent data loss if a single disk fails. With sensors like the SNMP HPE ProLiant Logical Disk sensor, the SNMP IBM System X Logical Disk sensor or the Dell PowerVault MDi Logical Disk sensor you can monitor not only the utilization but also the status of your logical disks.
Traffic sensor
Besides monitoring physical components of a server, of course, data traffic should not be ignored. The SNMP Traffic sensor not only informs you whether a port of the network card is connected or not, but also about the data traffic running through it. Network-intensive activities can thus be quickly identified, and bottlenecks made to be a thing of the past. In addition, the information from the sensor can be used to optimize network traffic.
System Health sensor
As well as individual native sensors for monitoring server components, PRTG includes additional system health sensors for hardware from well-known manufacturers. These sensors provide information in the channels about battery status, temperature, global system status or chassis status, for example. You can use the System Health Sensor for server hardware from Dell, HPE, IBM, among others, but also for devices from NetApp, Buffalo, Fujitsu, Lenovo and many more.
Redfish sensor
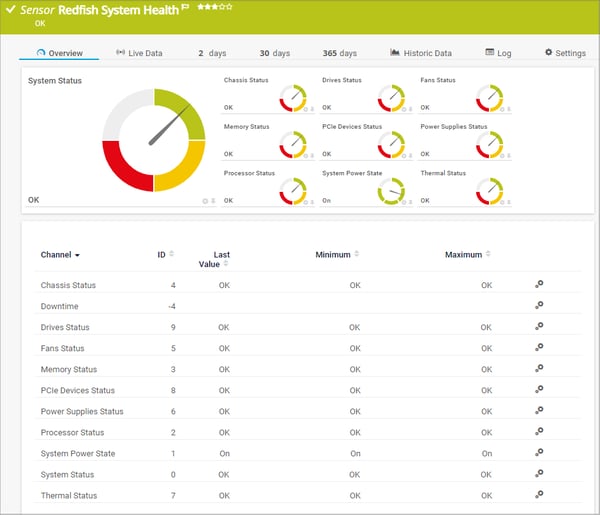
The Redfish Scalable Platforms Management API (Redfish for short) is a specification for remote maintenance of server systems via a REST-based software interface. Since Redfish is a standard protocol, it can be used by many server hardware vendors. With the Redfish System Health Sensor (EXPERIMENTAL) you can monitor server hardware even if PRTG does not provide a native sensor for this purpose. The channels of this sensor inform you about the status of fans, drives, PCIe devices, processor and many more. All this and more information about the Redfish System Health Sensor can be found here.
As you can see, there are numerous sensors you can use to monitor your server hardware. The sensors mentioned here are only a fraction of the sensors included in PRTG that you can use out-of-the-box. An overview of all available sensors can be found here.
If you want to know what new sensors we are currently working on and what we will be working on in the future, take a look at our roadmap. Here we also collect feedback through surveys, where you are welcome to tell us your opinion. And, as always, we always look forward to your comments below.
 Published by