.jpg) Published by Jasmin Kahriman
Published by Jasmin Kahriman
Last updated on January 23, 2024
•
6 minute read
In my previous article, I talked about bandwidth monitoring between the PRTG core server and remote probe, and I mentioned the possibility of monitoring the number of sensors on each probe system and visualizing them on the map. As promised, the goal of today's article is to show you how to do it.

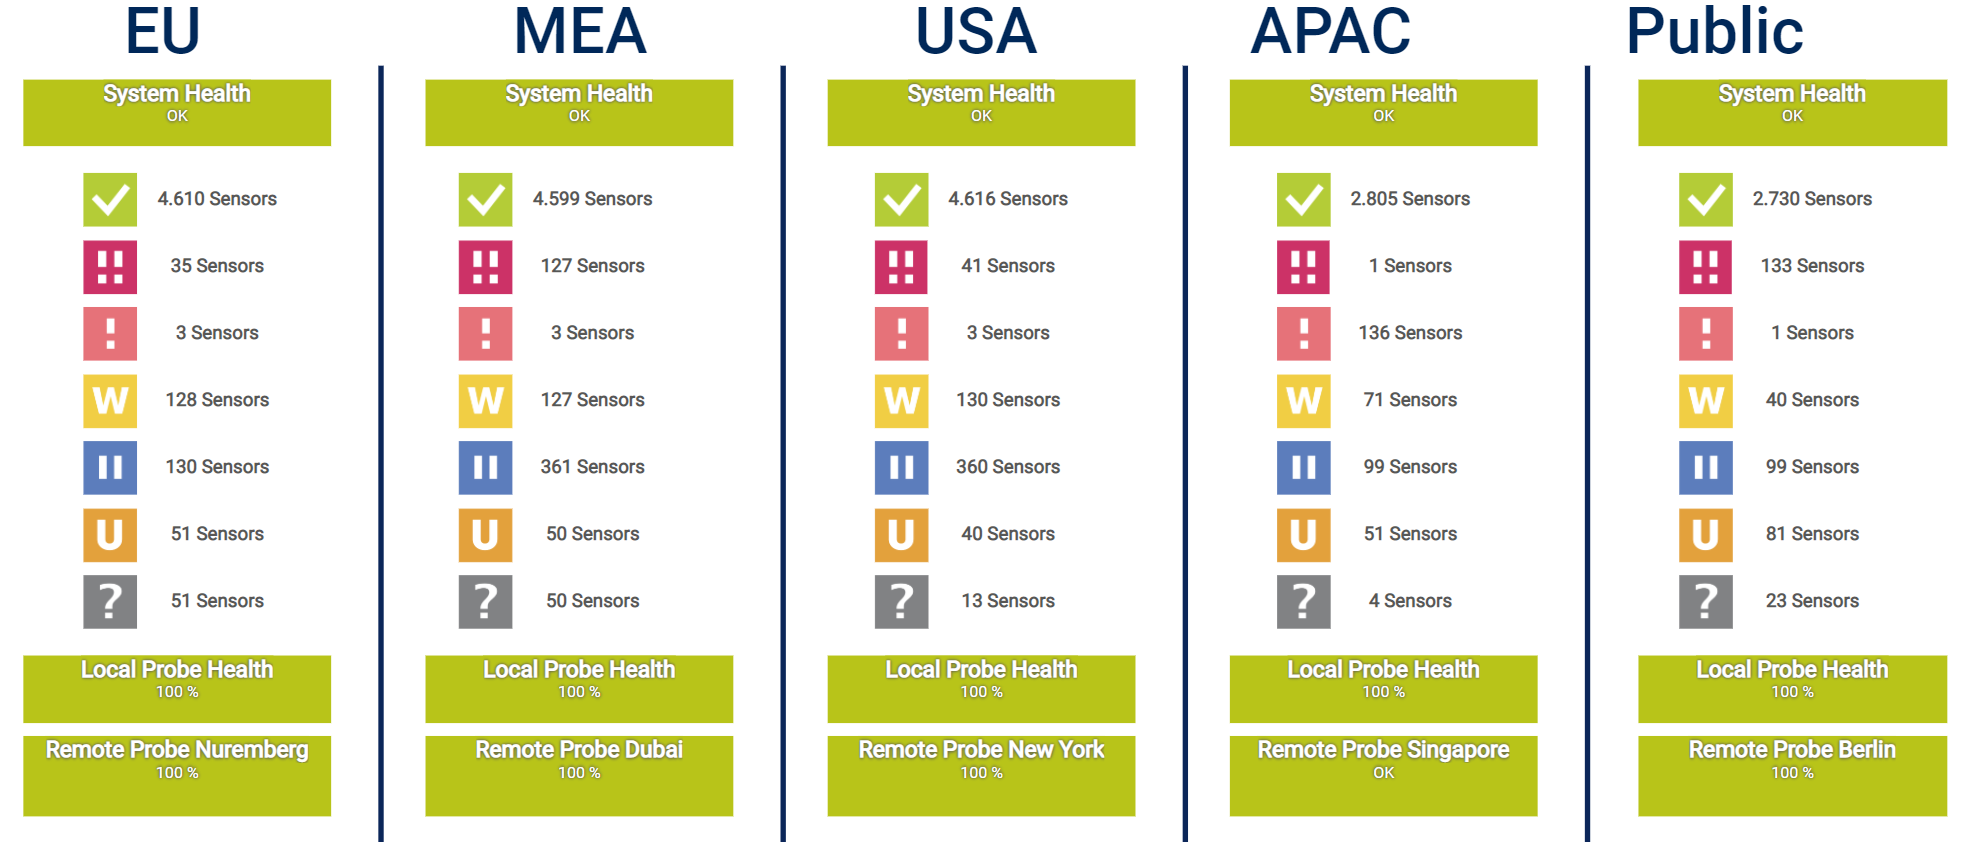
By using the PRTG map below, I keep an eye on the health of my PRTG instances; there are 5 PRTG core servers and 5 remote probes deployed in different regions. Besides checking the health of the core server and remote probes, you can also see the number of sensors in different states. This might also be interesting to you, especially if you are running several PRTG core servers and remotes probes in your company.
But, how to get there? Easy: by using either the REST Custom sensor for showing all sensor states, or the HTTP XML/REST Value sensor for showing all sensors with a specific state (e.g. paused sensors). Both sensors come out of the box with PRTG and can be deployed on any device in your device tree, but I suggest you do it on your probe system.
REST Custom sensor in action
The REST Custom sensor queries the PRTG API endpoint and maps the JSON or XML result to sensor values. The mapping rule has to be available as a REST configuration file in JSON template format (*.template) according to the PRTG API definition for custom sensors. In other words, by using REST Custom sensor and a REST template you can monitor the total amount of sensors in different sensor states.
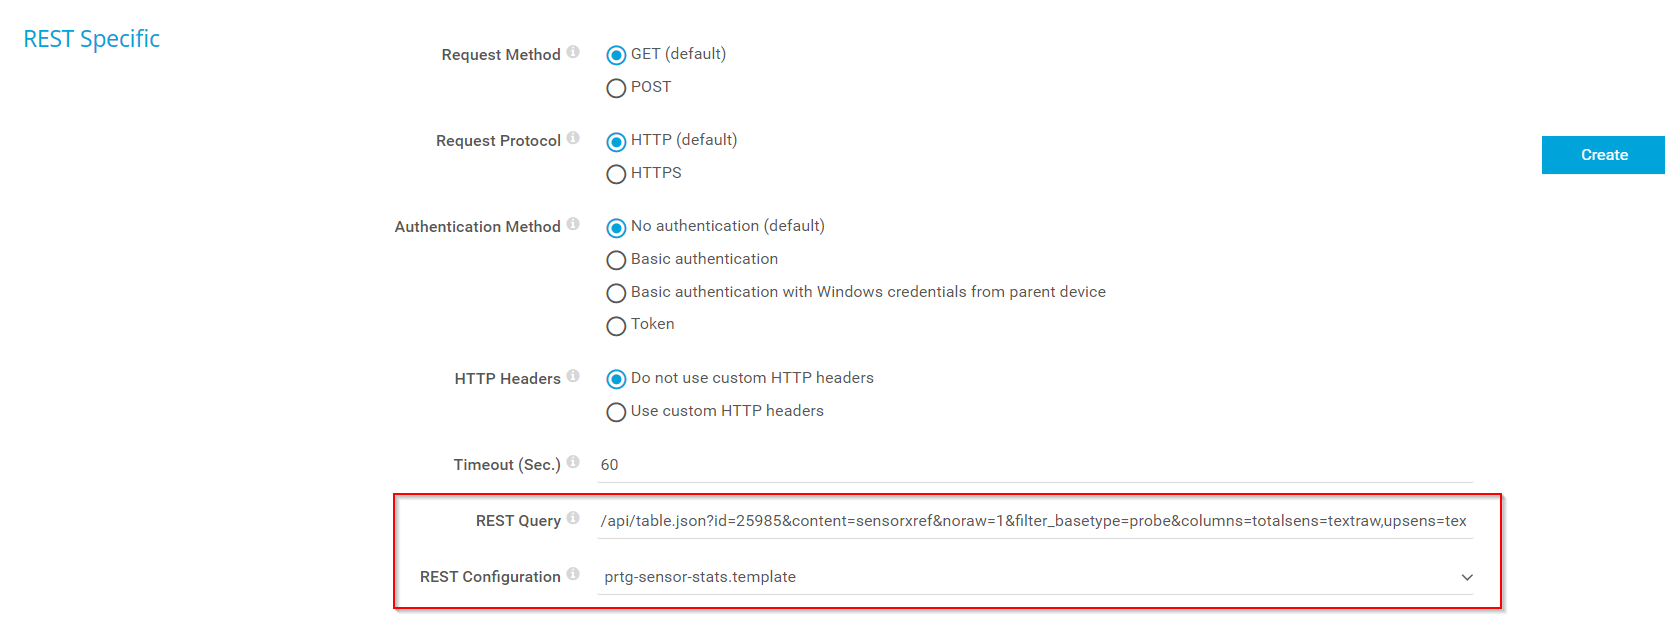
Once you add the REST Custom sensor to probe device, you will need to configure two parameters. The first one is to add the below query into REST Query field.
Here, 25985 is the ID of the remote probe, jasmin is a username and 1234567890 is the passhash code. Please adjust it according to your installation. You can find the passhash by navigating to Setup > Account Settings > My account > Show passhash.
The second parameter is to choose prtg-sensor-stats.template in the REST Configuration field.
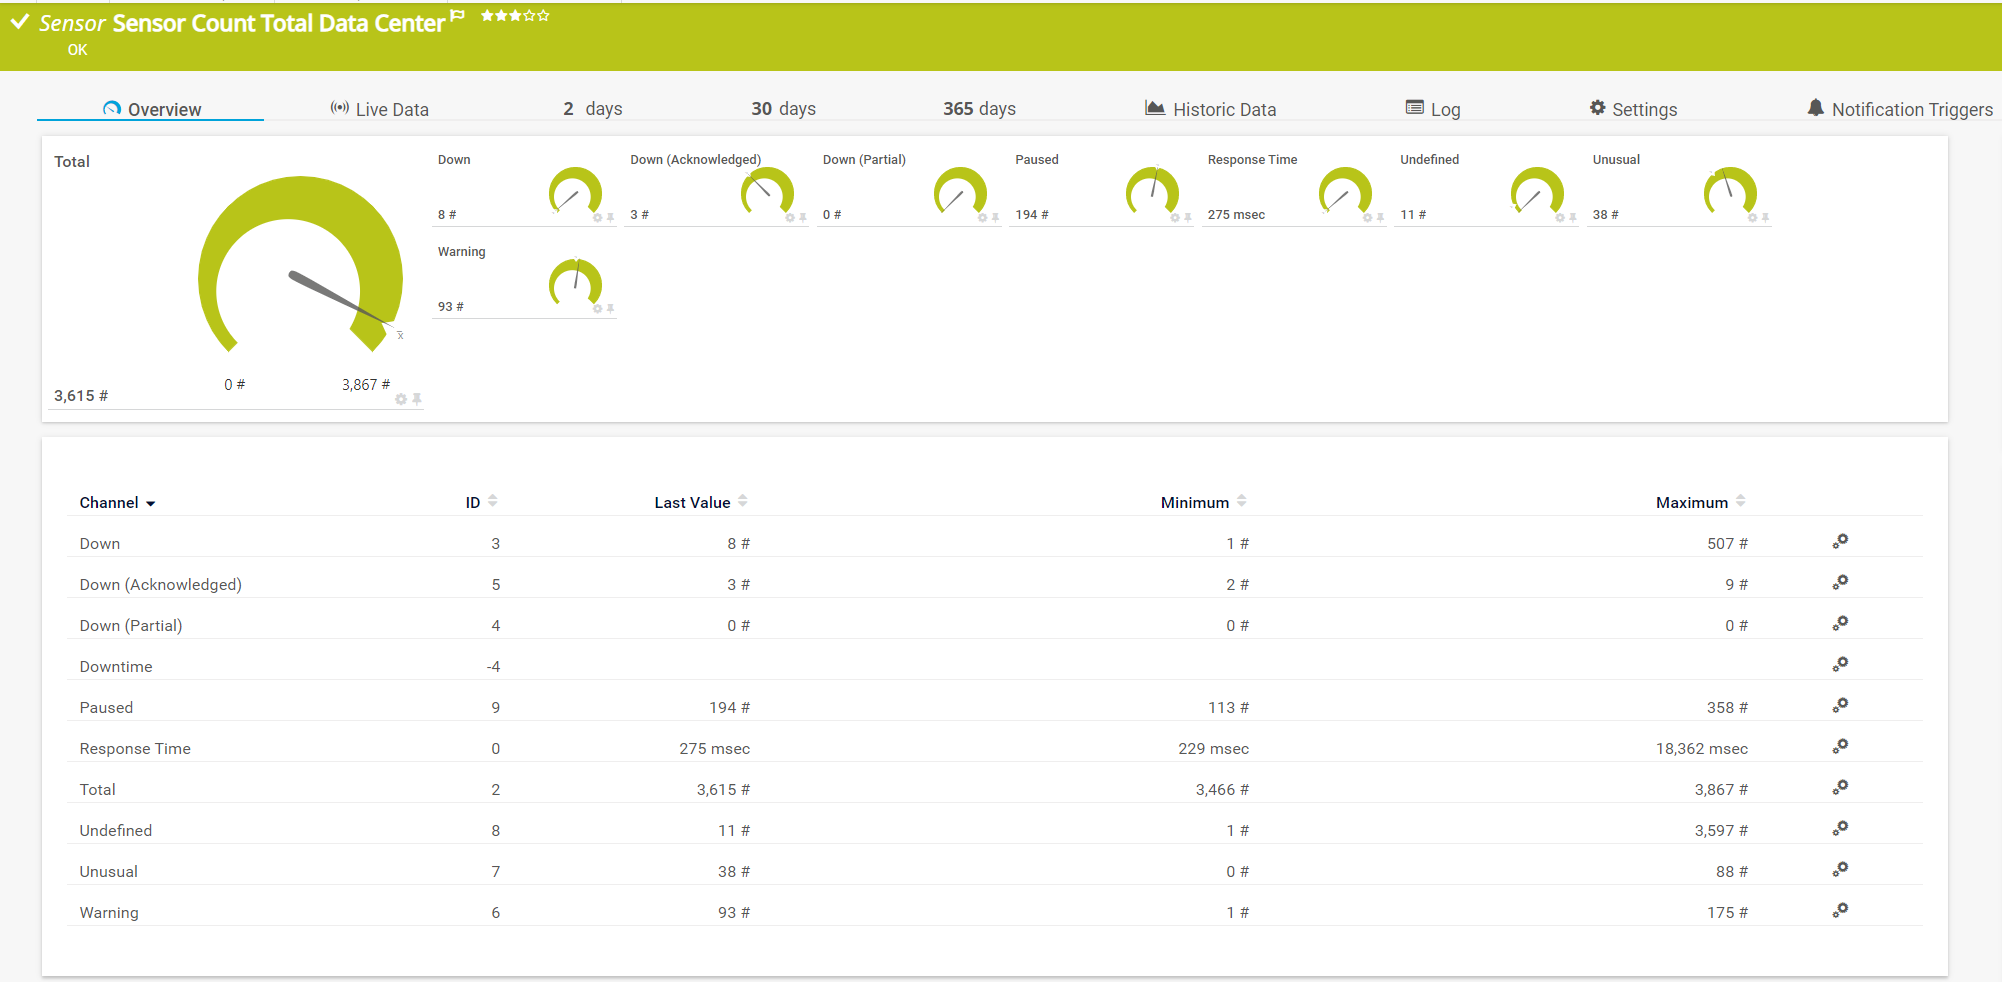
The sensor result says there are in total 3,615 sensors: 8 are in the down state, 3 in the down (acknowledged) state, 194 are paused, 11 are in the unknown state, 38 in the unusual state and 93 in a warning state.
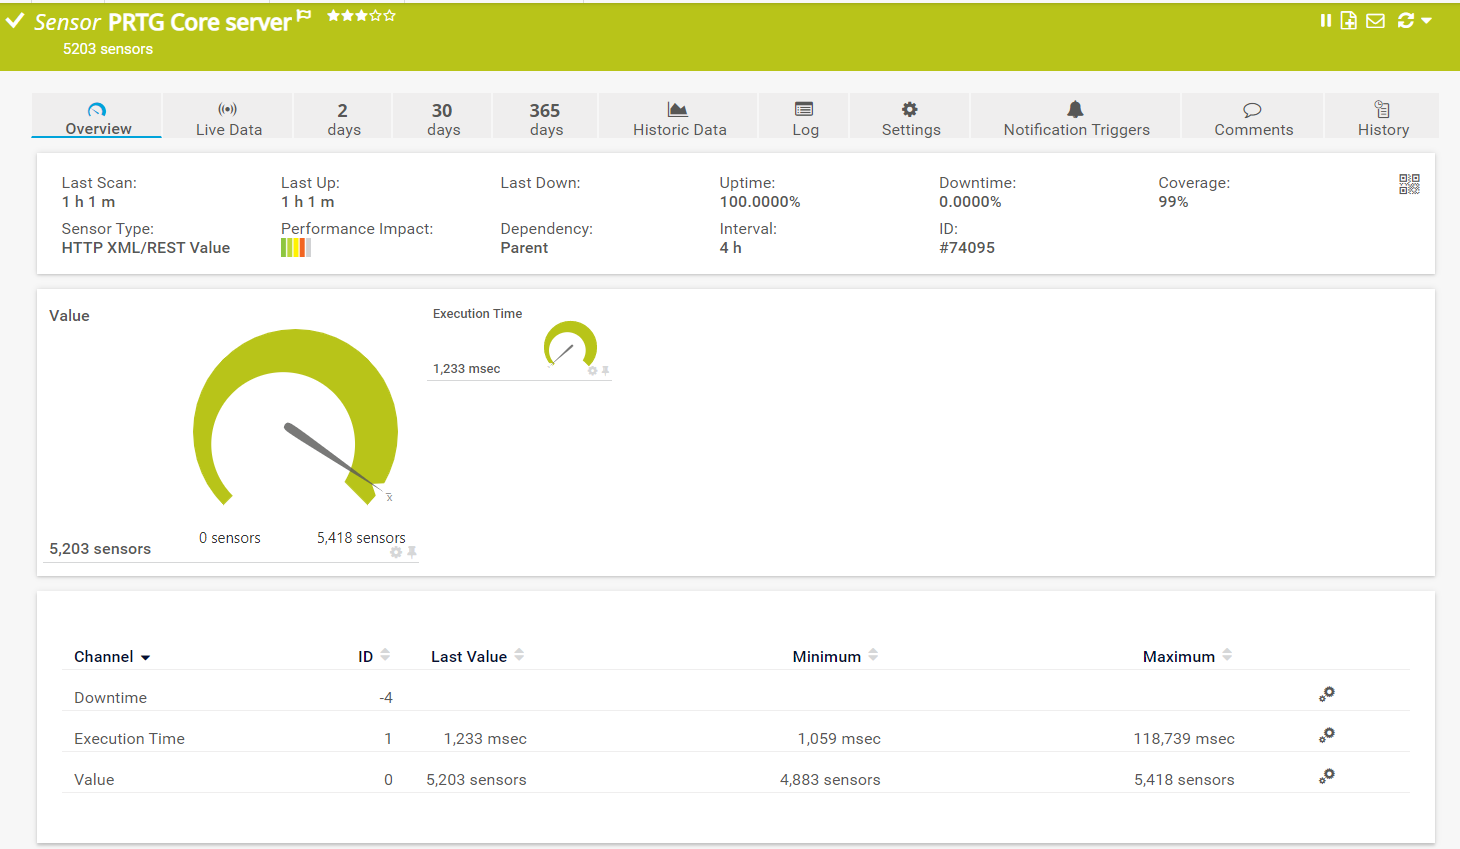
HTTP XML/REST Value sensor in action
The HTTP XML/REST Value sensor retrieves an .XML file from a URL and parses it. This kind of sensor can only show a single channel. We will use it to show the total number of sensors on the PRTG core server (it includes all remote probes).
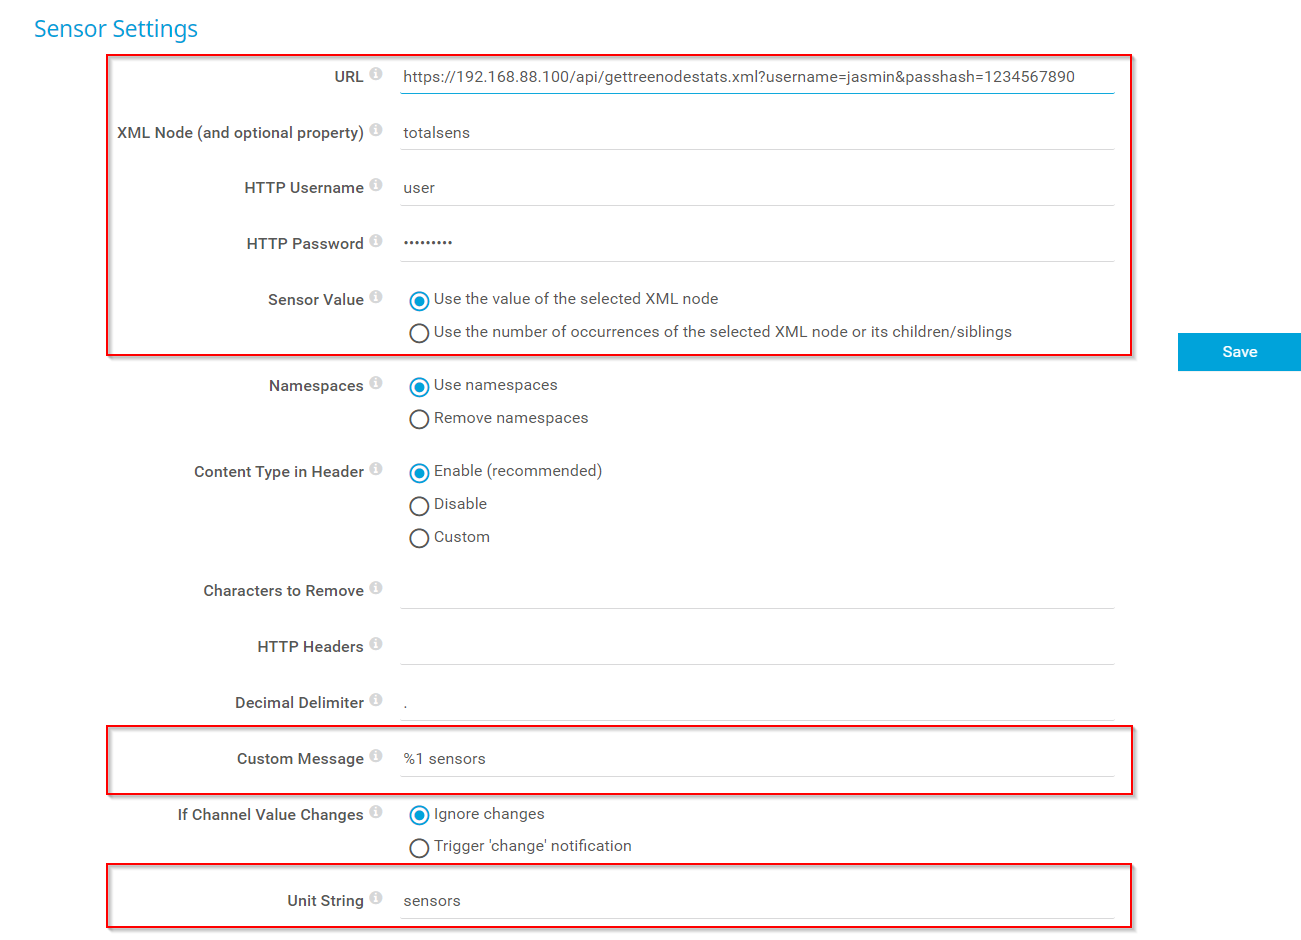
Once you add the HTTP XML/REST Value sensor to your probe device, you should configure the following parameters: URL, XML Node, HTTP Username, HTTP Password, Custom Message and Unit String. You can also find some explanations and screenshots below.
- URL: Enter the URL that returns the XML file. In my case, it is the URL of the PRTG core server available at 192.168.88.100
- XML Node: We will show the total number of sensors with the property totalsens. Other available properties are upsens, downsens, warnsens, downacksens, partialdownsens, unusualsens, pausedsens and undefinedsens.
- Custom Message: Optionally, enter a custom text to be displayed as the sensor message (e.g. %1 sensors).
- Unit String: Enter a string that defines the unit for the values that this sensor returns (e.g. sensors)
According to the sensor, there are 5,203 sensors available on the PRTG core server.
Based on the information you get from these two sensors, you can create a great map and show the health state and information about the number of sensors you are running on your PRTG core server.
I hope you find this article useful. I´m looking forward to hearing your feedback.


