 Published by Simon Bell
Last updated on March 03, 2022
•
7 minute read
Part 6 - Using PRTG's Business Process Sensor
To round off this series of articles on how PRTG can help monitor Microsoft Exchange, I thought I’d look at things from a different perspective, that of Exchange as a business service, rather than just a collection of IT components.

In previous articles we’ve seen how we can use a combination of PRTG’s out-of-the-box and custom sensors to give the Admins a great insight into how their Exchange system is performing. But we can also use PRTG to provide a higher-level view of service availability to the rest of the business. With the Business Process Sensor, one of the “hidden gems” of PRTG, we can summarise the state of sensors assigned to multiple devices to determine the availability of our Exchange service.
Business Process Sensor
As we’ve seen in other articles in this series, Microsoft Exchange relies on multiple devices, services and subsystems - servers, network, storage, AD all have to be available and performing well for Exchange to fulfil its role as the primary business communication tool. A problem with any one of those components can send Exchange offline (and the Service Desk’s phones into meltdown).
Here we have a typical “device centric” map of an Exchange infrastructure:
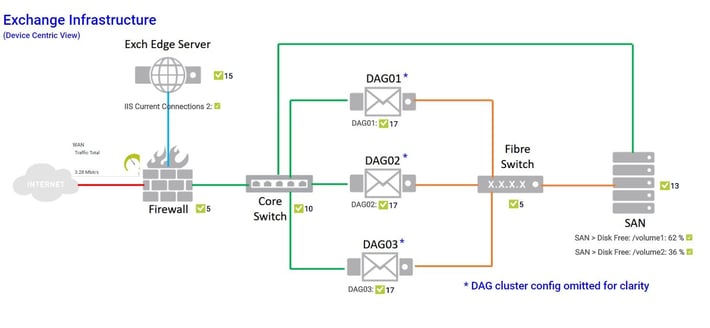
We have an Exchange edge server in a DMZ, three Mailbox servers in a resilient DAG, a SAN providing storage for the mailbox servers and finally ethernet & FC switches connecting everything together (For simplicity, I’ve omitted the Windows Server failover clustering config that DAGs require). This is exactly the sort of PRTG map that can be found in IT Operations Centres all over the world, keeping SysAdmins informed about how their Exchange system is performing.
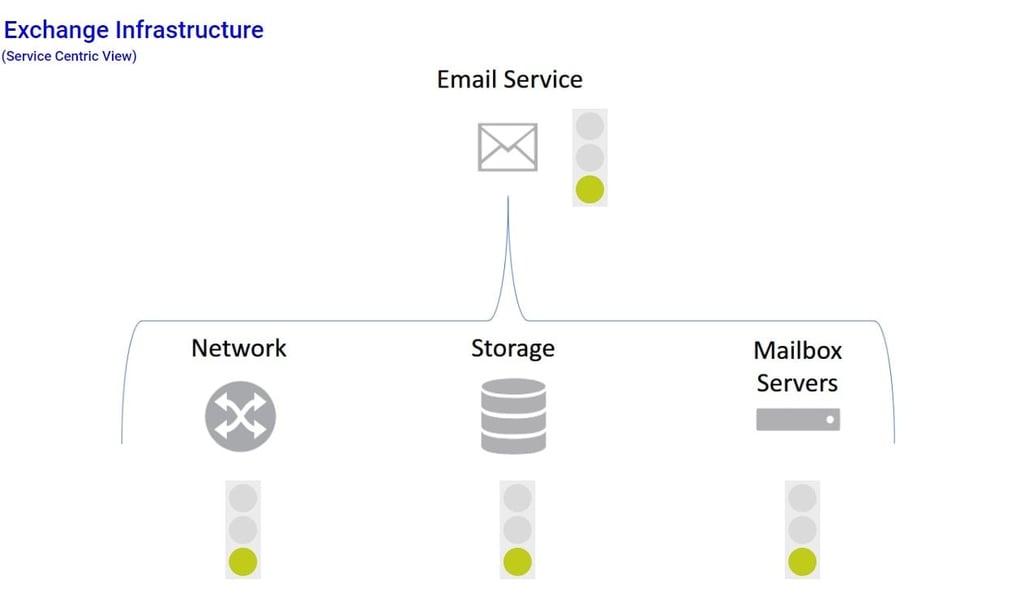
What the Business Process Sensor (BPS) allows us to do is reinterpret the status of these individual components to show the availability of the company email service.
So let’s have a look at how the BPS works.
Here we can see in my Device Tree, I’ve created a group called “BPS Exchange”, to which I’ve added a Device called “Exchange Service”
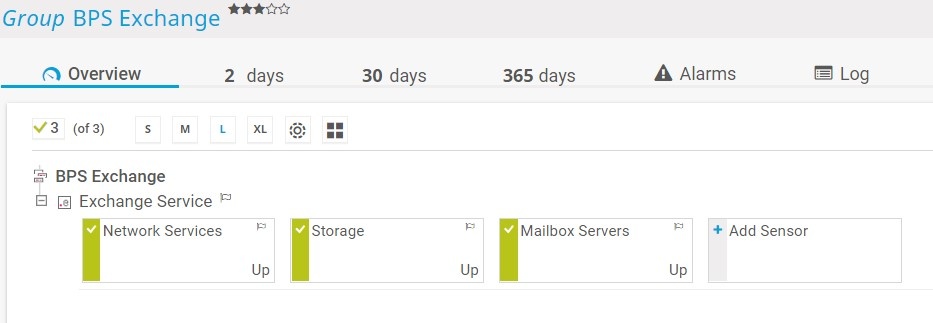
I’ve then created three separate BPS sensors for “Network Services”, Storage and “Mailbox Servers” respectively.
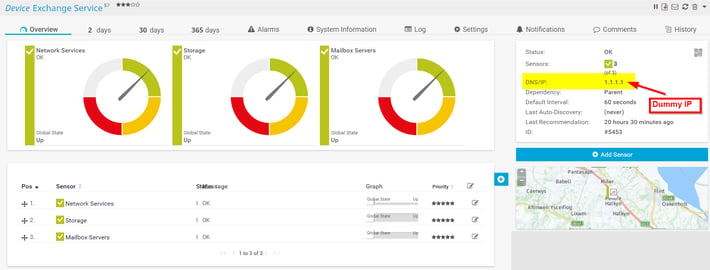
One thing to note here - as “Exchange Service” doesn’t exist as a physical device, it doesn’t have an IP address, so we just use a dummy address. Please make sure the address you choose doesn’t exist on your network or PRTG will try to poll that address.
We can see from the sensor gauges that PRTG is showing the global state of each BPS sensor as “Up”. So how does it determine that?
Opening the settings page for the Mailbox Servers sensor, we can see how the BPS is configured:
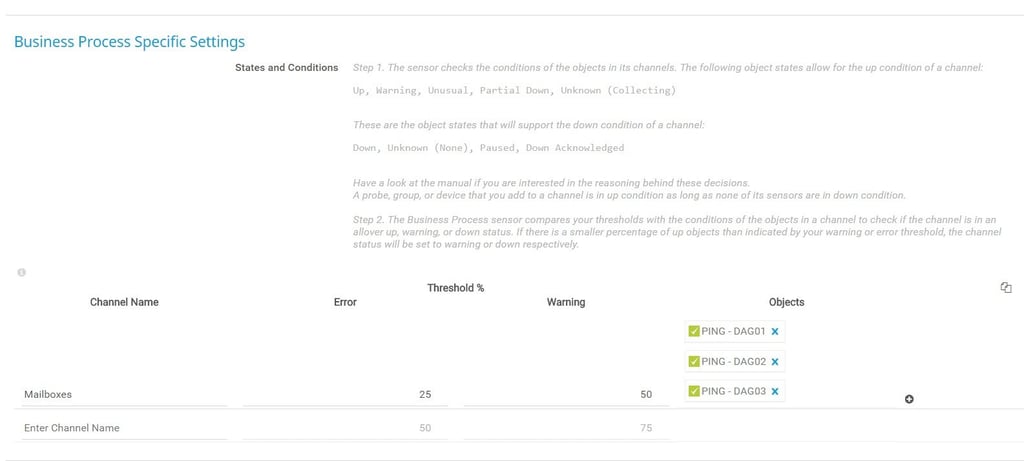
Firstly, we must provide a name for the Channel we’re creating, in this case “Mailboxes”
Next, we list the PRTG objects that make up the sensor. Here, we can add entire devices or individual sensors that already exists in PRTG. Remember, BPS aggregates the states of other objects, so they must already be defined.
Clicking the “+” symbol in the Channel field opens a Device Tree view from which we can select the objects we want to add. You need to give some thought here about which objects you want to add to the channel. In the example, to keep things simple, I’ve just selected the ping sensors assigned to the three DAG clusters. In practice, you’d probably want to add all sensors, or devices that are critical to the state of the service being defined.
Finally, we create the thresholds that will be used to set the “warning” and “error” states for the new channel. We do this by defining the amount (as a percentage) of objects (source devices or source sensors) that need to change from a green (“up”) state, before the overall status of the BPS channel changes state.
This can be a bit tricky to grasp, but this page describes the BPS status calculation process in more detail.
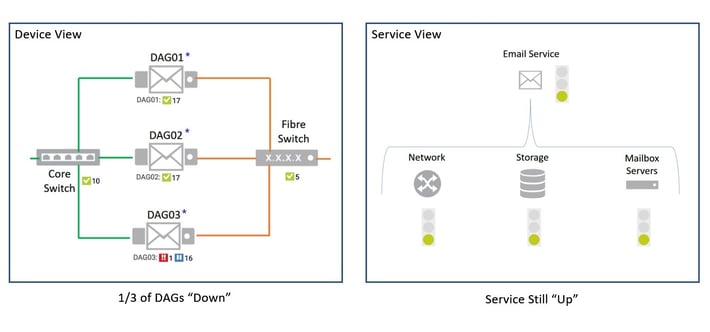
This allows us to define how degraded statuses in the source sensors affect the behaviour of the BPS. For example, if one of our three DAG clusters go offline, this is of concern to the IT Team, and they will be notified of the problem using the sensors assigned directly to the DAG device, elsewhere in PRTG. However, this is not necessarily service effecting – the remaining DAG clusters can adequately meet the needs of the business:
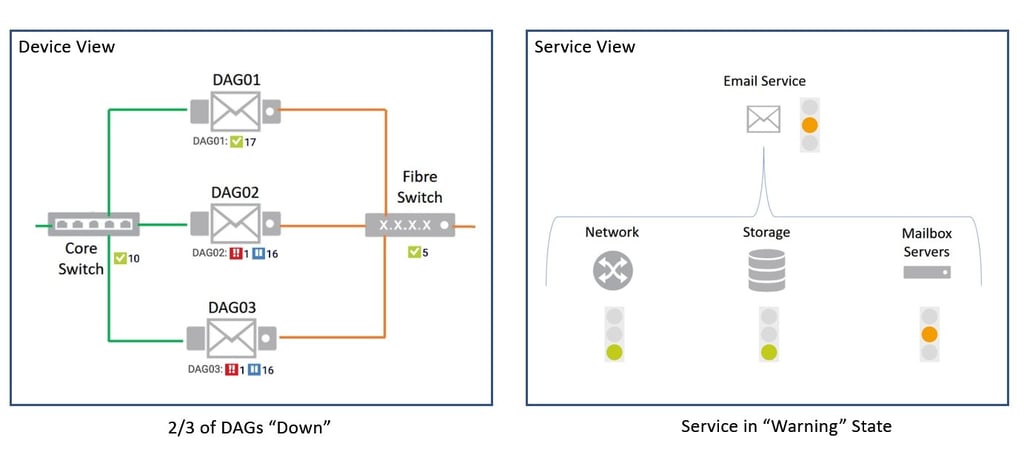
However, if a second DAG cluster fails, then this may well have a business impact. The service is still available, but degraded. Again, the device centric map and associated notifications will let IT know about the problem – lots of red status indicators. But the BPS, service centric map, will show an orange “warning” status because the service is still available, but degraded:
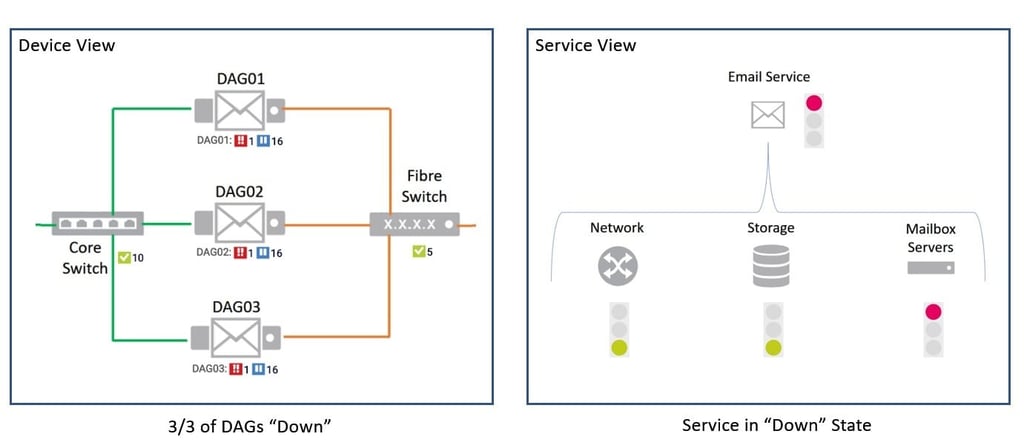
If we were then unlucky enough to lose the third and final DAG cluster, then both the device and service based maps would reflect this:
Of course, BPS isn’t just useful for Exchange monitoring. Any system or service that relies on multiple individual components can be portrayed and the relationship between the components represented. For example, you could create a BPS based map that shows the status of all your critical business systems – Email, CRM, EPR, Webshop, etc.
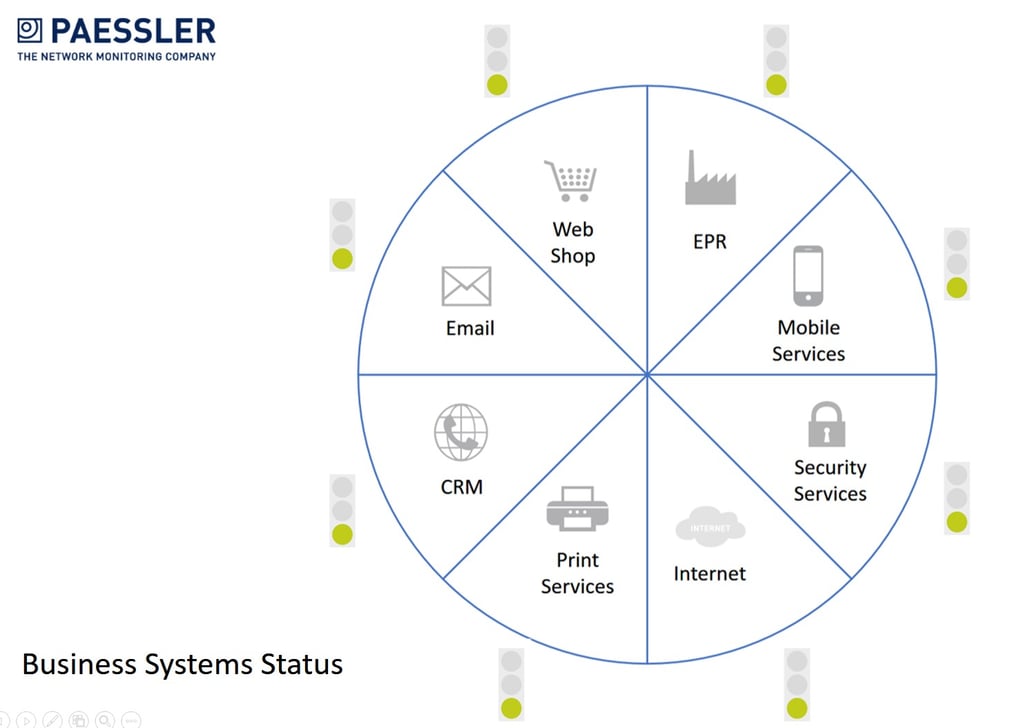
Embedding that map on an intranet page would allow users to immediately see if there is a problem with an IT system. A red or amber traffic light would indicate yes, there is a problem with that service, IT know about it, so there’s no need to open a case, helping to reduce the number of duplicate calls to the Service Desk.
The Business Process Sensor is a powerful and flexible feature of PRTG that enables the IT Department to convert “deep-dive” technical data on system health and performance, into simple service availability information; and then communicate that clearly and effectively to the rest of the business.
This look at the BPS concludes our series of articles on how PRTG can help the Exchange Administrator. The other five articles are available here:
8 Out-of-the-Box Exchange Sensors That Will Save Your @ss
Your Secret Weapon for Monitoring Exchange: Custom WMI, PerfMon and Script Sensors
Metrics That Matter: Processor and Process Metrics for MS Exchange
Metrics That Matter: Memory Metrics for MS Exchange
Metrics That Matter: AD, Network and Dot NET Metrics for MS Exchange


