 Published by Simon Bell
Last updated on March 03, 2022
•
8 minute read
Part 5 - Using PRTG's Active Directory & .NET Framework Sensors
Here, in the fifth part of the series on how PRTG can help the Exchange Admin, we’re again looking at metrics that matter. This time concentrating on Active Directory performance, Networking and the .NET Framework on which many Exchange functions depend.

Metrics That Matter
As the core component of Microsoft’s domain architecture, AD is vital to the functioning of Exchange. Responsible as it is for authentication, locating directory objects and replicating directory information around the network, any performance problem with AD is likely to have a major impact on the health of the Exchange environment.
Another component vital to the performance of Exchange is the .NET Framework. In fact, Exchange relies on .NET more than many other Microsoft applications. Exchange 2003 saw an extensive rewrite to the Information Store architecture which now uses separate worker processes for each mail database and which is supervised by a central co-ordinator, all based on .NET
A word of caution regarding .NET, do not assume that every version of Exchange supports every version of .NET. Resist the temptation to automatically upgrade your Exchange servers to the newest .NET version. You may regret doing so. Before making any changes to your system, always check the Exchange Server Supportability Matrix on the TechNet site.
Disclaimer - Obviously, the values seen in your deployment will vary depending on the architecture and size of the environment, and the available metrics may also depend on Exchange version in use, and the roles configured on the server.
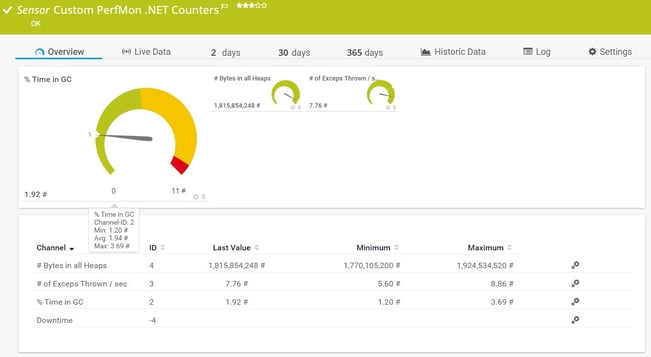
.NET Framework Counters
| Metric | Description | Recommendation |
| Network Interface(*)\Bytes Total/sec | Indicates the rate at which the network adapter is processing data bytes. This counter includes all application and file data, in addition to protocol information such as packet headers. |
or a 100-megabytes per second (MBps) network adapter, should be below 6–7 MBps. |
| Network Interface(*)\Packets Outbound Errors | Indicates the number of outbound packets that couldn't be transmitted because of errors. | Should be 0 at all times. |
| TCPv4\Connections Established | Shows the number of TCP connections for which the current state is either ESTABLISHED or CLOSE-WAIT. The number of TCP connections that can be established is constrained by the size of the nonpaged pool. When the nonpaged pool is depleted, no new connections can be established. | N/A |
| TCPv6\Connection Failures | Shows the number of TCP connections for which the current state is either ESTABLISHED or CLOSE-WAIT. The number of TCP connections that can be established is constrained by the size of the nonpaged pool. When the nonpaged pool is depleted, no new connections can be established. | N/A |
| TCPv4\Connections Reset | Shows the number of times TCP connections have made a direct transition to the CLOSED state from either the ESTABLISHED state or the CLOSE-WAIT state. | An increasing number of resets or a consistently increasing rate of resets can indicate a bandwidth shortage. |
| TCPv6\Connections Reset | Shows the number of times TCP connections have made a direct transition to the CLOSED state from either the ESTABLISHED state or the CLOSE-WAIT state. | An increasing number of resets or a consistently increasing rate of resets can indicate a bandwidth shortage. |
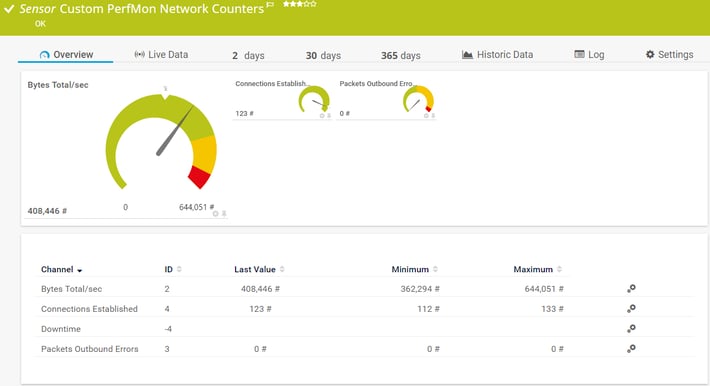
Network Counters
| Metric | Description | Recommendation |
| Network Interface(*)\Bytes Total/sec | Indicates the rate at which the network adapter is processing data bytes. This counter includes all application and file data, in addition to protocol information such as packet headers. | or a 100-megabytes per second (MBps) network adapter, should be below 6–7 MBps. For a 1000-megabits per second (Mbps) network adapter, should be below 60–70 Mbps. |
| Network Interface(*)\Packets Outbound Errors | Network Interface(*)\Packets Outbound Errors Indicates the number of outbound packets that couldn't be transmitted because of errors. |
Should be 0 at all times.Should be 0 at all times. |
| TCPv4\Connections Established | Shows the number of TCP connections for which the current state is either ESTABLISHED or CLOSE-WAIT. The number of TCP connections that can be established is constrained by the size of the nonpaged pool. When the nonpaged pool is depleted, no new connections can be established. | N/A |
| TCPv6\Connection Failures | Shows the number of TCP connections for which the current state is either ESTABLISHED or CLOSE-WAIT. The number of TCP connections that can be established is constrained by the size of the nonpaged pool. When the nonpaged pool is depleted, no new connections can be established. | N/A |
| TCPv4\Connections Reset | Shows the number of times TCP connections have made a direct transition to the CLOSED state from either the ESTABLISHED state or the CLOSE-WAIT state. | An increasing number of resets or a consistently increasing rate of resets can indicate a bandwidth shortage. |
| TCPv6\Connections Reset | Shows the number of times TCP connections have made a direct transition to the CLOSED state from either the ESTABLISHED state or the CLOSE-WAIT state. | An increasing number of resets or a consistently increasing rate of resets can indicate a bandwidth shortage. |
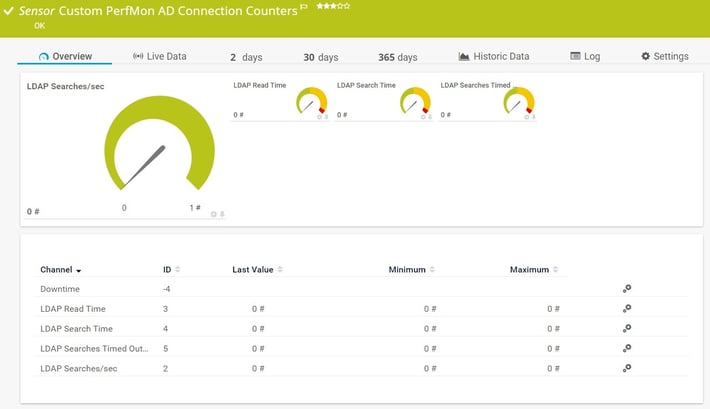
Domain Controller Connectivity Counters
| Metric | Description | Recommendation |
| MSExchange ADAccess Caches(*)\LDAP Searches/Sec | Shows the number of LDAP search requests issued per second. Used to determine current LDAP search rate. |
N/A |
| MSExchange ADAccess Domain Controllers(*)\LDAP Read Time | Shows the time in milliseconds (ms) to send an LDAP read request to the specified domain controller and receive a response. | Should be < 50 ms on average. Spikes shouldn't be higher than 100 ms. |
| MSExchange ADAccess Domain Controllers(*)\LDAP Search Time | Shows the time (in ms) to send an LDAP search request and receive a response. | Should be < 50 ms on average. Spikes shouldn't be higher than 100 ms. |
| MSExchange ADAccess Processes(*)\LDAP Read Time | Shows the time (in ms) to send an LDAP read request to the specified domain controller and receive a response. | Should be < 50 ms on average. Spikes shouldn't be higher than 100 ms. |
| MSExchange ADAccess Processes(*)\LDAP Search Time | Shows the time (in ms) to send an LDAP search request and receive a response. | Should be < 50 ms on average. Spikes shouldn't be higher than 100 ms. |
| MSExchange ADAccess Domain Controllers(*)\LDAP Searches timed out per minute | Shows the number of LDAP searches that returned LDAP_Timeout during the last minute. Higher values may indicate issues with Active Directory resources. |
Should be below 10 at all times for all roles. Higher values may indicate issues with Active Directory resources. |
All of these AD, Network and .NET values which can be easily and quickly checked using PRTG’s Custom Sensors, as we saw in the previous article Your Secret Weapon for Monitoring Exchange: Custom WMI, PerfMon and Script Sensors.


