 Published by Simon Bell
Last updated on March 03, 2022
•
12 minute read
Part 2 – Using PRTG’s Custom Sensors
As we saw in the first article in this series, PRTG ships with a set of pre-defined sensors for Microsoft Exchange that provide a great overview into the health and performance of an Exchange environment. But, what if we need more detail? Maybe we’re troubleshooting a specific problem, possibly an intermittent one. How can PRTG help? Unsurprisingly, PRTG has you covered (otherwise this would have been a very short article).

Like most Microsoft operating systems and applications, Exchange is extremely well instrumented - my test server has almost 4500 PerfMon counters prefixed “MSExchange”. Then there are WMI and PowerShell options and commands that can also retrieve data about how the system is performing.
iWMI stands for Windows Management Instrumentation. Designed by Microsoft, it is an infrastructure for the standardized management of data and information that is device independent. Since Windows 2000, WMI comes preinstalled with Windows operating systems. Read more ...
With so many metrics available, its simply not possible to list them all – plus it would make for a very dull read. So, in subsequent articles we’ll look at some of the most important values you should be keeping track of. Of course, you can use any of the available metrics that apply to your environment or to a particular problem you might need to troubleshoot. Microsoft’s website contains lots of additional information about the options available, and also provides recommended “healthy” values for the various metrics where appropriate.
Before we start detailing specific things we should be monitoring, we’ll start by looking at which of PRTG’s sensors we can use to gather the information. There are three main types of PRTG Custom Sensors, comprising six individual sensors that can help us to monitor Exchange:
- WMI Custom & WMI Custom String Sensors
- EXE/Script & EXE/Script Advanced Sensors
- PerfCounter Custom & PerfCounter IIS App Pool Sensors
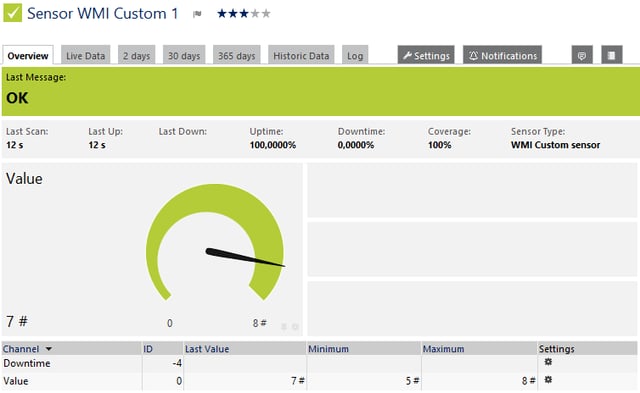
This sensor retrieves performance information from the target system using the Windows Management Instrumentation (WMI) architecture. Specifically, data is retrieved using queries written using WMI Query Language (WQL), and is passed back to PRTG for processing.
Examples of how to write WQL queries can be found here:
How do I properly configure a WMI custom sensor?
This sensor will return a single numeric value to PRTG.
Your Windows Management Instrumentation Query Language (WQL) query code must be stored in a file on the system running the probe that the sensor is created on. If used on a remote probe, the file must be stored on the system running the remote probe. In a cluster setup, please copy the file to every cluster node.
Save the file with the query into the \Custom Sensors\WMI WQL scripts subfolder of your PRTG installation. See the section Data Storage for more information about how to find this path.
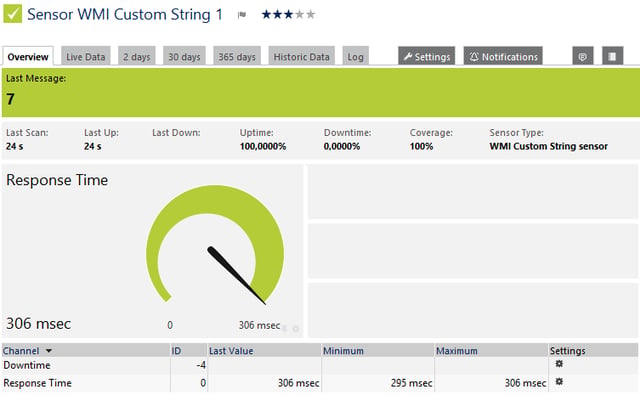
This is similar to the WMI Custom Sensor (see above), but returns a string value in the sensor message, rather than a numeric value. The WQL query is defined and saved to the probe system in the same way as it is for the WMI Custom Sensor.
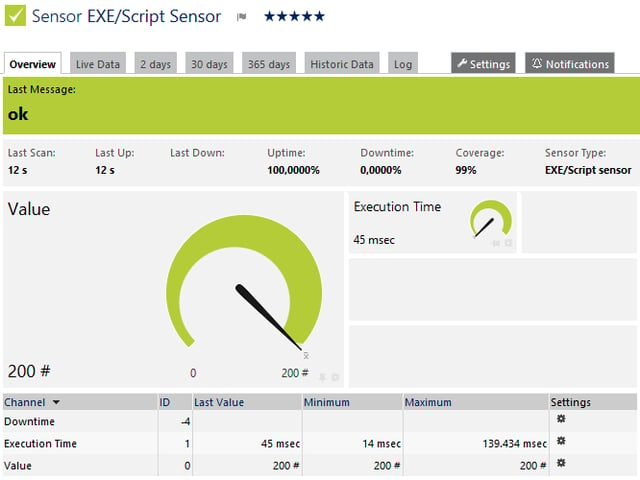
This sensor allows an executable (EXE or DLL) or a script (batch file, VBScript, PowerShell) to be run against the target device and a single numeric value to be returned. This sensor is part of the PRTG API architecture. For details about the return value format please see the Application Programming Interface (API) Definition.
The executable or script code must be stored in a file on the system running the probe that the sensor is created on. If used on a remote probe, the file must be stored on the system running the remote probe. In a cluster setup, please copy the file to every cluster node.
Save the file with the query into the \Custom Sensors\EXE subfolder of your PRTG installation. See the section Data Storage for more information about how to find this path.
This sensor only allows a single value (one channel) to be returned in each instance of the sensor. The returned values must be integers, floats or counters, and must be defined as such. The sensor does not support string values.
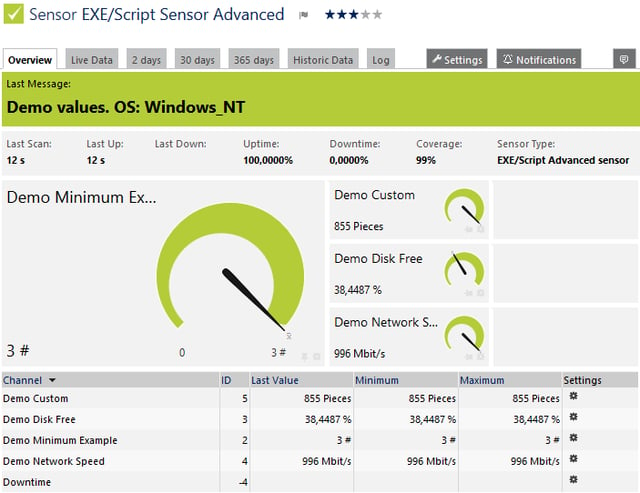
This is similar to the EXE / Script Sensor (see above), but supports up to maximum of 50 channels per instance of the sensor. The other main difference is that this sensor requires that the data be returned in XML or JSON format to standard output. Values and messages must also be embedded in XML / JSON.
For detailed information on how to build custom sensors and for the expected return format, please see the API documentation - Application Programming Interface (API) Definition for more information.
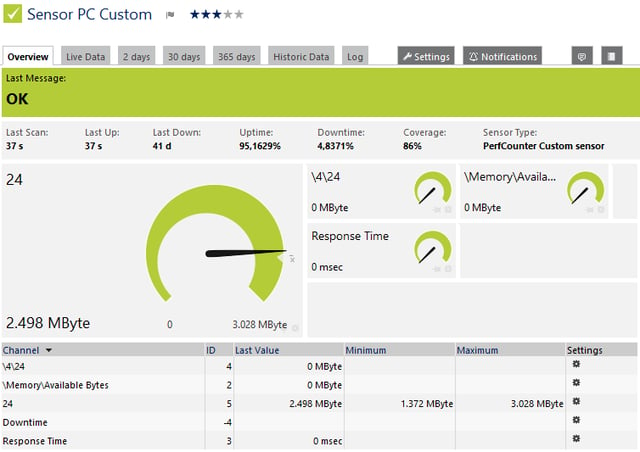
The PerfCounter Custom Sensor monitors a configured set of Windows Performance Counters (PerfMon). You must define your own channels as none are pre-defined.
This sensor requires the Windows Remote Registry service to be running on the target system.
If you use local credentials, please make sure the same Windows user accounts (with the same username and password) exist on both the system running the PRTG probe and the target computer. If you fail to do so, a connection via Performance Counters will not be possible.
The user account must be a member of the Performance Monitor Users user group on the target system.
The sensor is configured by providing the list of PerfMon counters that you want to collect. Details on how to do this, and some tricks for simplifying the process, are given below, in the Using PerfMon Counters section.
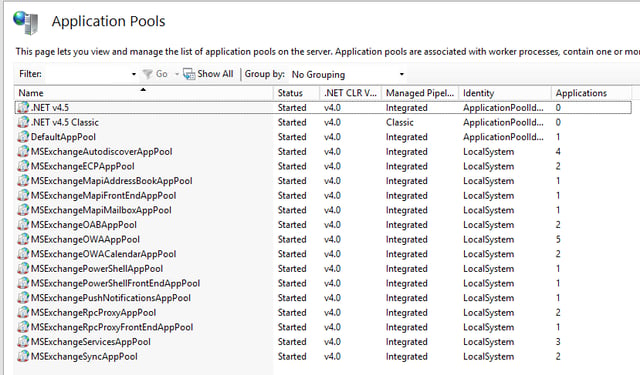
PerfCounter IIS App Pool Sensor
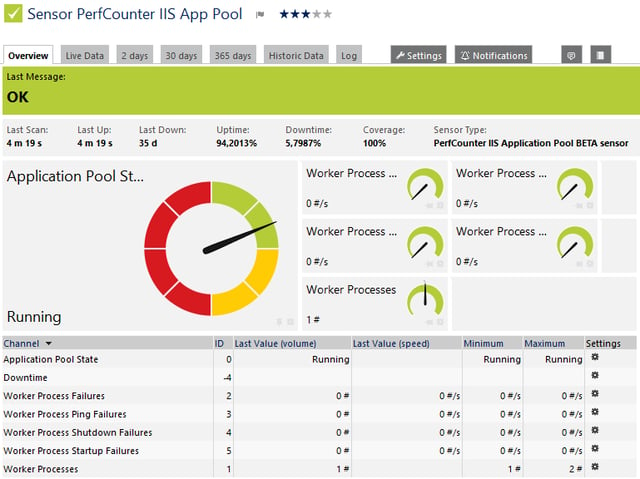
This sensor monitors the Microsoft Internet Information Services application pools, which Exchange makes extensive use of:
This sensor requires the Windows Remote Registry service to be running on the target system.
If you use local credentials, please make sure the same Windows user accounts (with the same username and password) exist on both the system running the PRTG probe and the target computer. If you fail to do so, a connection via Performance Counters will not be possible.
The user account must be a member of the Performance Monitor Users user group on the target system.
This sensor type uses lookups to determine the status values of one or more sensor channels. This means that possible states are defined in a lookup file. You can change the behaviour of a channel by editing the lookup file that this channel uses. For details, please see the manual section Define Lookups.
Please note, this sensor will contain an instance (a new sensor) for each app pool selected.
The exact information returned by the sensor will depend on the Exchange roles held by the target device, but can include:
- Overall status of the application pool:
- Running (sensor status Up)
- Initialized or Shutdown Pending (Warning)
- Unavailable, Uninitialized, Stopping, Stopped, or Delete Pending (Down)
- Number of worker processes
- Number of failures in worker processes per second
- Number of ping failures per second
- Number of shutdown failures per second
- Number of startup failures per second
Using PerfMon Counters
Both the WMI and script sensors require a good knowledge of Microsoft’s management instrumentation, with its arcane structures and naming conventions. This is fully documented on Microsoft’s site, About WMI, and is well worth checking out for those who want to know exactly how the system works, or who are thinking of writing their own custom script sensor (If you do write a script, don’t for get to share it with you peers on Paessler’s PRTG Sensor Hub page). But if you need to quickly deploy some sensors to troubleshoot an Exchange issue, then the PerfCounter Custom sensor is much quicker to configure.
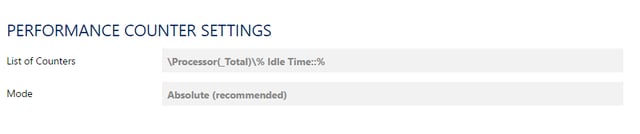
As mentioned earlier, you need to define your own channels for this sensor, as none are preconfigured. This is done by pasting counter definitions into the “List of Counters” panel of the sensor config page. The counter definition must be in this format:
\countercategory(including instance)\countername::(units)
That is, the counter name, two colons (::) and a unit indicator. For example:
\Processor(_Total)\% Processor Time::%
Even with this sensor, you need to be familiar with the structure and naming conventions of Perfmon Counters. These are easier to figure out than the WMI class names, but the Perfmon tool isn’t the easiest to navigate, especially when there are literally thousands of counters to search through. Fortunately, there are a couple of tricks you can use to simplify this.
The first requires the “counters of interest” to be added to PerfMon. The configuration details can then be exported into a text format from which the counter names can be copied. This is described in detail here: How can I find out the names of available Performance Counters?
The second uses a simple command line tool to export a full list of available counters to a text file that can then be imported into Excel, or a text editor. On the Exchange server, open a Command Prompt, with admin privileges, and enter the following command:
Typeperf -qx > PerfCounters.txt
This will export a complete list of the counters available on that server to a file called PerfCounters.txt. Please note that the file can be lengthy. On my test system, it’s almost 5Mb, and runs to over 76,000 lines.
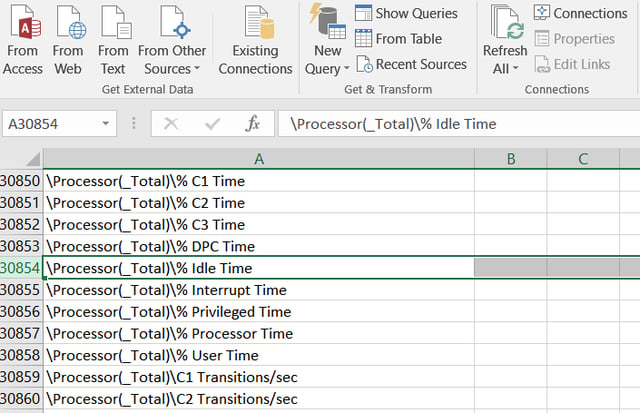
The output is formatted in such a way that the properly formed counter names can be copied and pasted directly into the PerfCounter Custom Sensor definition panel
Microsoft offer an almost overwhelming amount of data about how Exchange systems are behaving. PRTG’s Custom Sensors provide the Exchange Admin with powerful tools to capture and interpret that data and transform it into meaningful information about the health and performance their environments.
In subsequent articles, we’ll go into more details about how these Custom Sensors can be used to extract this information, and take a closer look at some of the “Metrics That Matter”.
Part 1: 8 Out-Of-The-Box Exchange Sensors That Will Save Your @ss
Part 3: Metrics That Matter: Processor and Process Metrics for MS Exchange
Part 4: PRTG & The Exchange Admin - Metrics That Matter:: Memory Metrics for MS Exchange


