Part 1 – Exchange Sensors Included In PRTG
In this, the first in a series of articles looking at how PRTG can help Exchange Admins to manage their systems, we look at the continued popularity of email as a corporate communications tool. We’ll also see how PRTG’s pre-defined Exchange sensors can provide a great overview of system health and performance. In subsequent articles, we’ll see how custom sensors can provide even deeper insight into the many components and sub-systems that make up an Exchange infrastructure.
The death of email has been predicted many times in recent years, with various justifications – instant messaging is better, spam makes email insecure and inefficient, social media is cooler, people change addresses too often. However, as is often the case, the facts do not agree with pundit’s opinions, as the Email Statistics Report 2015-2019 by The Radicati Group shows:
|
2015 |
2016 |
2017 |
2018 |
2019 |
|
|
Global Email Accounts (Mio) |
4353 |
4626 |
4920 |
5243 |
5594 |
|
% Growth |
|
6% |
6% |
7% |
7% |
|
2015 |
2016 |
2017 |
2018 |
2019 |
|
|
Global Daily Email Messages (Bn) |
206 |
215 |
225 |
236 |
247 |
|
% Growth |
|
5% |
5% |
5% |
5% |
So, far from becoming extinct, the prevalence and popularity of email continues to increase. The move towards cloud based services is starting to change the way organisations provision their email services. Research from Gartner shows that around 13 percent of publicly listed companies have already moved their email into the cloud.
But this means that most organisations are still using on premise email services and while surveys differ in the precise market share, they do all agree that Microsoft Exchange is still the clear market leader when it comes to business email systems.
Since its initial release in 1996, Exchange has evolved from a relatively simple X.400 based messaging system, into a complex application that provides many features -
- Email Send & Receive via MAPI, IMAP, POP3, SMTP Protocols
- Meeting, Appointment and Resource Scheduling
- Contact Management
- Task Management
- Collaboration & Shared Folders
- Spam & Virus Filtering and Protection
- Mobile Device Synchronisation
- Web Based Access
In turn, these features rely on many aspects of the IT infrastructure – servers, network, storage and the rest must all be performing optimally for Exchange to fulfil its function as the primary communications tool for most organisations. This is where PRTG can make an Exchange Admin’s life easier, by ensuring that all the supporting infrastructure, and the Exchange system itself, is healthy and performant.
In subsequent articles, we’ll look at how PRTG’s Custom Sensors can be used to “deep-dive” into the health of the Exchange system, what metrics we should be monitoring, and some of the performance danger signs to look out for. But to start with, let’s take a look at PRTG’s out-of-the-box Exchange sensors.
- WMI Exchange Server Sensor
- WMI Exchange Transport Queue Sensor
- Exchange Backup (PowerShell) Sensor
- Exchange Database (PowerShell) Sensor
- Exchange Database DAG (PowerShell) Sensor
- Exchange Mail Queue (PowerShell) Sensor
- Exchange Mailbox (PowerShell) Sensor
- Exchange Public Folder (PowerShell) Sensor
Before we get into the specifics of the individual sensors, a word about thresholds / limits. Where possible, I’ve tried to give guidance about the “healthy” values you should look for from these sensors, but for many of them the performance figures will vary across deployments – An Exchange system serving a 10-person company will perform very differently to one in a global corporation or multi-tenant, MSP environment.
This is why baselining is important when setting up a new monitoring system or adding new systems & devices. After installation, it’s a good idea to leave PRTG gathering data for a week or two, before setting thresholds & notifications. That way, you can get a feel for what is “normal” performance in your environment, and you can use this data to set your thresholds accordingly. One of the most common reasons for monitoring projects failing is the lack of baselining before activating notifications. Support teams quickly learn to ignore floods of false-positive notifications coming from a badly tuned monitoring system and this inevitably leads to real, critical alerts being missed.
So, with that advice in mind, let’s take a look at the Exchange specific sensors that are included with every PRTG license, including the 100 sensor freeware version.
WMI Exchange Server Sensor
This Is a great general purpose Exchange sensor. Adding this to a server will allow you to choose from over a dozen different metrics that report on the health and performance of many of the key components of Exchange. The specific sensors available will vary based on the roles and configuration of the server it is assigned to.
|
Metric |
Description |
Recommendation |
|
Queue size |
The number of messages waiting to be processed in the message queues |
The lower the better, ideally 0 |
|
Average delivery time |
The average time in seconds between the submission of a message to the public folder store and submission to other storage providers for the last 10 messages. |
The lower the better |
|
Logon operations per second |
Shows the number, per second, of mailbox store logon operations. |
N/A |
|
Sent, delivered, and submitted messages per second |
This shows the number of messages processed by Exchange per second. Large changes to this number, either up or down, could indicate problems. |
N/A |
|
Messages queued for submission |
Shows the current number of submitted messages not yet processed by the transport system |
Should not exceed 50. Queue should not persist for more than 15 mins. |
|
Remote Procedure Call (RPC) packets operations per second |
Shows the rate at which RPC operations occur, per second. |
N/A |
|
RPC latency, requests, and slow packets |
This measures the overall performance of the RPC subsystem |
Fast is better |
|
RPC sent, slow, outstanding, and failed requests (store interface) |
Another indicator of RPC performance |
Fast is better |
|
Read and write bytes RPC clients per second |
Another indicator of RPC performance . Large changes to this number, either up or down, could indicate problems |
N/A |
|
Number of active and anonymous users |
Number of users connected to the mailbox store |
N/A |
|
Database page faults per second |
The rate that database file page requests require the database cache manager to allocate a new page from the database cache. |
The lower the better |
|
Log record stalls per second |
This shows the number of log records that cannot be added to the log buffers per second because the log buffers are full |
The lower the better. Log stalls will lead to increases in RPC latency. Could be caused by disk I/O bottlenecks. |
|
Log threads waiting |
The number of threads waiting for their data to be written to the log in order to complete an update of the database. |
The lower the better |
|
Database cache size in bytes and miss in percent |
the amount of system memory used by the database cache manager to hold commonly used information from the database file(s) to prevent file operations. |
% miss should be as low as possible |
|
Current unique users (OWA) |
Shows the number of active users currently logged into the Outlook Web Application |
N/A |
|
Average response time (OWA) |
The average time (in milliseconds) that elapsed between the beginning and end of an OEH or ASPX request. |
The lower the better |
Some of the features of this Sensor are also available in separate PowerShell based Sensors. As with all WMI based sensors, this will have a relatively high impact on PRTG’s system performance. We recommend using fewer than 200 WMI based sensors per Probe.
WMI Exchange Transport Queue Sensor
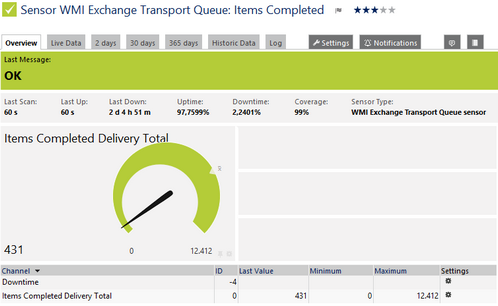
Another general-purpose sensor that will also create individual sensors for the objects selected. This sensor provides statistics for over 30 of the various message queues used to transport email from sender, through the Exchange system and to the recipient. You can choose different sensors for each of the “high”, “normal”, “low” and “none” message priorities that Exchange uses, as well as “total” to see an overall summary. Setting thresholds or limits on some of the more important queues is a great way to ensure that mail delivery is taking place, as any increase in the number message being held in a queue would indicate a message delivery problem. In general, look for low values in the “queue length” channels and high values in the “items completed” channels.
Find more information at the manual.
The rest of the pre-defined sensors are all PowerShell based, so there are some pre-requisites that must be taken care of before they can be used.
Both Remote PowerShell and Remote Exchange Management Shell must be enabled on the target system, and PowerShell 2.0, or later, must be installed on the server running the Probe on which the sensor is running. This page provides details of how to use PowerShell based sensors. In particular, make sure the execution policy is set to "unrestricted" to allow scripts to run. This needs to be done for the version of PowerShell that is invoked by PRTG, which is not necessarily the version that appears on the Start Menu. If this isn't done you will probably get an "Unauthorised Access" error on the sensor.
To fix this, on the Core Server or Remote Probe, where the sensor is to be created, open a CMD prompt as an Administrator (not a PowerShell session) and type the following:
%systemroot%\SysWOW64\WindowsPowerShell\v1.0\powershell.exe
When the command prompt changes to "PS", enter the following command:
set-executionpolicy unrestricted
Exchange Backup Powershell Sensor
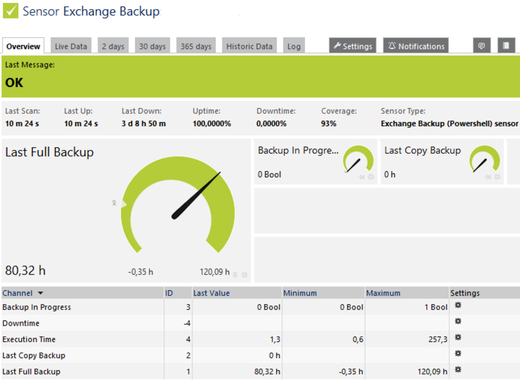
This PowerShell based sensor must be assigned to a server holding the Mailbox server role (rather than a CAS or Transport Server). It will return details of the backup status of the mail database(s) held on the server. It contains channels for:
- Time Since Last Full Backup
- Time Since Last Copy Backup
- Backup Currently in Progress
Use this to keep a check on the history of your Exchange backups. Setting a limit on the “Time Since” channels will notify you if the system goes too long without a backup being taken.
Find more information at the manual.
Exchange Database Powershell Sensor
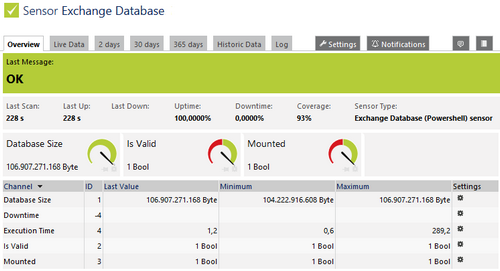
Another PowerShell based sensor, this one checks the operational state of the database that holds the individual mailboxes and specifically reports on:
- Database Size
- Mount State
- Validity
Limits on the “Validity” and “Mount State” channels will notify you if the database goes offline or experiences corruption.
Find more information at the manual.
Exchange Database DAG Powershell Sensor
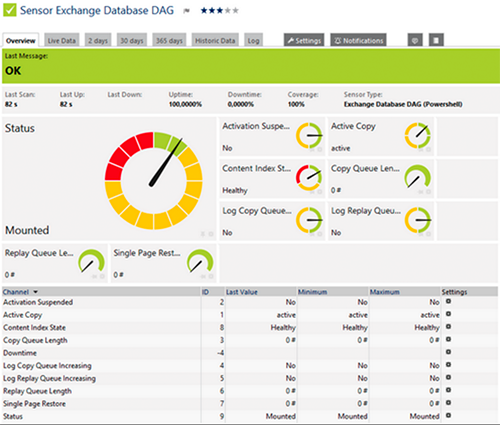
Introduced in Exchange 2013, Database Availability Groups (DAGs) form the basis of a high availability resilience feature for Exchange. With a DAG being a group of up to 16 (in Exchange 2016) Mailbox servers that host a set of mail store databases that can provide automatic database level recovery in the event of a failure of individual servers or databases. This sensor provides detailed information on the status of an Exchange DAG:
- Overall DAG status (for example, if it is mounted, failed, suspended)
- Copy status (active, not active)
- Content index status (healthy, crawling, error)
- If activation is suspended
- If log copy queue is increasing
- If replay queue is increasing
- Length of copy queue
- Length of Replay queue
- Number of single page restores
Limits assigned to the various queue lengths will notify the administrator of problems with DAG replication.
Find more information at the manual.
Exchange Mail Queue PowerShell Sensor
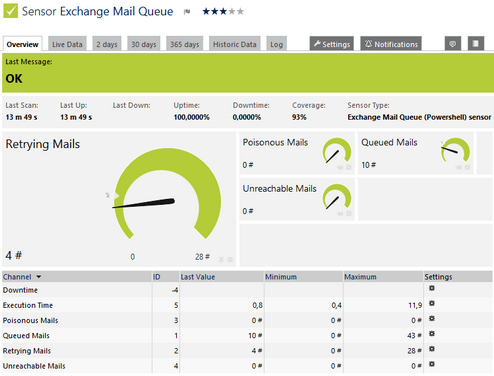
The Mail Queue Sensor monitors the number of items in the outgoing mail queue of an Exchange Server. Like the WMI based Transport Queue Sensor mentioned above, this is a great sensor for checking that outbound email is leaving your mail system. Assigning limits to the various channels in this sensor will allow the administrator to immediately see if messages are backing up. For all channels, lower values are better.
- Number of queued mails
- Number of retrying mails
- Number of unreachable mails
- Number of poisonous mails
Find more information at the manual.
Exchange Mailbox PowerShell Sensor
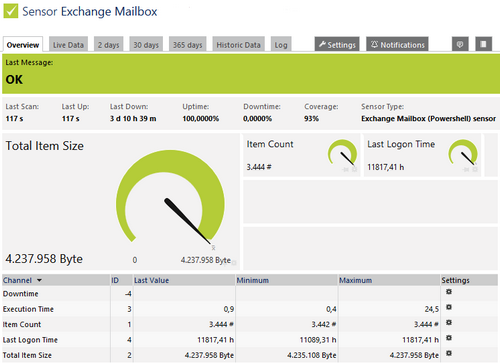
The Mailbox Sensor returns metrics for individual user and system mailboxes. The data returned includes
- Total size of items in place
- Number of items in place
- Past time since the last mailbox logon
Assigning limits on this sensor is a great way for Admins to be warned when individual mailboxes are approaching policy size limits, and identifying unused or orphan mailboxes.
Find more information at the manual.
Exchange Public Folder PowerShell Sensor
Microsoft have been talking about deprecating Public Folders in Exchange for several years, but they’re still available in Exchange 2016. This sensor returns the same statistics for Public Folders as the Mailbox Sensor does for individual mailboxes (see above):
- Total size of items in place
- Number of items in place
- Past time since the last mailbox logon
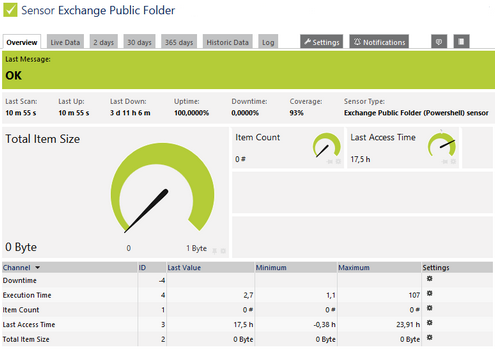
Find more information at the manual.
These out-of-the-box sensors will provide Exchange Admins with a good overview of the health of their systems. But by using PRTG’s Custom Sensors we can get an even deeper insight into how well our Exchange servers are performing and we’ll look into how to do this in the next part of this series.
Part 2: Your Secret Weapon for Monitoring Exchange: Custom WMI, PerfMon and Script Sensors
Part 3: Metrics That Matter: Processor and Process Metrics for MS Exchange
Part 4: PRTG & The Exchange Admin - Metrics That Matter: Memory
 Published by


