 Published by Simon Bell
Last updated on March 03, 2022
•
6 minute read
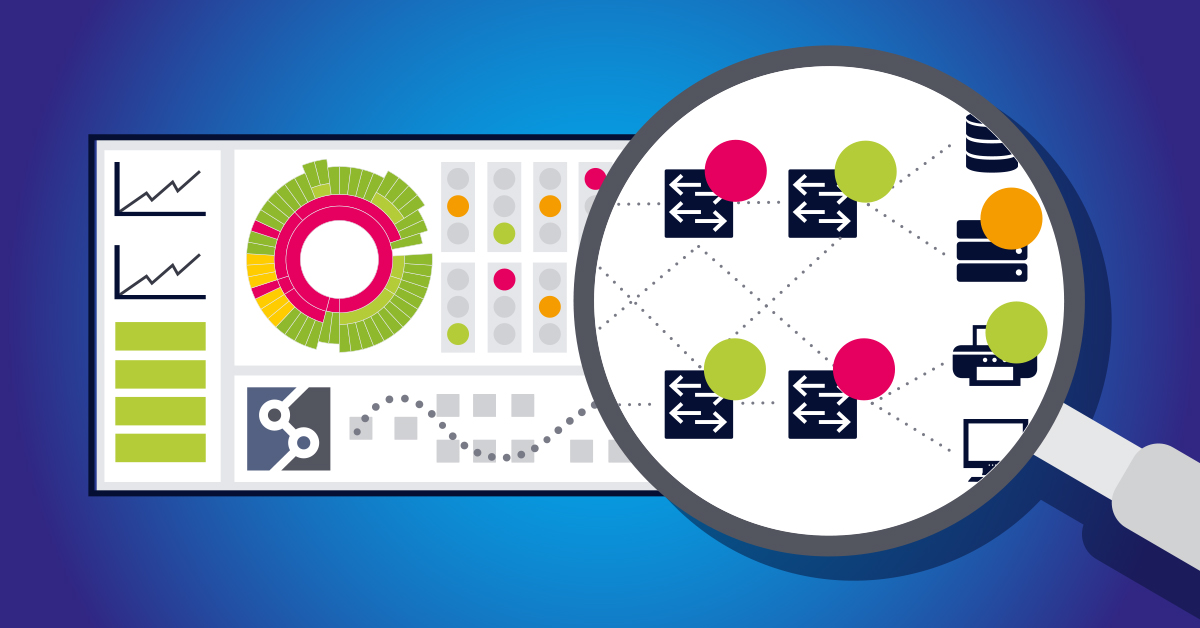
As you’ll have seen in our first article, IP Fabric provides administrators with a thorough, end-to-end view of their network. Relationships and interactions between devices are correlated, intent verification rules are confirmed, and regulatory compliance validated.
In this article, we’re going to take a deeper, more technical look at how PRTG can utilize information from IP Fabric, and combine it with its own data to help give network admins a detailed look at not just how their environment is performing, but how it’s actually behaving – is it handling traffic efficiently, securely and in the way it’s supposed to?
IP Fabric includes a rich and beautifully implemented API. This isn’t just an add-on feature, included to facilitate the export of data; it’s a fundamental part of the system, and is used internally to pass data between the various functional modules of IP Fabric. A fortunate side-effect of having such a powerful management API is that it makes it easy to retrieve data using PRTG’s REST Custom Sensor. Let’s walk through an example of this by creating a PRTG sensor showing the number of IPSec Tunnels using weak authentication.
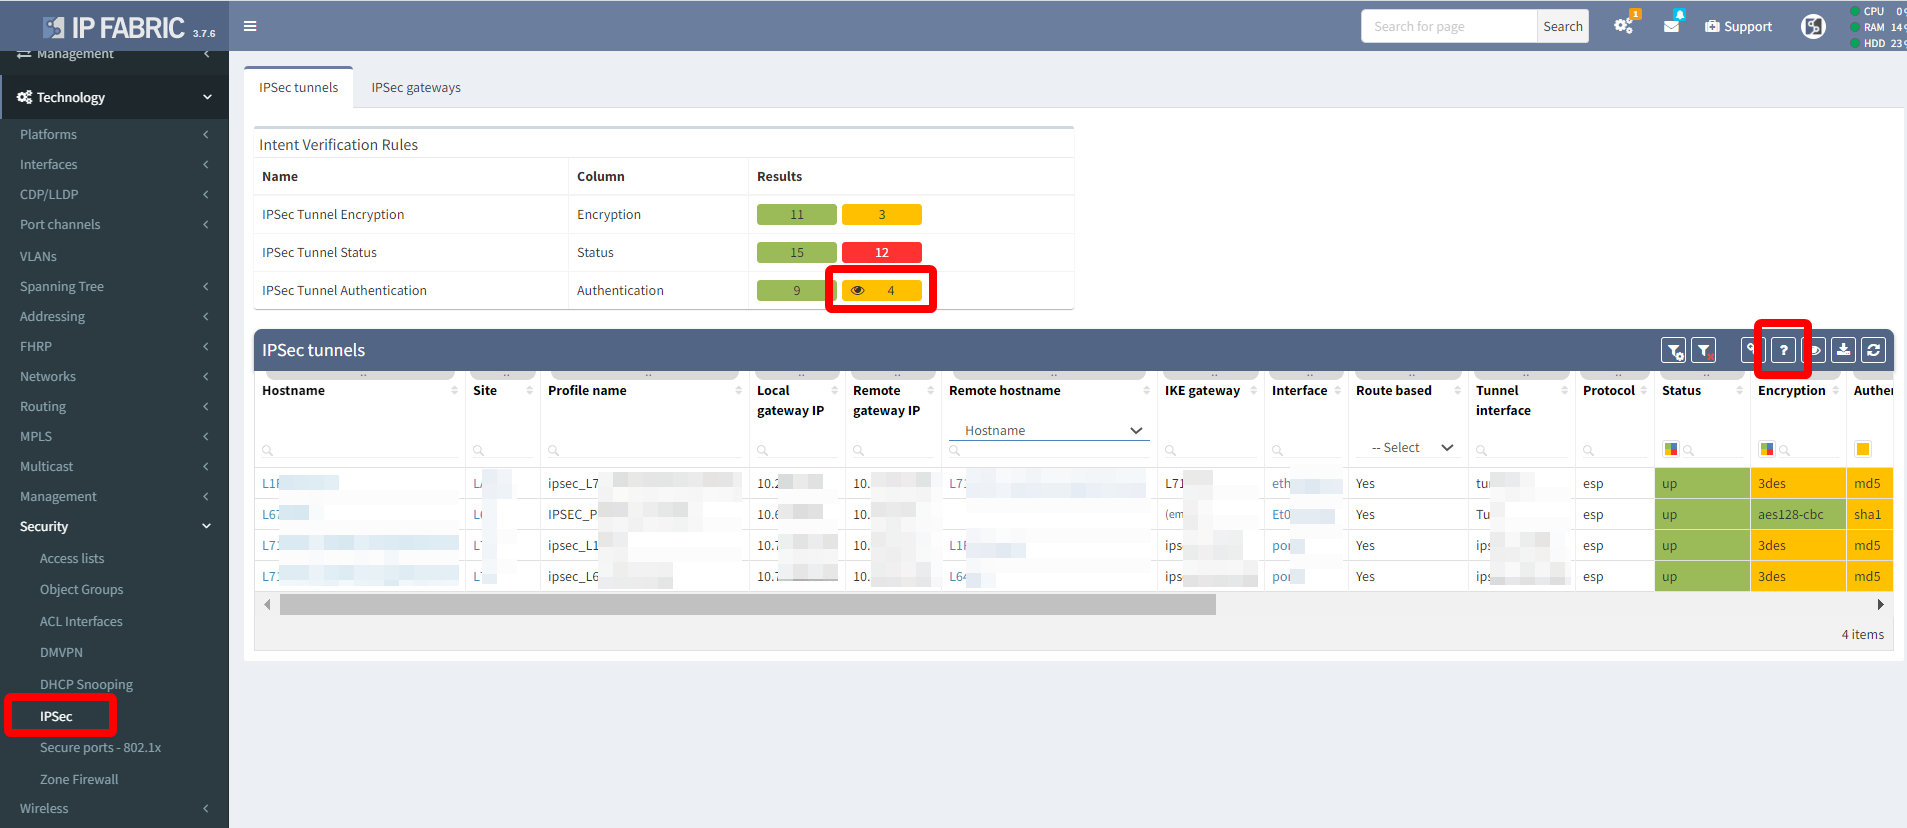
In the IP Fabric interface, choose Security – IPSec from the menu on the left. Next, click the yellow box in the results section, adjacent to the “IPSec Tunnel Authentication” report item. Finally, click the “question mark” icon in the toolbar:
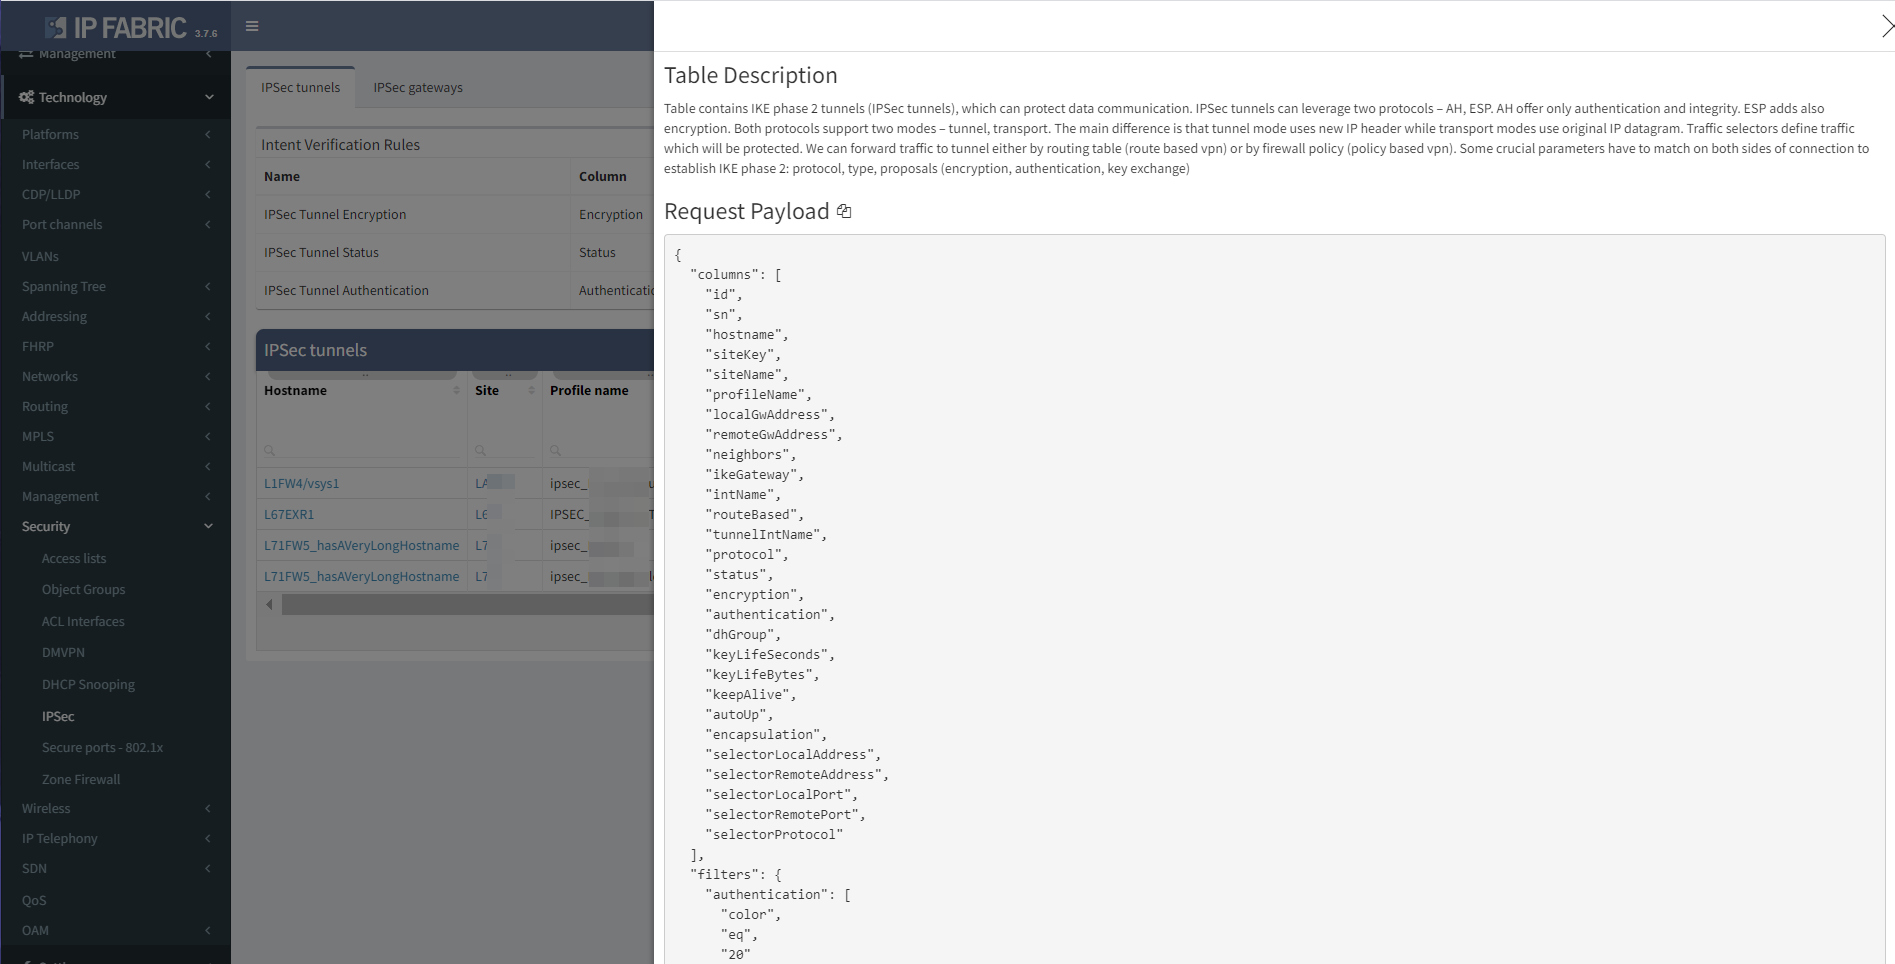
This displays the “Table Description” and shows the JSON structure and path to the data, making it easy to identify which elements to reference in our PRTG REST Custom Sensor:
Once you’ve identified the API request to use, simply add a REST Custom Sensor to the IP Fabric device in PRTG and configure it:
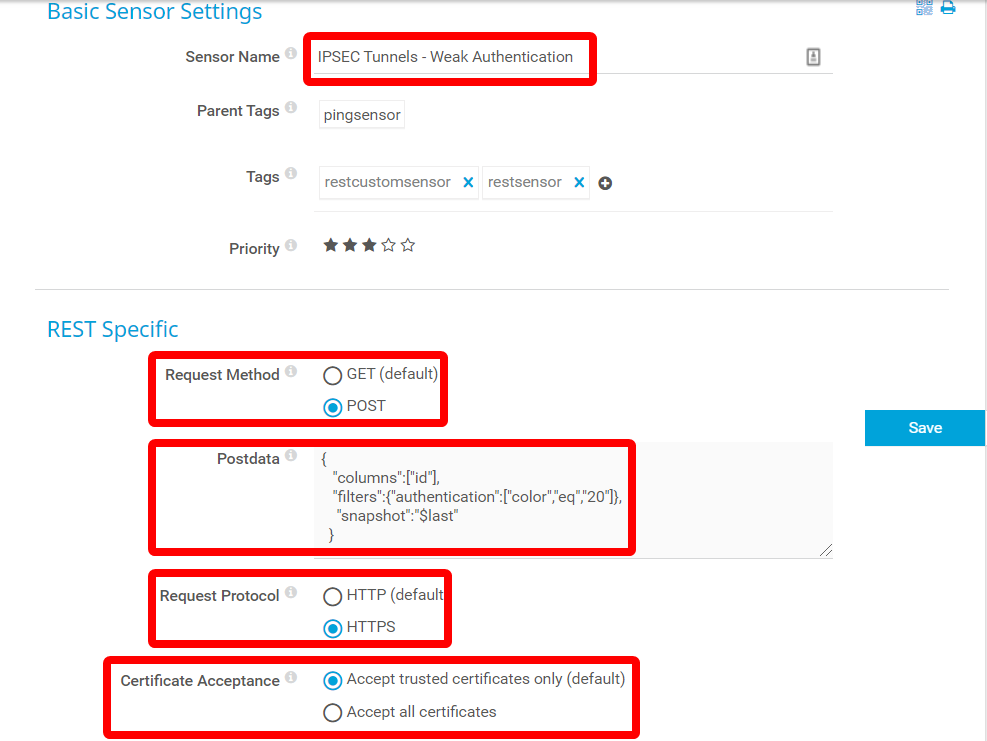
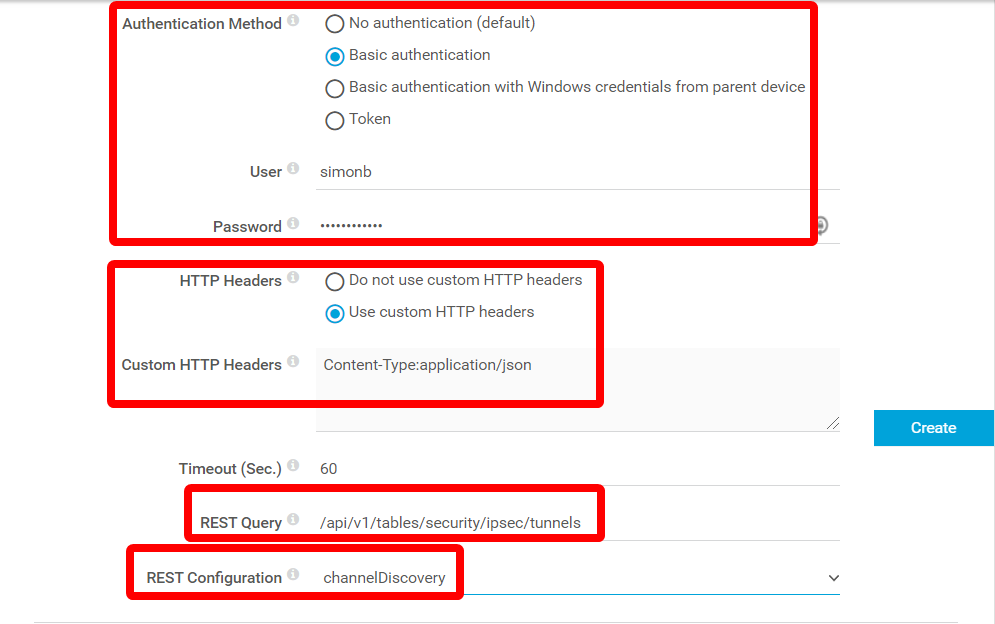
There are few things to note:
-
For the post data, we only need to use three elements from the API call. Firstly, we need the “columns” entry. Secondly, we need a “filter” that defines the data to return. In this case, it’s just the records with an “authentication color” value of 20 - IP Fabric uses color values to indicate status. Here, a color value of “20” equates to a “warning” state. Finally, we need a “Snapshot” value which tells IP Fabric which network snapshot to process. A value of “$last” will process the most recent snapshot.
-
Adjust the “Request Protocol” to match your environment and provide appropriate credentials.
-
A Custom HTTP Header is needed to ensure the data is returned as JSON
-
The REST query field should only contain the part of the URL that comes after the IP address. PRTG will prepend the IP when it submits the query.
-
Finally, you can use the “Channel Discovery” REST Configuration to create channels for all values returned by the query. This will look like this:
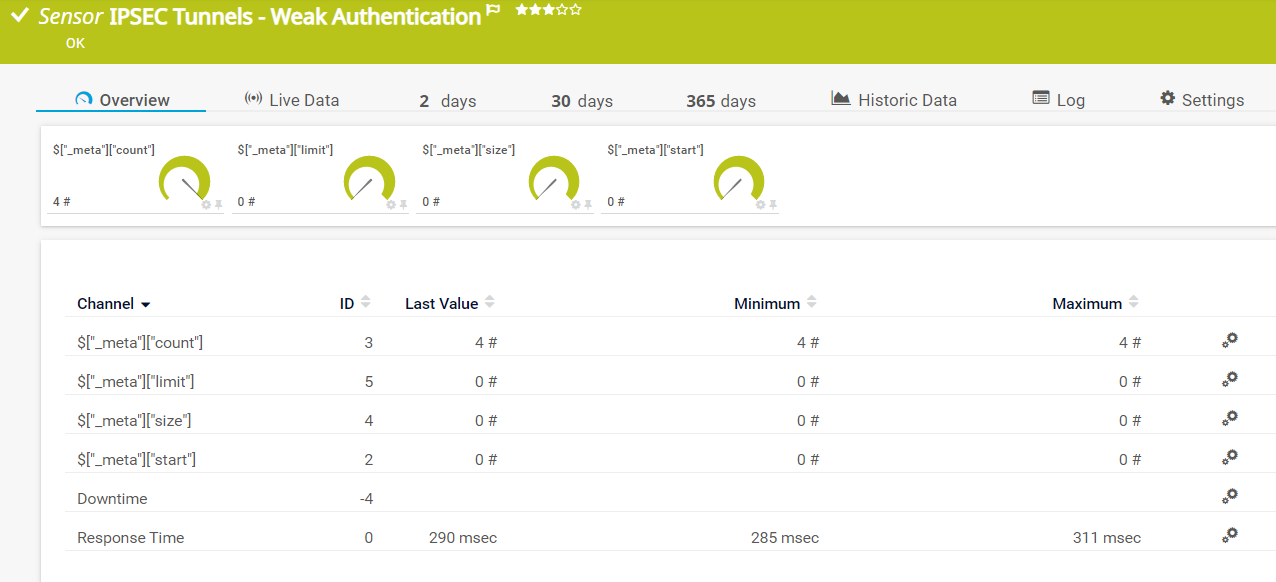
This is useful for testing which channels are created by the sensor. But as we can see, several of the channels are of no real use, we’re only interested in the “Count” value – how many of our IPSec Tunnels have weak authentication. We can tidy the display up by using a custom channel configuration template for the sensor.
Using a text editor, create a file called IPF_Count.template, that looks like this:
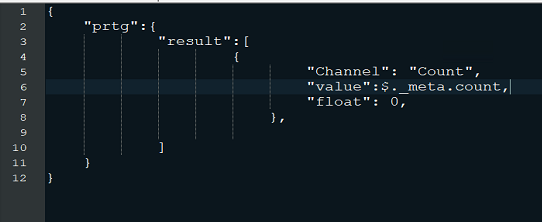
And save it to the “rest” folder on your PRTG server - C:\Program Files (x86)\PRTG Network Monitor\Custom Sensors\rest.
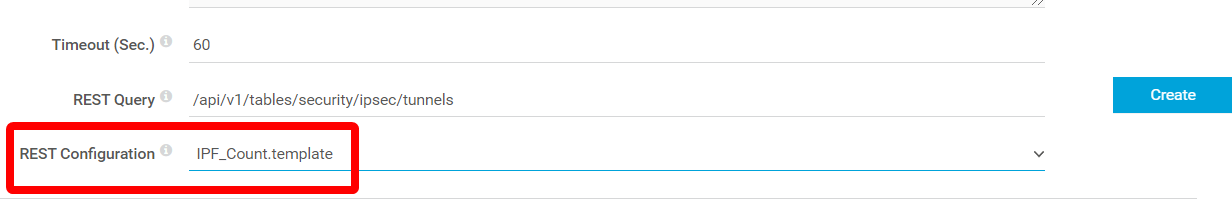
Unfortunately, there’s no way to change the chosen sensor template once it’s been used to create the default sensor channels, so you will have to recreate the sensor using the new template. Follow the same steps as above, but this time, choose “IPF_Count” instead of “channelDiscovery” for the REST Configuration:
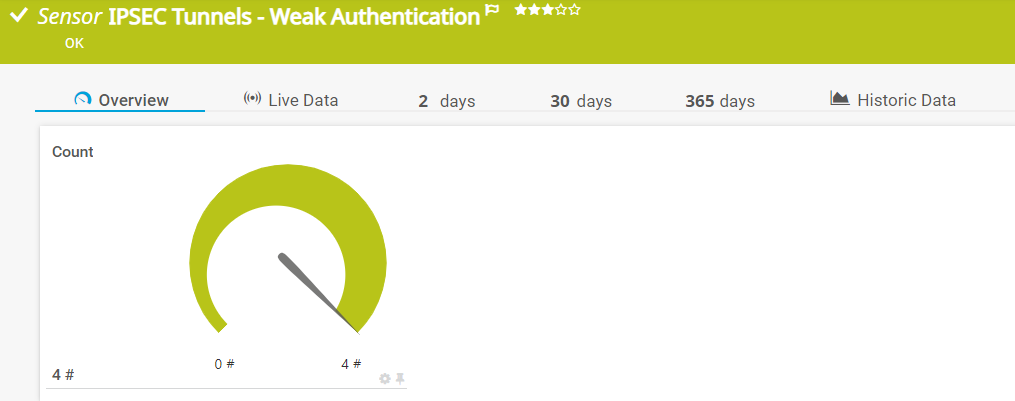
This will give a much neater and meaningful channel definition:
As we’ve seen, using REST Custom sensors of PRTG, it's easy to tap into the pervasive and powerful API of IP Fabric. Combining the breadth of monitoring across IT, OT, IoT and healthcare of PRTG with IPFabric’s deep-dive automated network performance assurance platform provides administrators with a fantastic insight into the health and efficiency of their networks. This, in turn, allows them to improve the service delivered to their customers, as well as making sure the network meets any mandatory compliance requirements.
How do you ensure that your network environment performs efficiently and securely? We look forward to reading your comments!


