 Published by Guest Author
Last updated on March 03, 2022
•
8 minute read
As networks become ever more critical to the operation of your business, complexity continues to increase. So you need to be sure that PRTG is genuinely giving you full visibility of all network devices. IP Fabric can help you answer the question, "Am I really monitoring all of my network"? Walk with me and I'll explain how.
Inventory
The first key element of IP Fabric's functionality is a class-leading discovery process. It starts by crawling your network to discover all the active network devices. It then analyses their configurations, relationships and interactions. And what happens to be the single most important part of ensuring that PRTG has complete visibility of your network? Validating that the list of devices in PRTG actually matches with the devices that are in your network, of course! This topic is becoming increasingly important, especially for large infrastructures.
So, IP Fabric verifies that you have an accurate list of active devices providing you with network service, and how they are configured. Then our open RESTful API gives external platforms direct access to that up-to-the-minute inventory. To complete the picture, IP Fabric sends out Webhook triggers to an external system when its snapshots are run. If new devices are discovered, PRTG can be automatically updated via its API, and you can receive notification within minutes via your preferred method – even through chat systems like Slack! PRTG need never be out of date.
 Device configuration
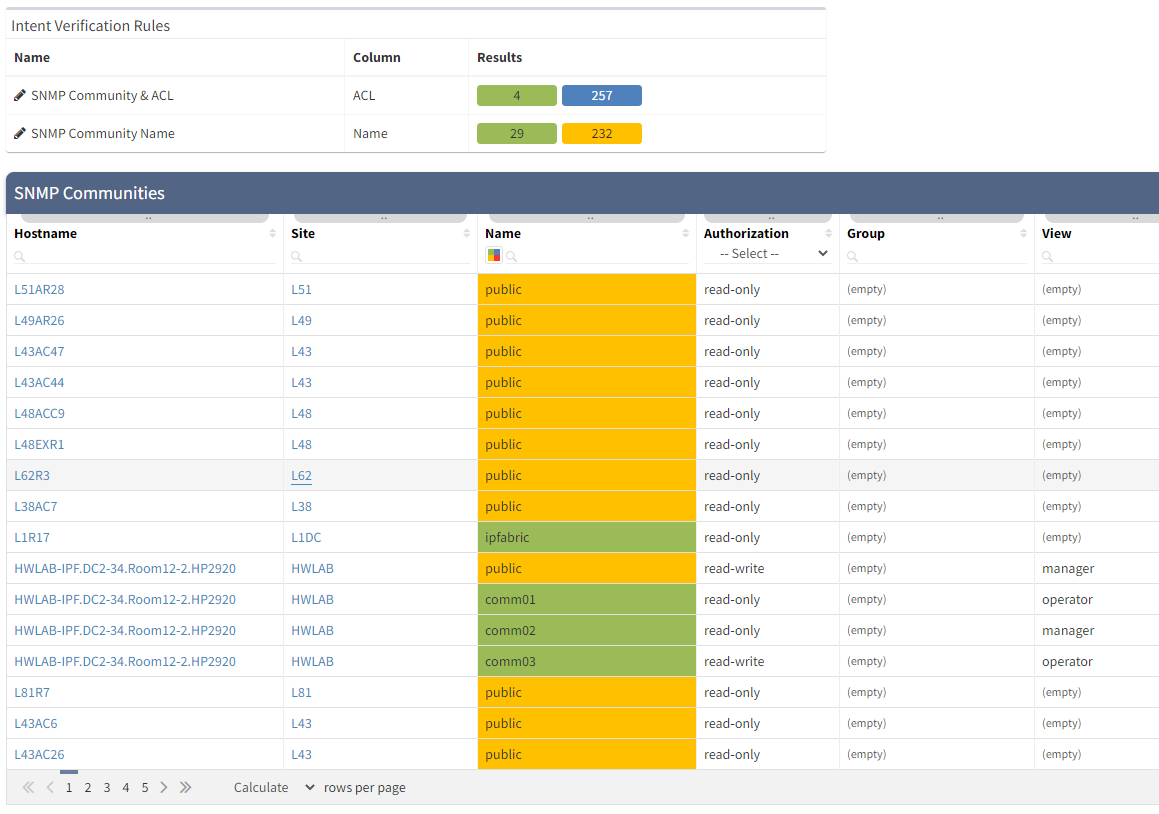
Once the inventory is confirmed as being up-to-date, you need to check that devices can be monitored by your system. For this, there are a couple of config checks that need to be carried out on the devices in question. First, you need to be sure that SNMP is enabled and you have the correct credentials for the monitoring method (eg SNMP v2 communities, or SNMP v3 users). Then, you need to ensure the device will allow access to your monitoring requests from your system. This means checking configuration for ACLs and if they exist, validating that they allow the desired access.
IP Fabric retrieves all of the configuration and state data from network devices and stores it in its network model. Simple Intent Verification Rules are then used to check that the device configuration matches that required by PRTG. If they don't match, the rules will flag the device as needing attention and you’ll need to go configure them as required.
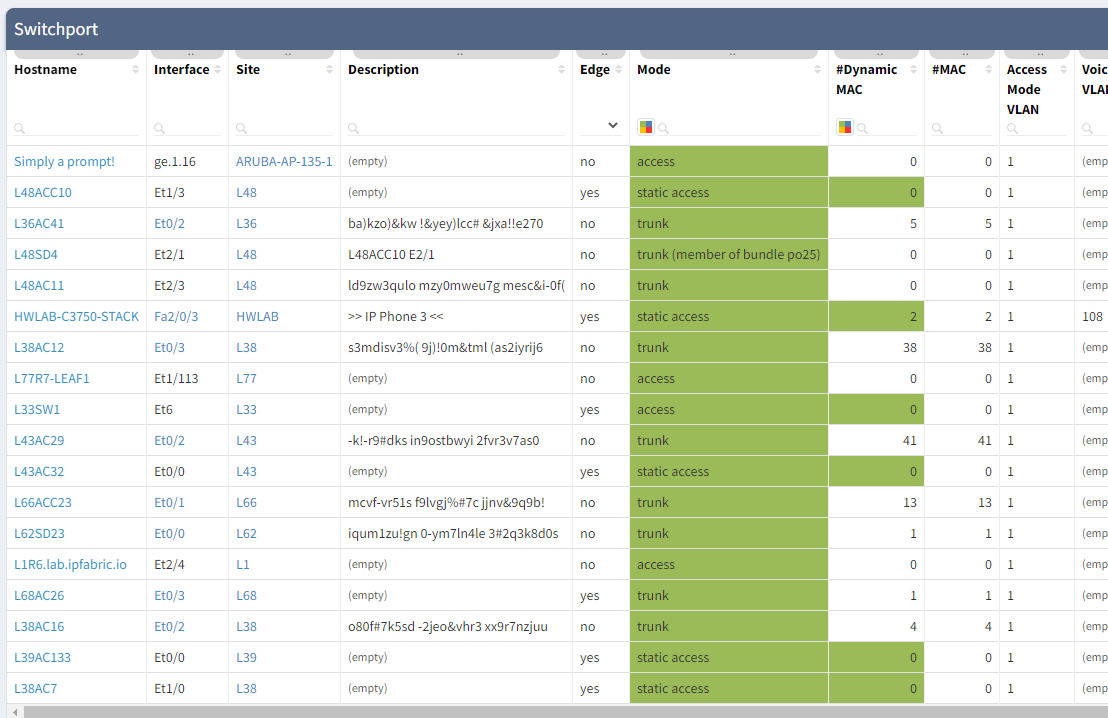
Critical interfaces
Once a device is added, it isn't enough to just check that it remains active in the network. Specific interfaces should then be monitored for state (up or down, active or disabled), and utilization should be measured (usually in % of maximum available bandwidth). And it's not enough to simply track every interface on every device: a lot of CPU time would be wasted in the process, generating huge amounts of output with little real value. False positives and alert fatigue that result from reporting every single transition of client-side network ports often obscure real issues.
In order to provide an accurate picture, understanding the topology of the network is vital. This then allows us to track which interfaces are critical to be monitored. The data that IP Fabric retrieves from the network includes a view of which interfaces are used to connect network devices, and how many users might be impacted by each port status. This is how we identify the most critical interfaces on devices and poll only those for status and utilization.
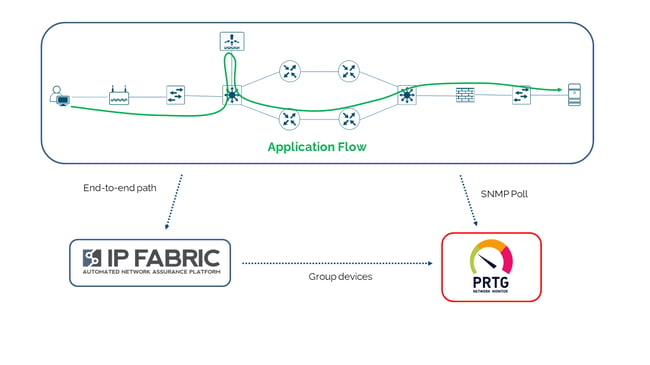
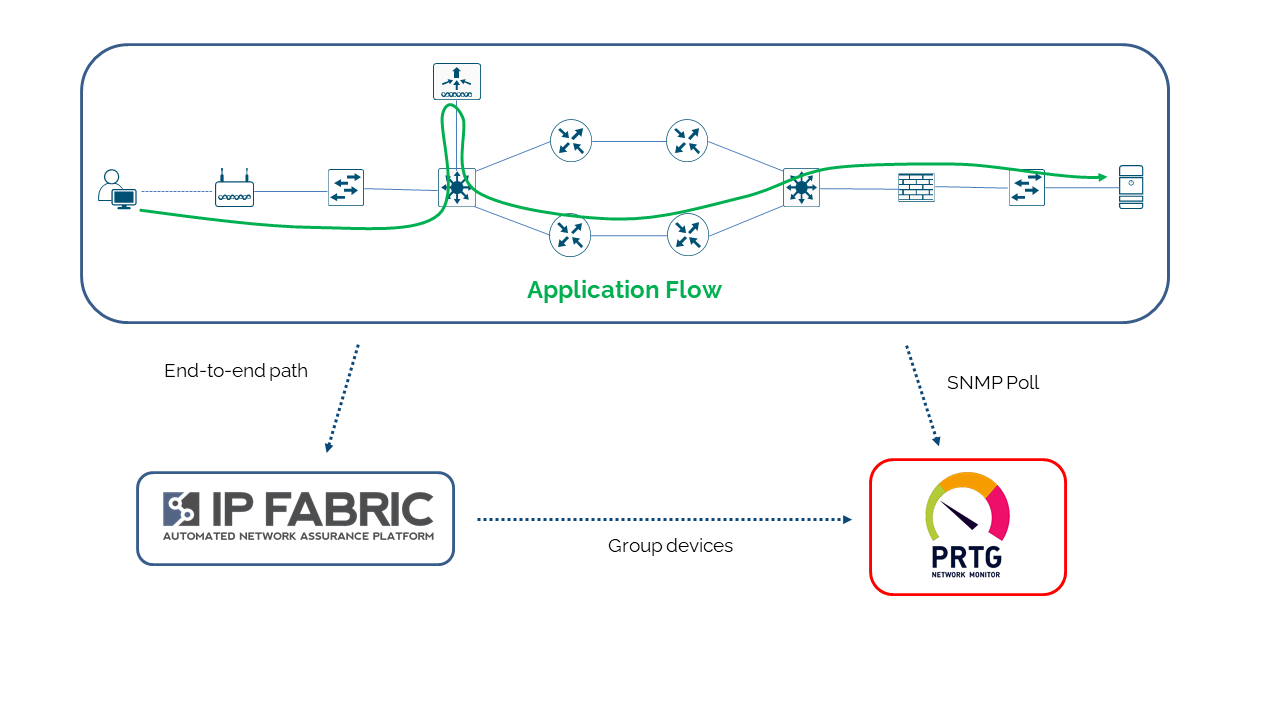
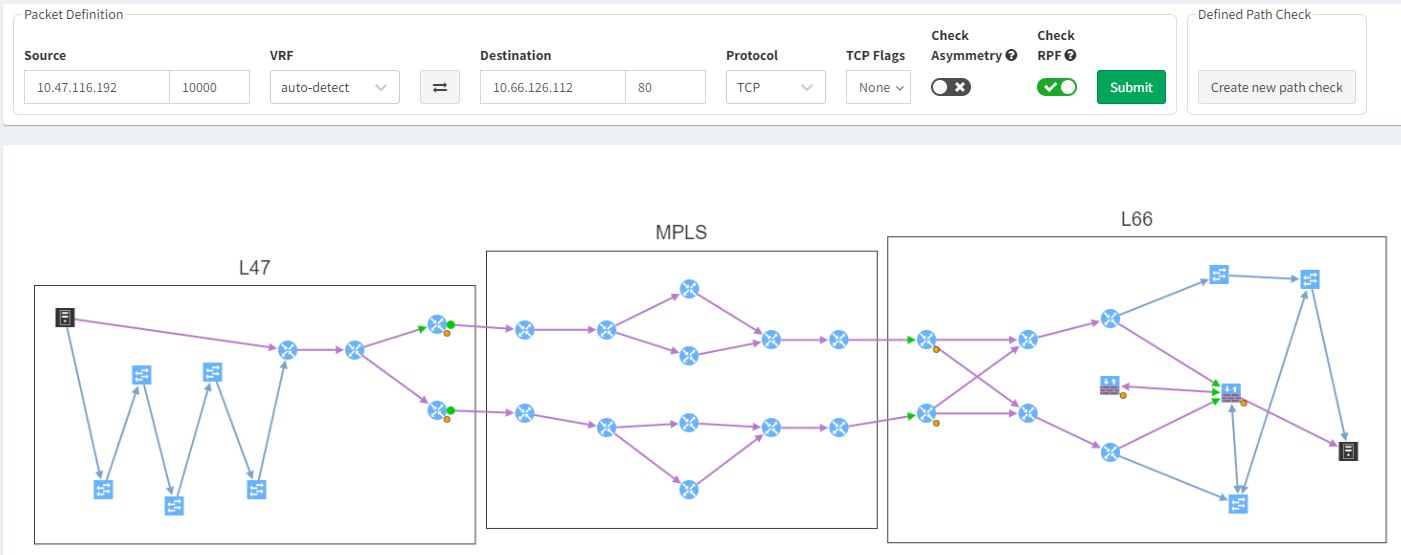
End-to-end-path
Why monitor the network at all? To ensure it is providing connectivity sufficient for a service to be available to its consumer. But how do you know which devices are critical to which service?
IP Fabric has an end-to-end path simulation capability, with which you are able to quickly determine the links and nodes that an application will use to deliver service to a consumer in a given location. The simulation also gives you the ingress and egress interface details for the nodes in the forwarding path. And so through the APIs, you can use the data from IP Fabric to bundle devices and interfaces into monitoring groups that represent or potentially impact the availability of a particular application service. This end-to-end path is validated every time a snapshot is taken of the network.
With the data in the IP Fabric platform, the possibilities are limitless – imagine a scenario where the images of an end-to-end path can be used within PRTG as a map for monitoring. Or being able to click through on the device details in IP Fabric to show monitoring statistics. While not on the product roadmaps, these kinds of functionality are feasible with the data and the API access available.
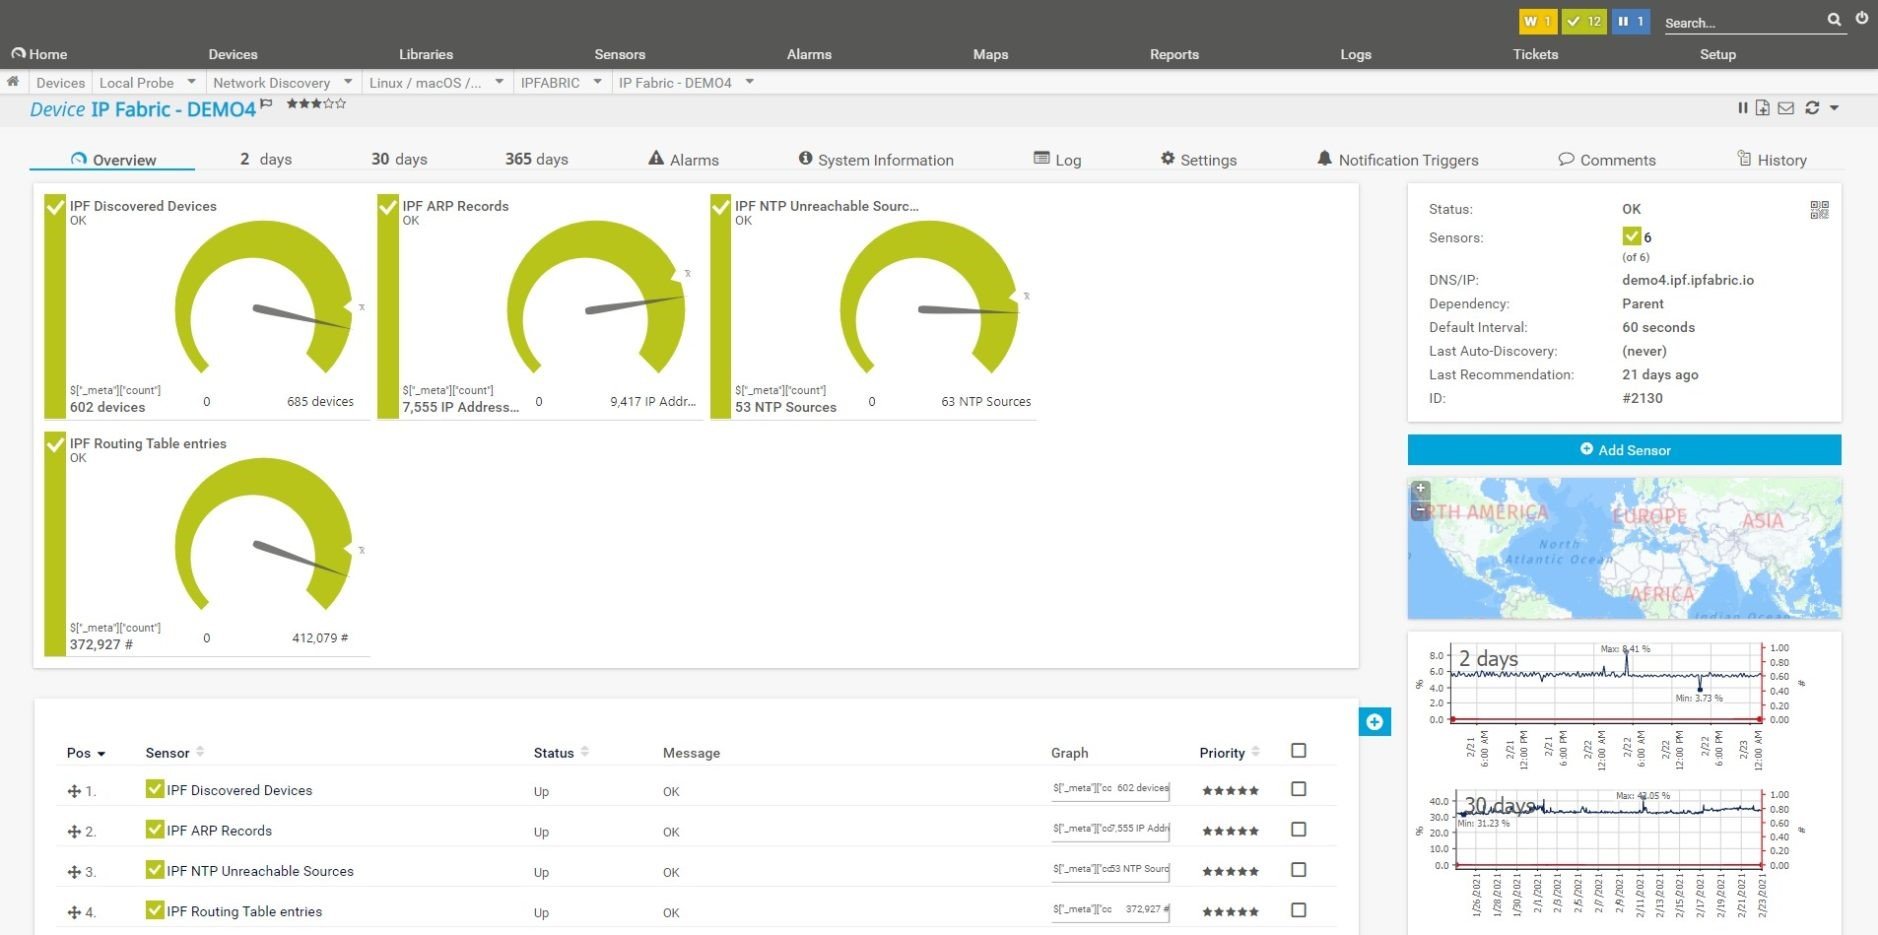
Monitoring IP Fabric itself
Each time a snapshot is run in IP Fabric, the network is re-discovered. This allows you to track inventory, topology, state and configuration over time. And when a snapshot completes, Intent Verification Rules are run over new, fresh data, producing new assurance and compliance reports.
The results of this process are available over API, so we can monitor those values themselves over time. By including a probe in the monitoring system to poll API responses, you can produce graphs to show trends in state data and compliance rules, using PRTG to enhance the capabilities of IP Fabric!
Conclusion
IP Fabric and PRTG work together to maximize visibility of your network! As we’ve seen:
- IP Fabric can validate that PRTG is monitoring a correct, up-to-date network inventory
- You can ensure that your network devices are correctly configured to allow monitoring to happen
- You can identify which devices and interfaces are critical for your infrastructure and applications and focus on these and
- You can identify trends in forwarding behavior, configuration and other metrics not easily identified over SNMP
But also, IP Fabric and PRTG Network Monitor or PRTG Enterprise Monitor can be used in tandem in your operational processes to help troubleshoot issues in network behavior. Identify problems before they occur with IP Fabric’s Intent Verification Rules, then check on the devices in question in PRTG for errors (for example).
And you can build better automated processes by accessing both systems over their respective APIs and pushing that data into other systems. Imagine a scenario where a user might generate an incident in your ITSM – as you raise a ticket, you might fetch the end-to-end path details and configuration changes from IP Fabric, then monitoring details for the devices and interfaces along that path from PRTG, and write them all into the ticket directly, saving the investigating engineer time and investigative effort.
To find out more, check out IP Fabric’s YouTube channel for demos of our PRTG integrations. Look at our other blog posts on the website to learn how our partners and customers are integrating IP Fabric with their wider operational ecosystem. And if you're interested in a free trial of our platform, take a look at ipfabric.io/trial.


