 Published by Sascha Neumeier
Last updated on August 13, 2024
•
6 minute read
Our latest version of Paessler PRTG Network Monitor is now available in the stable release channel.

PRTG version 21.3.71 includes the new sensor types Beckhoff IPC System Health and Modbus RTU Custom, as well as the experimental sensor types AWS RDS v2 and Redfish Virtual Disk. We have also noticeably improved the performance of PDF and HTML reports.
i What's new in release 21.3.71?
- The new Beckhoff IPC System Health sensor monitors the system health of a Beckhoff Industrial PC (IPC) via OPC UA.
- The new Modbus RTU Custom sensor connects to a Modbus RTU server and monitors up to five values returned by the device.
- You can add an experimental AWS RDS v2 sensor that monitors various metrics of your RDS instances.
- You can add an experimental Redfish Virtual Disk sensor that monitors the virtual disks of your Redfish-capable servers.
- The MQTT Subscribe Custom sensor can calculate the difference between the last and the current value in its channels.
- PRTG generates your PDF and HTML reports much faster compared to previous versions.
- Various fixes and improvements for all parts of PRTG
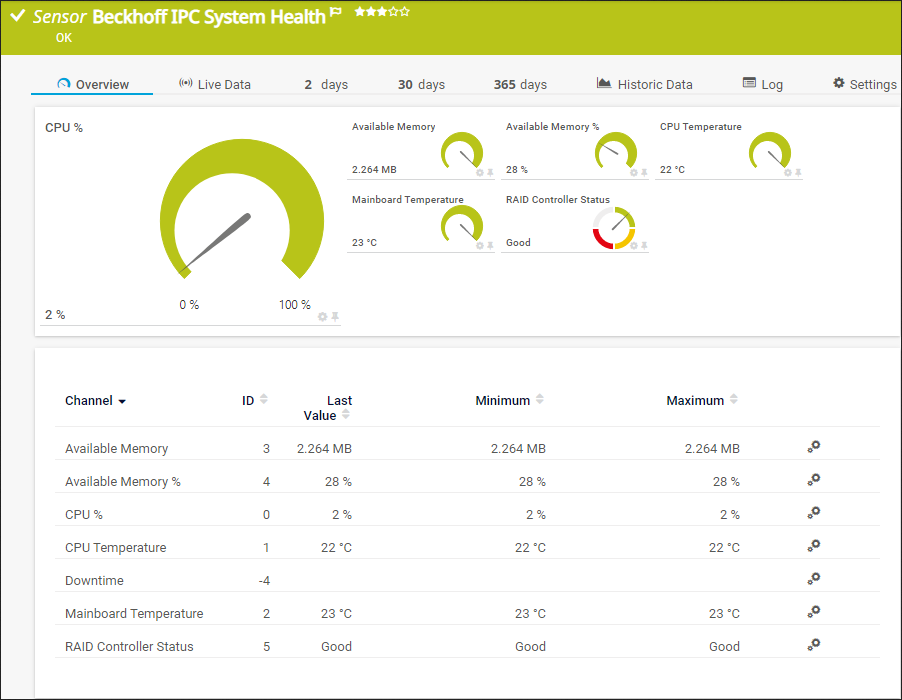
NEW: Beckhoff IPC System Health
The Beckhoff IPC System Health sensor monitors the system health of a Beckhoff Industrial PC (IPC) via OPC UA.
It shows available memory, CPU load, the temperature of CPU and mainboard, as well as the status of the RAID controller. With this new sensor type, you get to know if your production process is healthy and all systems are up and running. For more information about it, here is a blog post about it.
We initially released this sensor type as experimental sensor in PRTG 21.2.67.
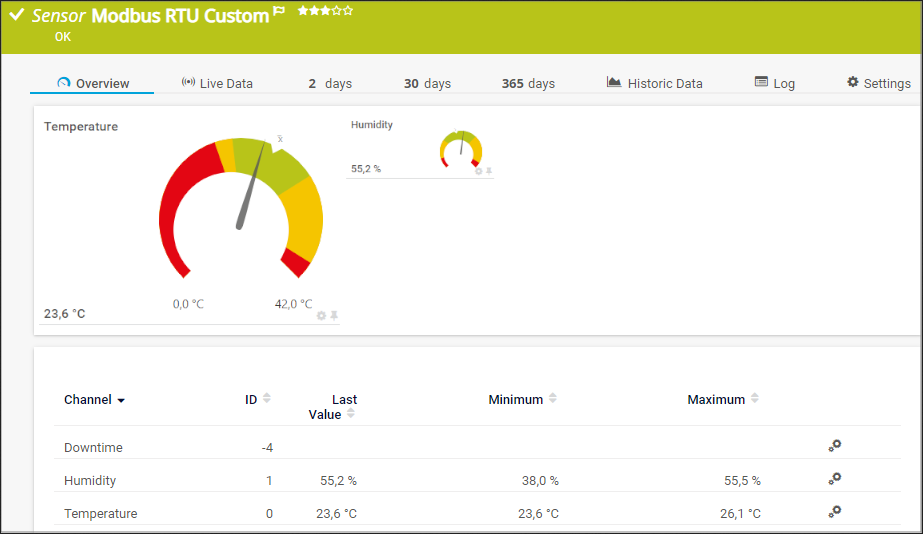
NEW: Modbus RTU Custom
The Modbus RTU Custom sensor connects to a Modbus RTU server and monitors up to five values returned by the device.
With this sensor type, you can monitor, for example, temperature, humidity, and more inside a rack in a data center. This way you can ensure your equipment operates within the defined ranges.
We initially released this sensor type as experimental sensor in PRTG 20.4.64.
EXPERIMENTAL: AWS RDS v2 and Redfish Virtual Disk
With PRTG 21.3.71, we release additional sensors for AWS and Redfish monitoring.
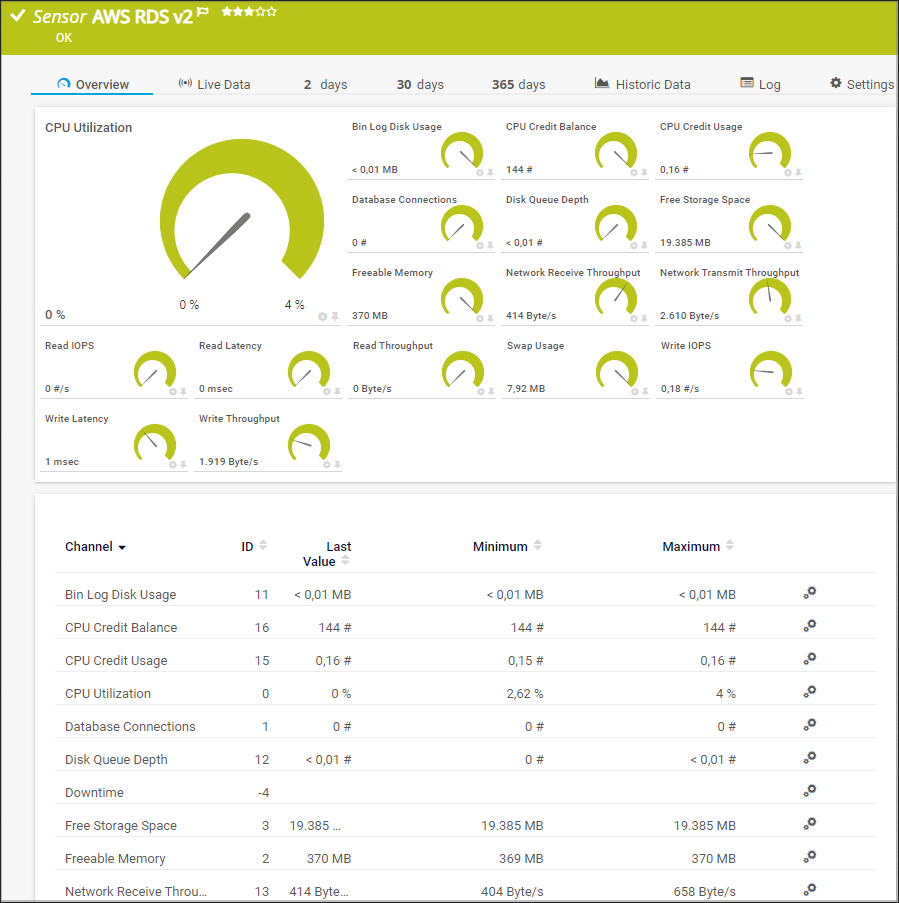
AWS RDS v2 sensor
The experimental AWS RDS v2 sensor monitors various metrics of RDS (Relational Database Service) instances to indicate their performance and will be the successor to the existing Amazon CloudWatch RDS sensor.
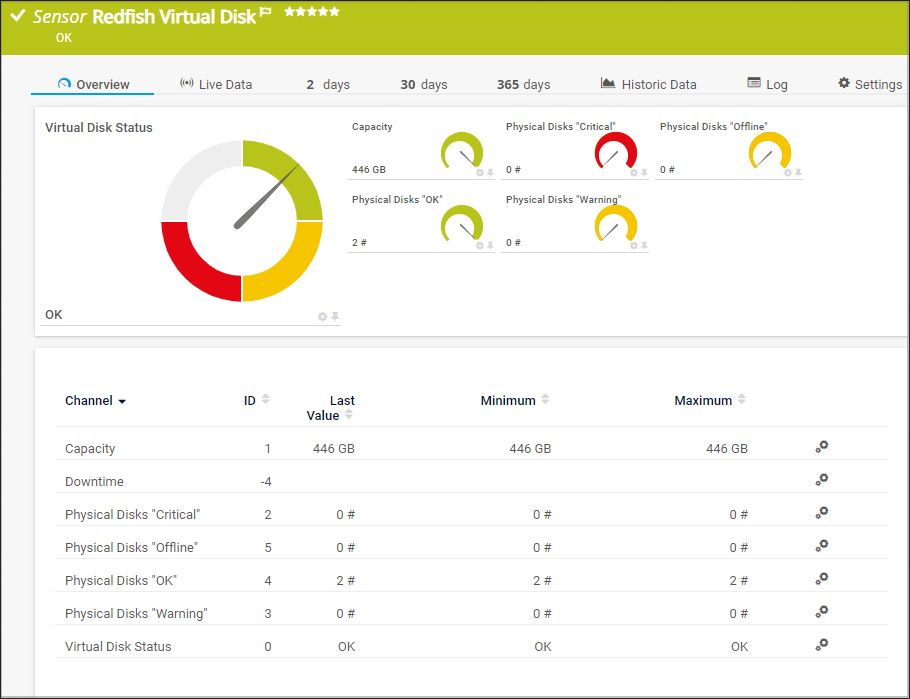
Redfish Virtual Disk sensor
“Wait, what is Redfish and why do I need it?”
The Redfish standard is a suite of specifications that deliver an industry standard protocol providing a RESTful interface for the management of servers, storage, networking, and converged infrastructure.
Redfish has been slated to replace the Intelligent Platform Management Interface (IPMI) for hardware management over the network.
With Redfish sensors, you can monitor server hardware in the data center using the Redfish protocol from the servers' management controllers like Lenovo XClarity, HPE iLO, or Dell iDRAC.
To learn more, read our brand-new KB article I want to know which of my systems support the Redfish System Health sensor. Can you help me?
The experimental Redfish Virtual Disk sensor monitors the virtual disks of Redfish-capable servers and shows their capacity and status.
With this sensor, you can ensure that the disks are up and running and detect any possible failures before they occur. In case of a drive failure, you see if the failover drive has taken over successfully and know what the problem was and which disk drive failed, helping to fix the problem as soon as possible.
...and much more
Our developers noticeably improved the report performance! PRTG now generates PDF and HTML reports much faster compared to previous versions. You will especially notice this performance improvement when running reports with a lot of sensors and historic data on large installations.
The MQTT Subscribe Custom sensor now supports channels from the value type Delta (counter) to calculate the difference between the last and the current value. Our busy devs also added several new filter options to the experimental Local Folder sensor and XML support to the experimental REST Custom v2 sensor.

Also check out our PRTG release notes
All in all, PRTG 21.3.71 includes 92 resolved issues. We implemented 35 features and stories, fixed 34 bugs, and finished 23 tasks and ToDos. Find all the details on our release notes page.
If you are a proud user of our cloud solution PRTG Hosted Monitor, you’ll get the latest version of PRTG automatically with the next rollout cycle.
Planned features on our public roadmap
We also offer a public roadmap of PRTG on our website. There, you can read about which features we are currently working on and what kinds of things we want to implement in PRTG in the future.


