 Published by Shaun Behrens
Last updated on January 23, 2024
•
5 minute read
Industrial PCs have many uses within industrial Operational Technology (OT), such as controlling processes and machines, data acquisition, or acting as front-ends for control computers in distributed processing environments. And when it comes to key players in the PC-based automation market, Beckhoff Automation is considered one of the pioneers. In fact, their IPCs can be found in many industrial environments. Because of their crucial role in industrial architecture, it’s important to monitor them to make sure they are performing as they should be. Here’s how to monitor Beckhoff IPCs using Paessler PRTG, monitoring software that brings IT and OT into one view.
Beckhoff IPC health
Recently, PRTG has expanded on its IT monitoring to bring OT and IIoT elements into its view. It has done this in two ways: firstly, by providing support for common OT protocols and standards, like OPC UA, Modbus TCP, and MQTT. Secondly, PRTG provides out-of-the-box sensors for monitoring devices and systems that are commonly found in OT infrastructure.

A good example of the latter is the Beckhoff IPC System Health sensor (think of a sensor as a data collector for PRTG). This sensor can be configured in PRTG to retrieve valuable data about the condition and status of a Beckhoff IPC. Here are the metrics you can monitor:
| Metric | Description |
| Available Memory | The available memory in bytes |
| Available Memory % | The available memory as a percentage of the total memory. |
| CPU % | The CPU load in percent |
| CPU Temperature | The temperature of the IPC CPU in degrees Celsius. |
| Mainboard Temperature | The temperature of the mainboard in degrees Celsius |
| RAID Controller Status |
The status of the RAID controller
|
In PRTG, these metrics are displayed as sensor channels. Here you can see what the sensor looks like:
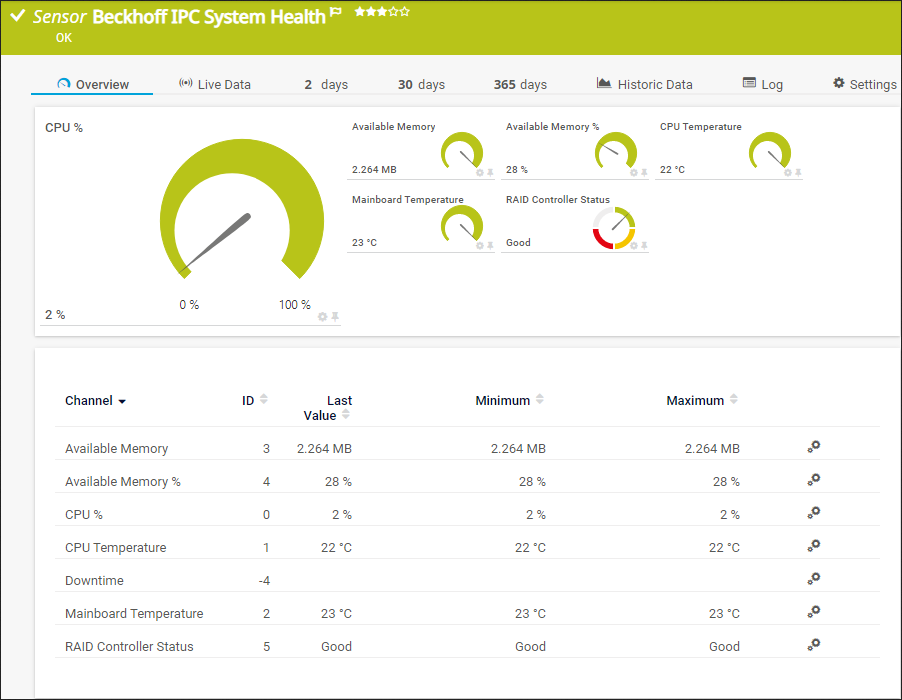
PRTG lets you set threshold values for each channel, and if those values are exceeded, you will get an alert. For example, if the CPU temperature reaches a defined value, the gauge on the sensor will turn red and you'll know there is an issue with the CPU overheating. You can also configure notifications to be triggered and sent to you via E-mail, SMS, and other delivery mechanisms, thus ensuring you're updated on the status of the Beckhoff IPC at all times.
For more details about the sensor and how to set it up in PRTG, refer to the Beckhoff IPC System Health sensor section in our manual.
The bigger picture
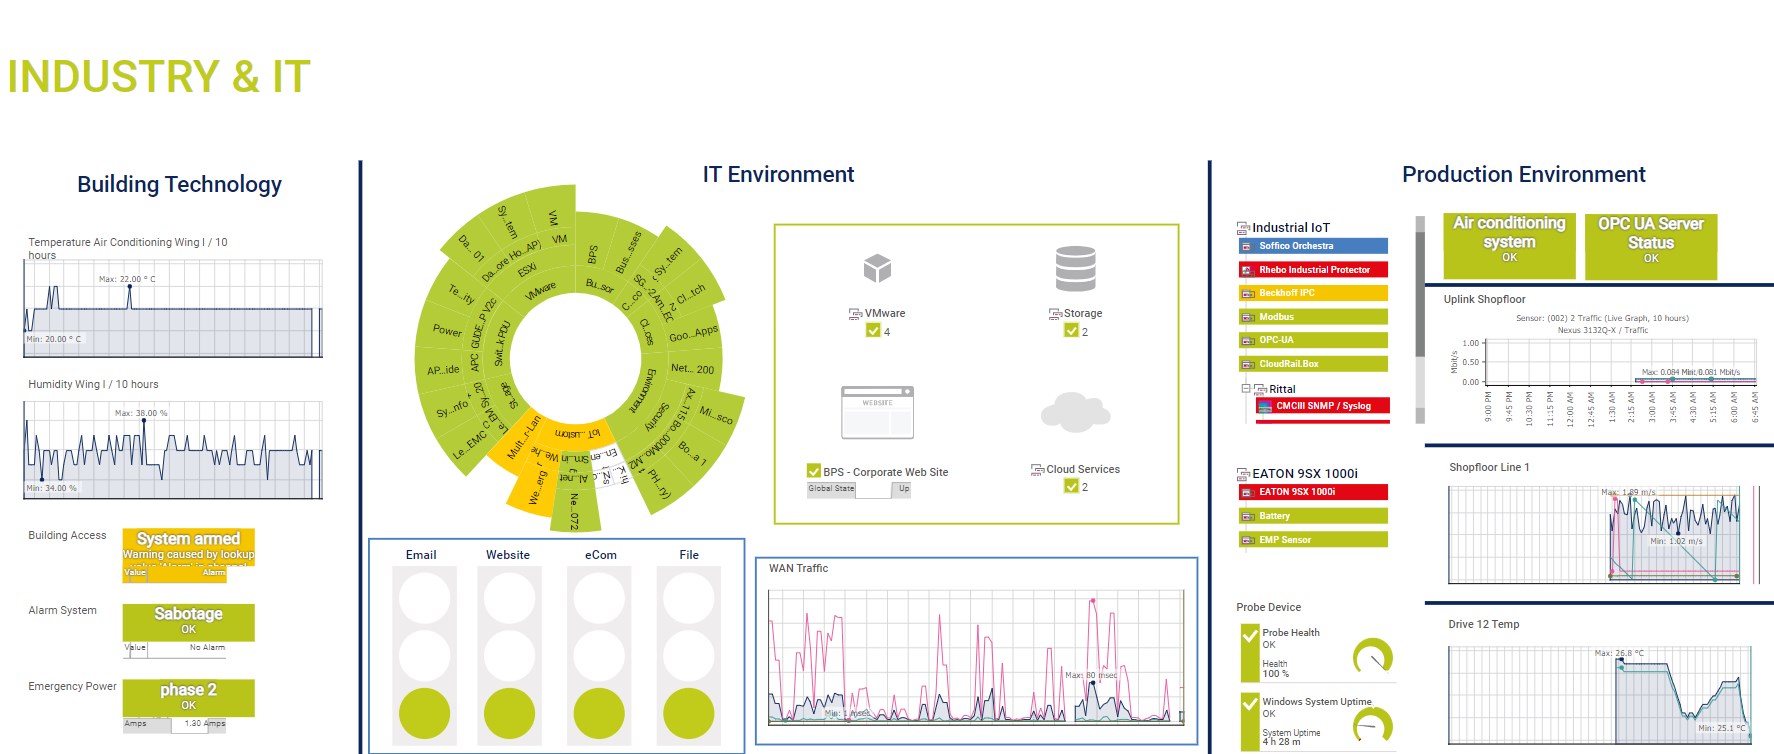
As useful and important as this granular view is, it's the overview that's even more important - and that's where the real value of PRTG lies. You can show the health of one or multiple Beckhoff IPCs in a high level dashboard that also shows you the health of your OPC UA server, MQTT broker, IT components, and more.
Here the health of a Beckhoff IPC is shown as part of a dashboard showing the health of the production environment, IT environment, and building facilities (you can see it in the "Industrial IIoT" subsection):
There are many possibilities, and I've already provided industrial dashboard examples here and here. If you have any questions, let me know in the comments!


