One of the greatest benefits of monitoring OT and IT in an industrial environment is the ability to put important information onto dashboards so that the right teams can see the right data. I’ve already written about how a dashboard can provide a good overview of IT and OT convergence. Now, with this article, I’ll take a look at another example of dashboards in industrial IT. This time, we show the health and status of an industrial cabinet and its contents.
As always we are using Paessler PRTG to monitor. PRTG provides sensors that can monitor industrial environments using protocols and standards like MQTT, Modbus TCP, and OPC UA, letting you bring IT and OT into a single view. You can, of course, also create dashboards to display the health and status of your industrial IT.
Getting an overview of the cabinet
A typical industrial cabinet has multiple pieces of hardware and many, many cables, and so it can be difficult to keep an eye on what's inside. The thinking behind the PRTG dashboard we created is that we wanted to have a way to quickly get an overview of the contents of the cabinet, but also be able to drill down to a more granular view if we need to.
Here is the overview, and later in this post you can see the granular, expanded view.
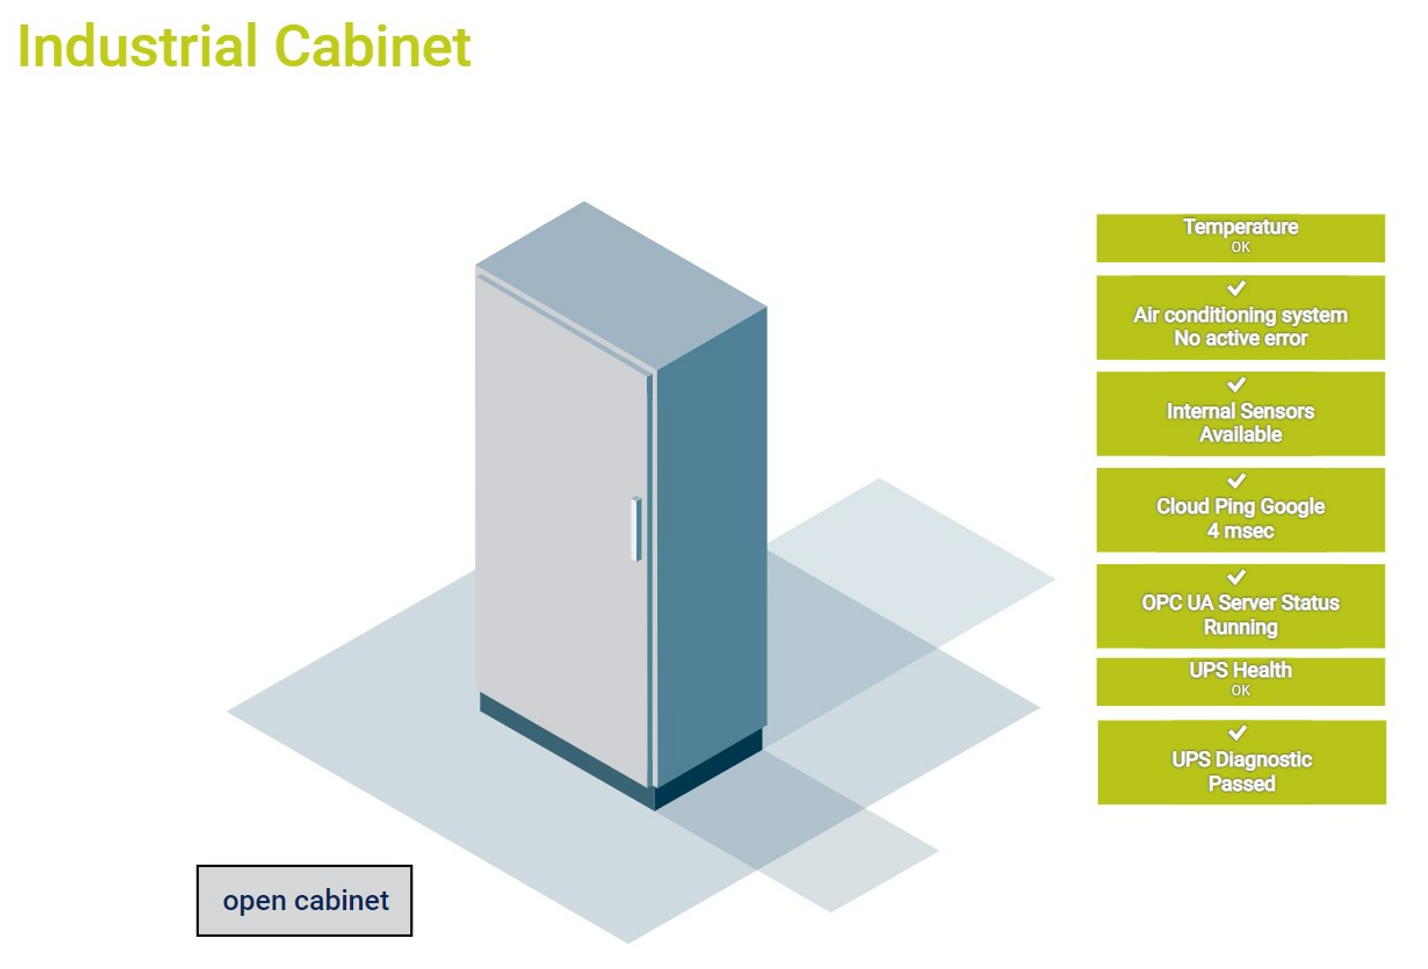
Here's what you can see at a glance:
- Temperature metrics
The cabinet in our example is cooled by a Blue e+ system that is connected to a Rittal IoT gateway. Additionally, there are IoT temperature sensors inside the cabinet for monitoring the current temperature, and these are also connected to the Rittal gateway. Using the CMC III Hardware Status sensor of PRTG, we are able to get the metrics we need from the Rittal gateway to ensure that not only is the temperature OK, but also that the AC system and IoT sensors are functioning properly. - Server status
Our cabinet contains an Industrial PC, which is running an OPC UA server. The PRTG OPC UA Server Status sensor lets us ensure that it is up and available. - UPS
Despite being critical to keeping industrial environments running, it's easy to forget about UPS systems in the dark corners of cabinets. And this would be a mistake, because there are many important things you need to keep an eye on: the health of the UPS device, the battery life, as well as how long the UPS can provide backup power if the main power supply fails are all good examples. Our dashboard shows the status of the UPS using SNMP sensors. - Cloud status
In the case that devices in the cabinet require an internet connection, it is also useful to know if the cloud service is available. To monitor this, we use our Cloud Ping sensor.
All this information is great for a quick glance at your dashboard, but if one of these sensors was orange or red (indicating a warning or down state respectively), you will need a more detailed view to start investigating the issue. Clicking on the dashboard will bring up an expanded view of the cabinet.
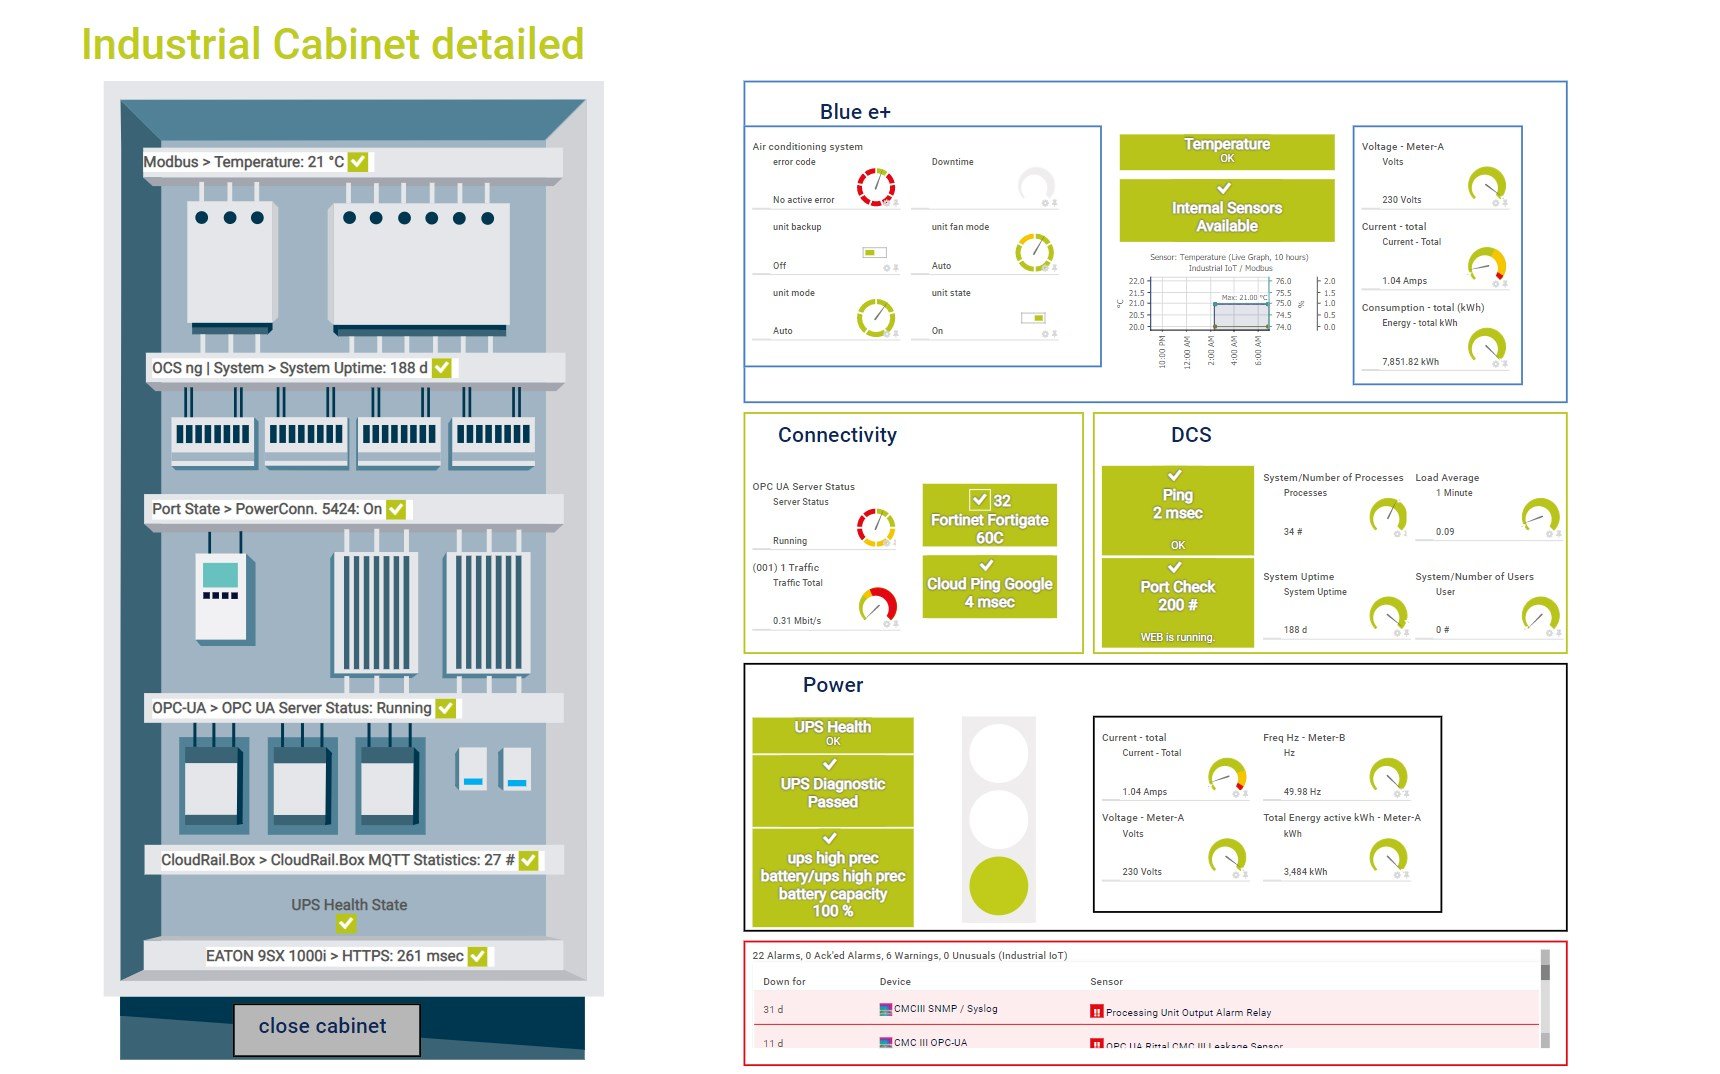
Here's a screenshot of the detailed dashboard (click on it for a larger view).
Now let's look at some highlights of what we can see:
Blue e+ health and temperature trends
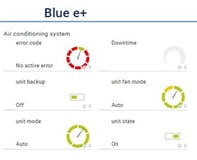 Here you can see more detailed metrics about the Blue e+ cooling system, such as the mode it's operating in, the fan mode, and the current state. Also included is a display of an error code. In this example, you can immediately see that there is no active error; however, if there was, the error code would be shown. This would help you to instantly take steps to alleviate the issue.
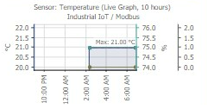 You can also see a graph showing the recent temperature values. This can help you spot historical trends and identify patterns that indicate potential issues.
As mentioned before, PRTG retrieves these metrics through the Rittal IoT gateway that the devices are connected to, using the CMC III Hardware Status sensor.
Connectivity
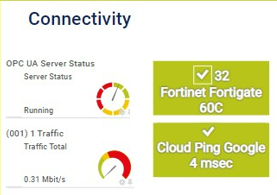 Here we can quickly see the connectivity of various devices in the cabinet, as well as bandwidth usage. We’re also monitoring the Fortinet Fortigate firewall using SNMP sensors. You can immediately see if a connection has failed, or if high bandwidth is slowing the system down.
DCS
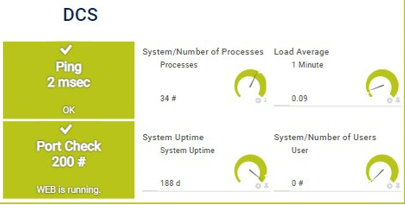 Keeping an eye on the DCS is critical too. Using the Ping sensor, PRTG continuously checks if the unit is up and available. We also monitor Port 200, which – in this example – provides access to a Web server running on the DCS.
Also of interest is the number of processes being handled by the DCS, the average load of processes per minute, and the number of systems and users connected to it. We can also see how long the system has been up.
Power
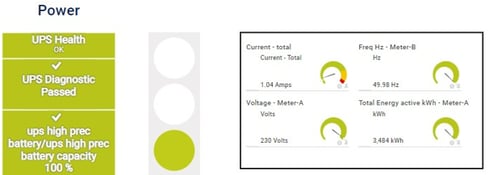 This collection of metrics gives us a detailed overview of the current power consumption (amps in use, frequency in Hz, voltage, and total energy usage in KWh).
I hope that this dashboard example helps you understand just how valuable monitoring your industrial cabinet – and in fact, your industrial IT – is. If you'd like to find out more, why not get in touch with us? Alternatively, leave us a comment or question below!
 Published by
