 Published by Shaun Behrens
Last updated on January 23, 2024
•
8 minute read
Holistic monitoring for industrial IT is a topic that we have covered on this blog many times before. We even put together a white paper about it. Essentially, holistic monitoring incorporates elements from IT and OT into one tool. One of the greatest advantages of this approach is that you can develop dashboards that deliver an overview of your entire industrial IT infrastructure. To demonstrate this, I will be writing a series of blog posts examining specific examples of dashboards for industrial environments that were created with Paessler PRTG monitoring software.
A combined view of IT and OT
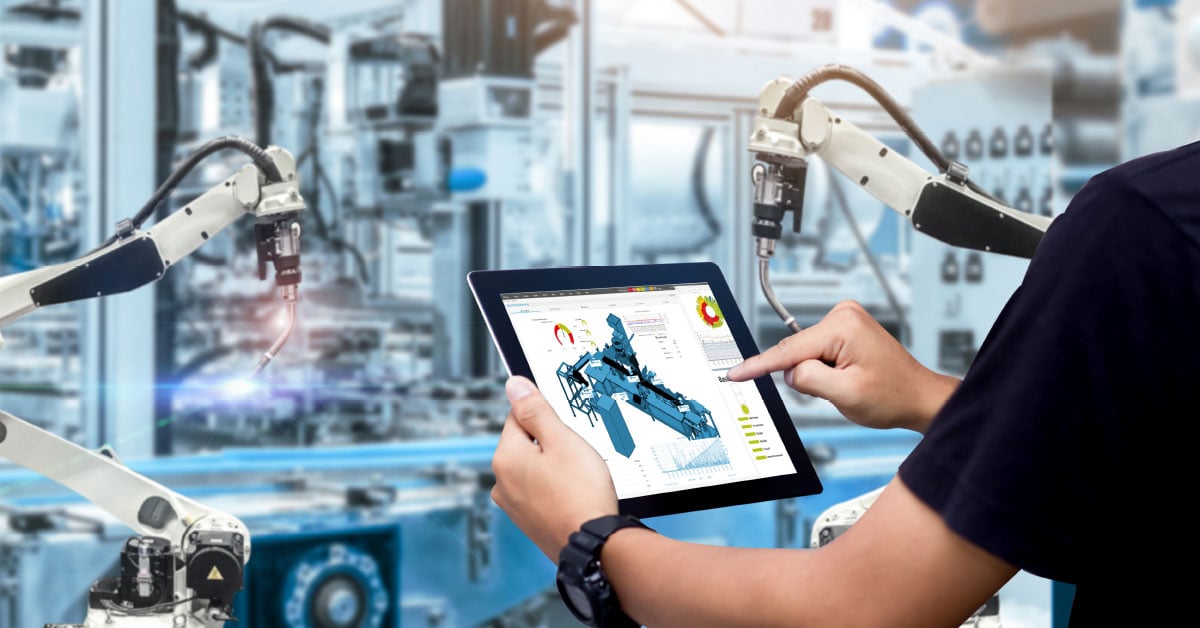
PRTG offers the capability to not only monitor IT devices, systems, and applications, but also OT elements. Because it "understands" common standards and protocols like OPC UA, MQTT, and Modbus TCP, PRTG can be used to monitor a wide range of industrial IT devices and systems. Additionally, functionality for getting data from IIoT devices means that you can get a comprehensive overview of many aspects of your industrial IT.
But what exactly could an overview look like? Here is an example. Click on the image to see an expanded view, and continue reading below for an explanation of what's in the dashboard.
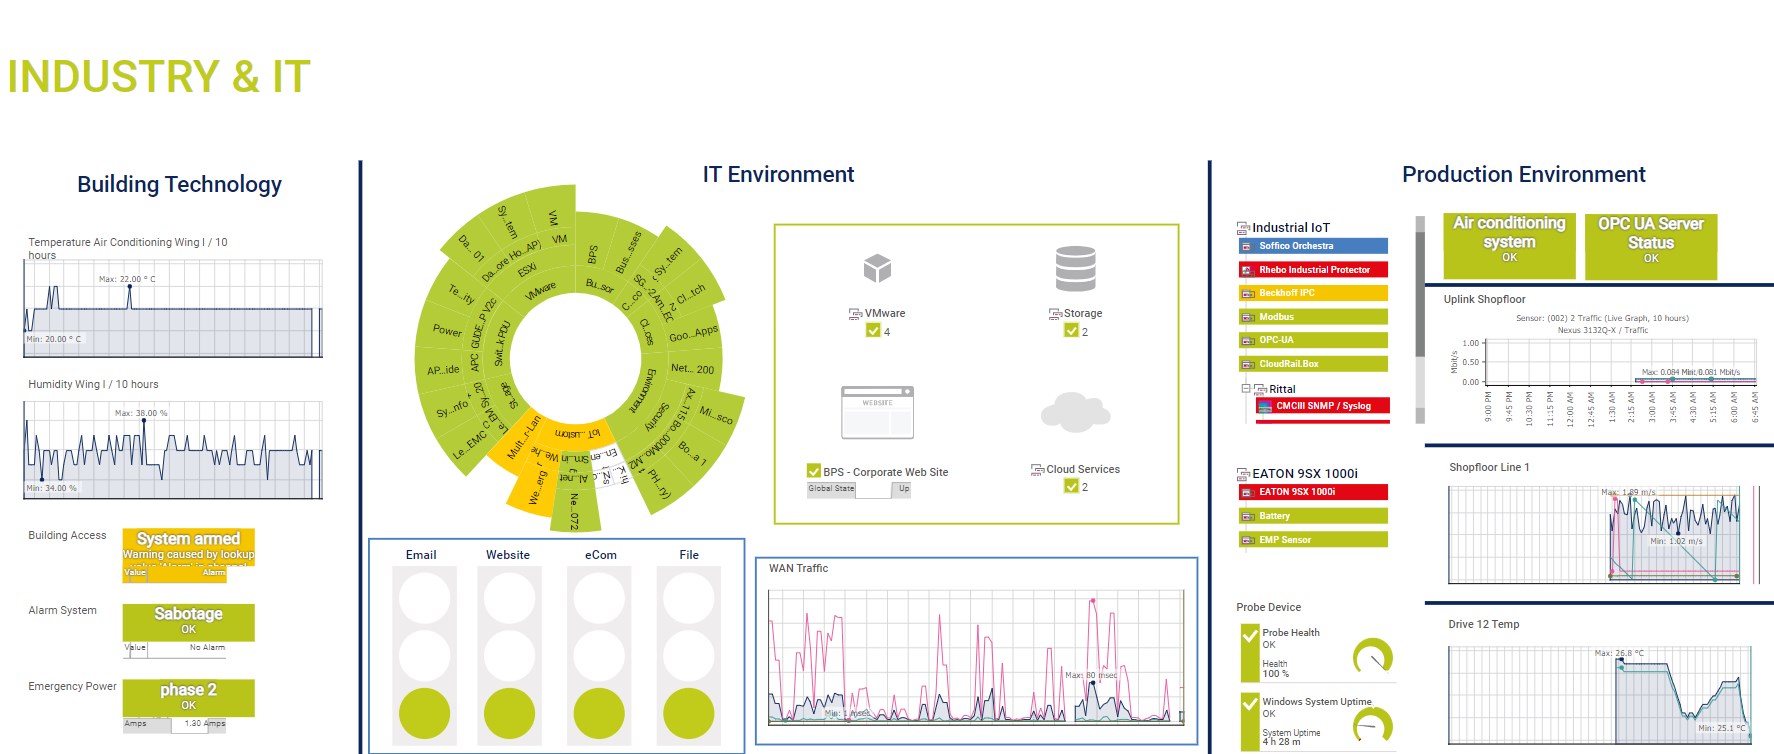
As you can see, the dashboard shown here gives a broad overview of aspects such as metrics to do with production, IT metrics, and metrics to do with the building itself. It's easy to see at a glance if something, somewhere is in a failed or warning state.
Before we look at the sample overview in more detail, here's a brief explanation of how it works: with PRTG, you can assign sensors (or data collectors) to gather data from devices, systems, and more. PRTG offers the functionality to create dashboards (known as "Maps" in PRTG) to represent the data gathered by the sensors.
Now let's break the overview down, section by section,.
Production environment
In the production environment section, there is an overview of some vital metrics from the OT area.
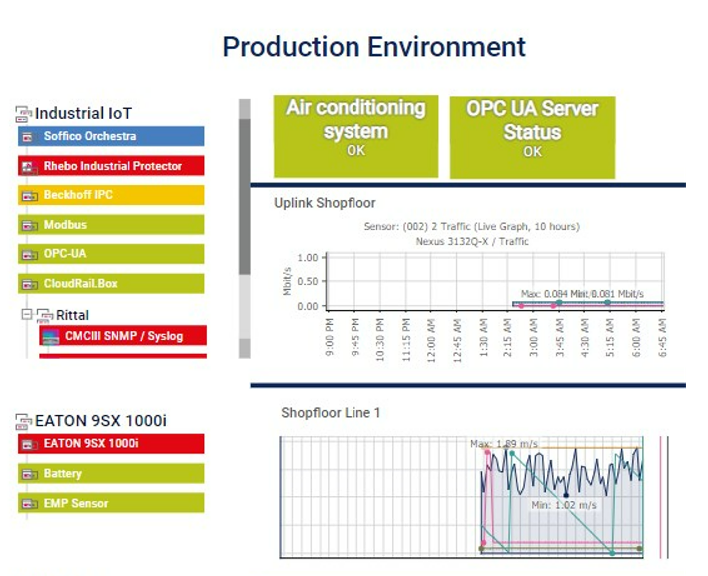 There is a lot of data being shown in one dashboard, and it's all easily comprehensible at a glance. For example: you can quickly notice which devices have potential issues due to the red color. Let's take a look at what's displayed.
- Industrial IoT
Sensors are being used to monitor the status of various devices critical to the industrial infrastructure. In this example, this includes Soffico Orchestration Engine, a Rhebo Industrial Protector, a Beckhoff IPC, a CloudRail box, and a Rittal CMC III processing unit. Additionally, some devices are being monitored using Modbus TCP and OPC UA. - Uninterruptible Power Supply (UPS) status
An Eaton 9SX 1000i is the UPS in this scenario. There are various aspects being monitored, such as the device itself, the battery status, and other metrics. In the above example, it is immediately clear that there is an issue with the UPS that needs to be addressed. - Air conditioning system
The air conditioning system is being monitored using Modbus TCP. There are several metrics behind this sensor – for example, temperature measurements, uptime of the unit, and so on. Additionally, the sensor can also display error codes in the case of an air conditioning system failure. This way, you can not only immediately see when there is a problem, but you can also quickly find out what the issue is, and thus know who to contact for technical assistance. - OPC UA Server status
With OPC UA becoming a widely-adopted standard in industrial environments, OPC UA servers play a crucial role in communication between various elements in the infrastructure. The OPC UA Server Status sensor of PRTG constantly checks that OPC UA servers are up and running, and gathers information about the servers' uptime and diagnostic data. - Bandwidth usage
The two graphs on the dashboard show bandwidth usage of the factory floor uplink (which is provided by a Nexus 3132Q-X switch in this example) and the "Shopfloor line 1". This is a great way to watch for bottlenecks in communication between the factory floor and other areas. Not only that, but the graphs can help you identify patterns over time, which can help you with optimizing processes or the infrastructure.
In just this production view, engineers already have a summary of some of the most vital aspects of their OT area.
IT environment
The IT Environment section provides an overview of the IT environment (as the title suggests).
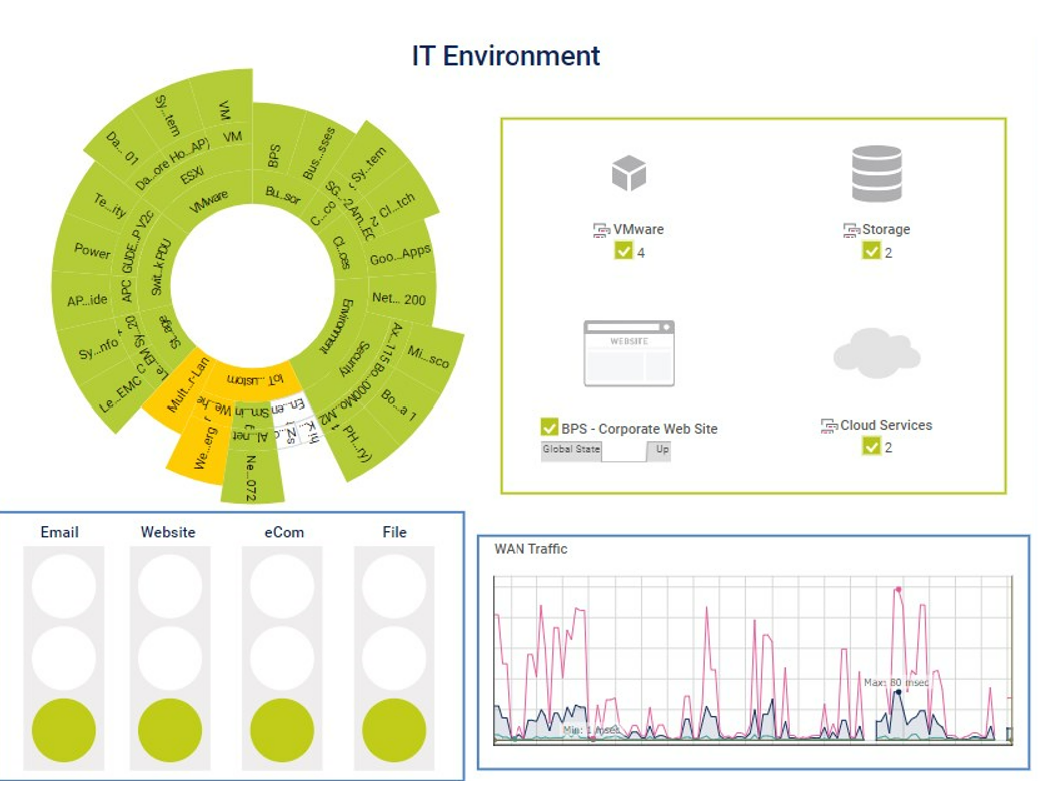
One of the most beloved aspects of PRTG dashboards is the sunburst view. It's a great way of showing the status of all devices of a specific type. For example: in this view, the categories are listed closest to the inner ring, and the related sensors are shown moving outwards. At a glance, we can see that there are some warnings (yellow color) to with IoT devices.
The bottom left traffic lights are shown by the Business Process sensor in PRTG. This sensor gives you an overview of the overall status of a specific service. It is provided with data from sensors that are monitoring devices and systems related to that service or process. Let's take Email as an example. There are several sensors monitoring different components that provide the Email service, such as the Email server and the storage devices used by the Email service. On this main dashboard, we only see the overall status for the Email service. In our example, everything related to the Email service is up and running. However, if the Email storage device would run out of space, as an example, then the traffic light on this dashboard would change to either yellow or red, depending on the severity.
The dashboard also shows several other IT-related metrics, such as the status of the virtual environment, corporate Website, and cloud services. You can also see bandwidth usage on the WAN over a period of time.
For more on the IT monitoring capabilities of PRTG, take a look here.
Building technology
The dashboard also shows us various metrics from the building facilities.
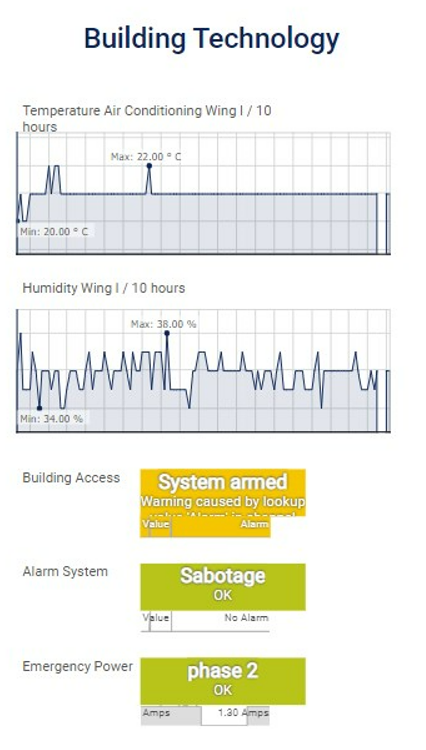 For temperature and humidity data, we are receiving data from IoT devices that monitor environmental conditions. We have also configured sensors to get data from the building access system, the alarm system, and the emergency power supply.
All in one view
Each of these views – the production view, the IT view, and the building technology view – could be separate dashboards, used by the relevant teams. But the real benefit is having all of these views on one dashboard, side-by-side. This makes it possible to keep an eye on the health of the entire IT and OT infrastructure.
And this is just one example of what PRTG can do with dashboards. For more the sensors and capabilities of PRTG, take a look at our industrial IT monitoring page. And if you'd like to learn about supporting IT and OT convergence with holistic monitoring, then download our white paper.
Do you have comments or questions about using PRTG in an industrial environment? Let us know in the comments below!


