 Published by Sascha Neumeier
Last updated on January 23, 2024
•
4 minute read
Just before the release of PRTG Network Monitor 20.3.61, Microsoft renamed its powerful software suite from Office 365 to Microsoft 365. Therefore, the two new sensor types are now called Microsoft 365 Service Status Sensor and Microsoft 365 Service Status Advanced Sensor.
In this article, I will briefly introduce the two sensors and show you what exactly you can monitor with them.
Microsoft 365 Service Status sensor
Let's start with the Microsoft 365 sensor that has no "Advanced" in its name. Accordingly, this sensor serves the purpose of a quick overview of the functionality of Microsoft 365 services.
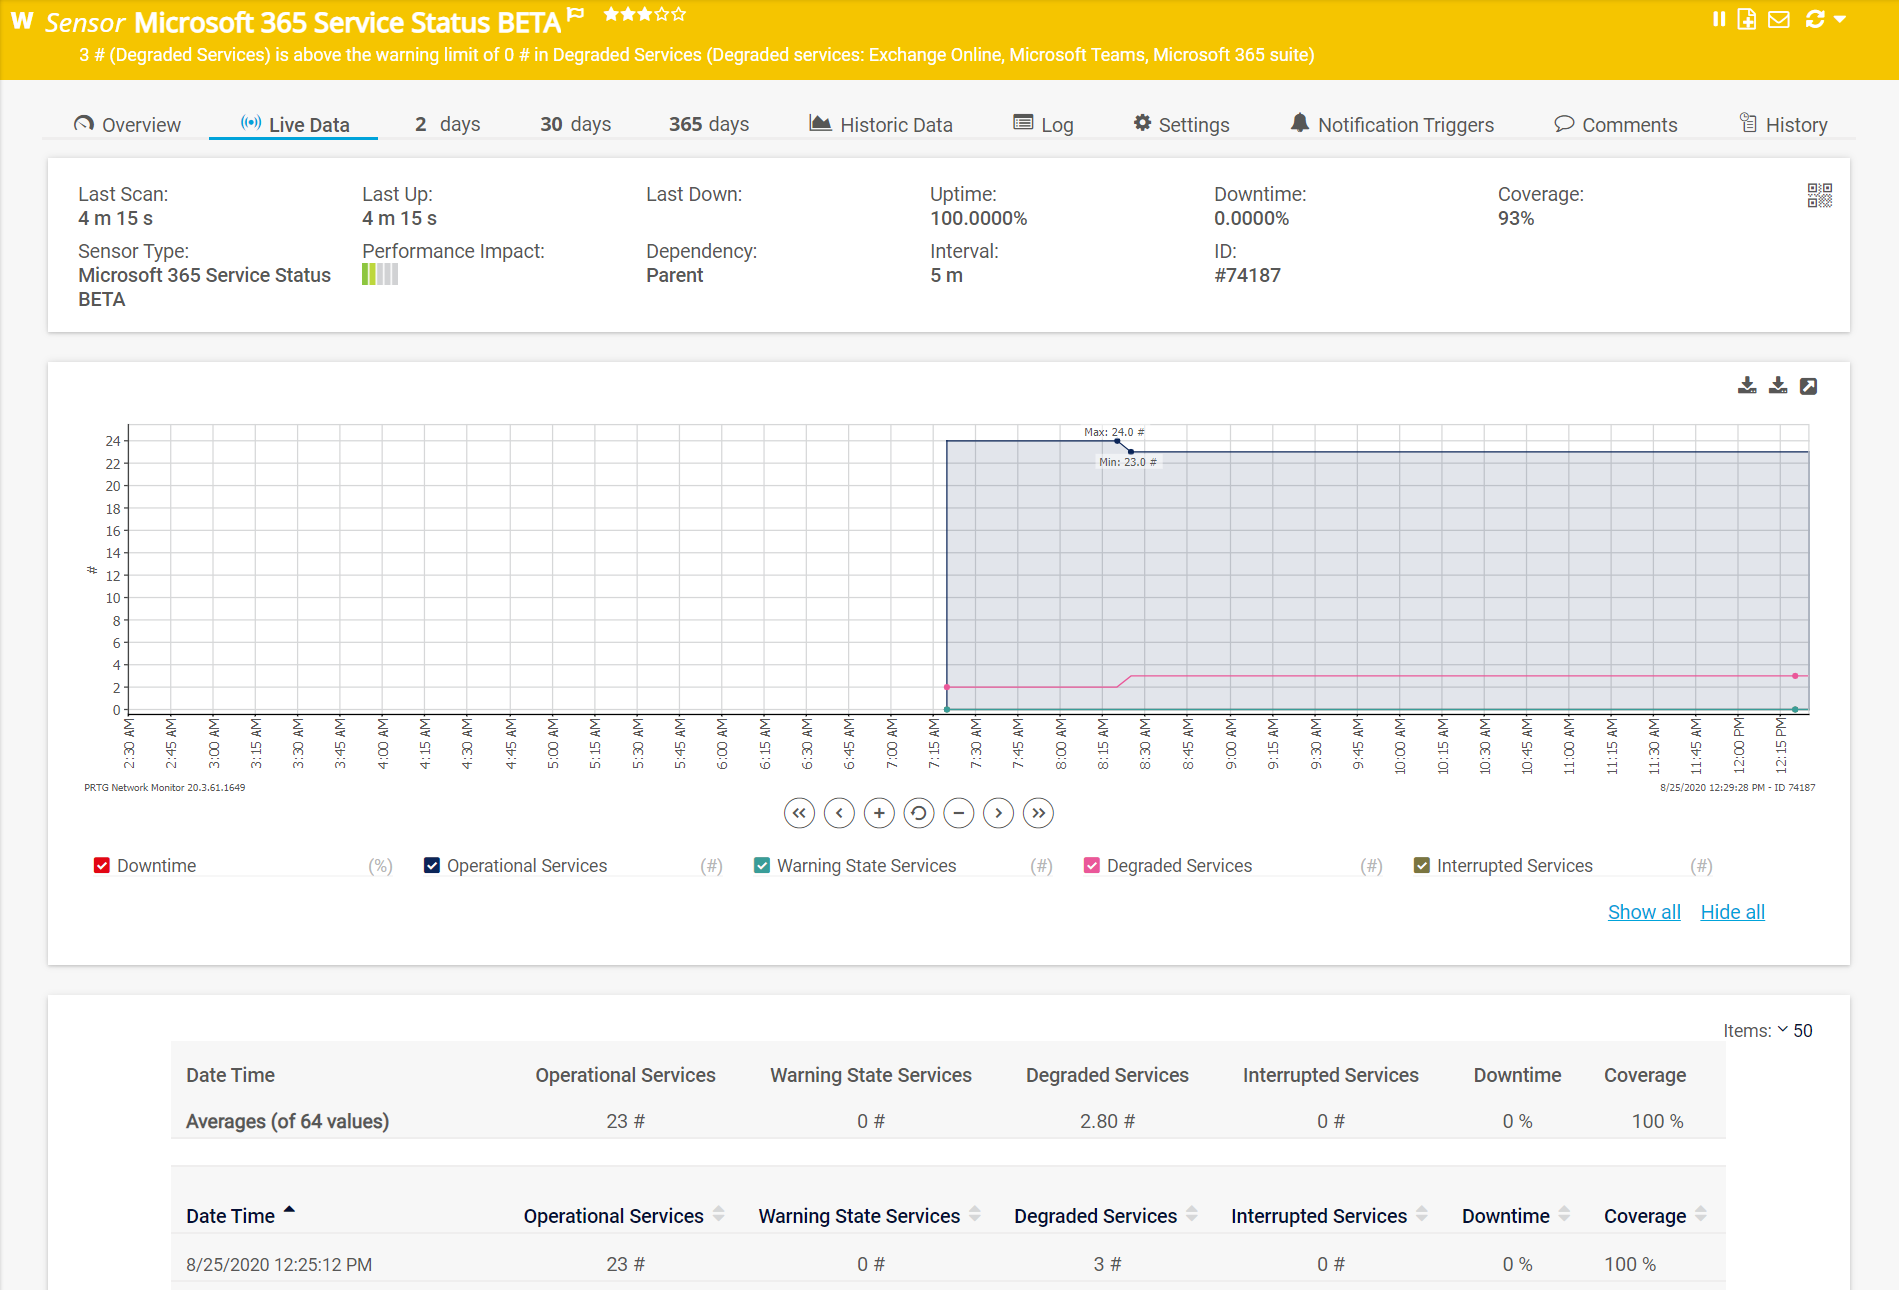
The screenshot above shows that the sensor is currently in the warning status, because 3 services are in the "Degraded" condition. At the time of the screenshot, Microsoft had reported malfunctions in the services Exchange Online, Microsoft Teams and the Microsoft 365 Suite. You can also see the average availability of the Microsoft 365 services at a glance.
If you collect this data over a longer period of time, it is an excellent way to document service availability, for example in a monthly C-level IT report. You can also create such reports directly in PRTG.
In addition to this quick overview, you will certainly want to take a deeper look into the functionality of individual Microsoft 365 services. A possible use case here would be: The overview shows you that the SharePoint Online Service is currently degraded and you want to find out more details about where the error resides. Here, the Microsoft 365 Service Status Advanced sensor will be of assistance.
Microsoft 365 Service Status Advanced Sensor
The Microsoft 365 Service Status Advanced Sensor asks you at the time of its creation which services you want to monitor in detail. PRTG creates a separate sensor for each service where you check the box.
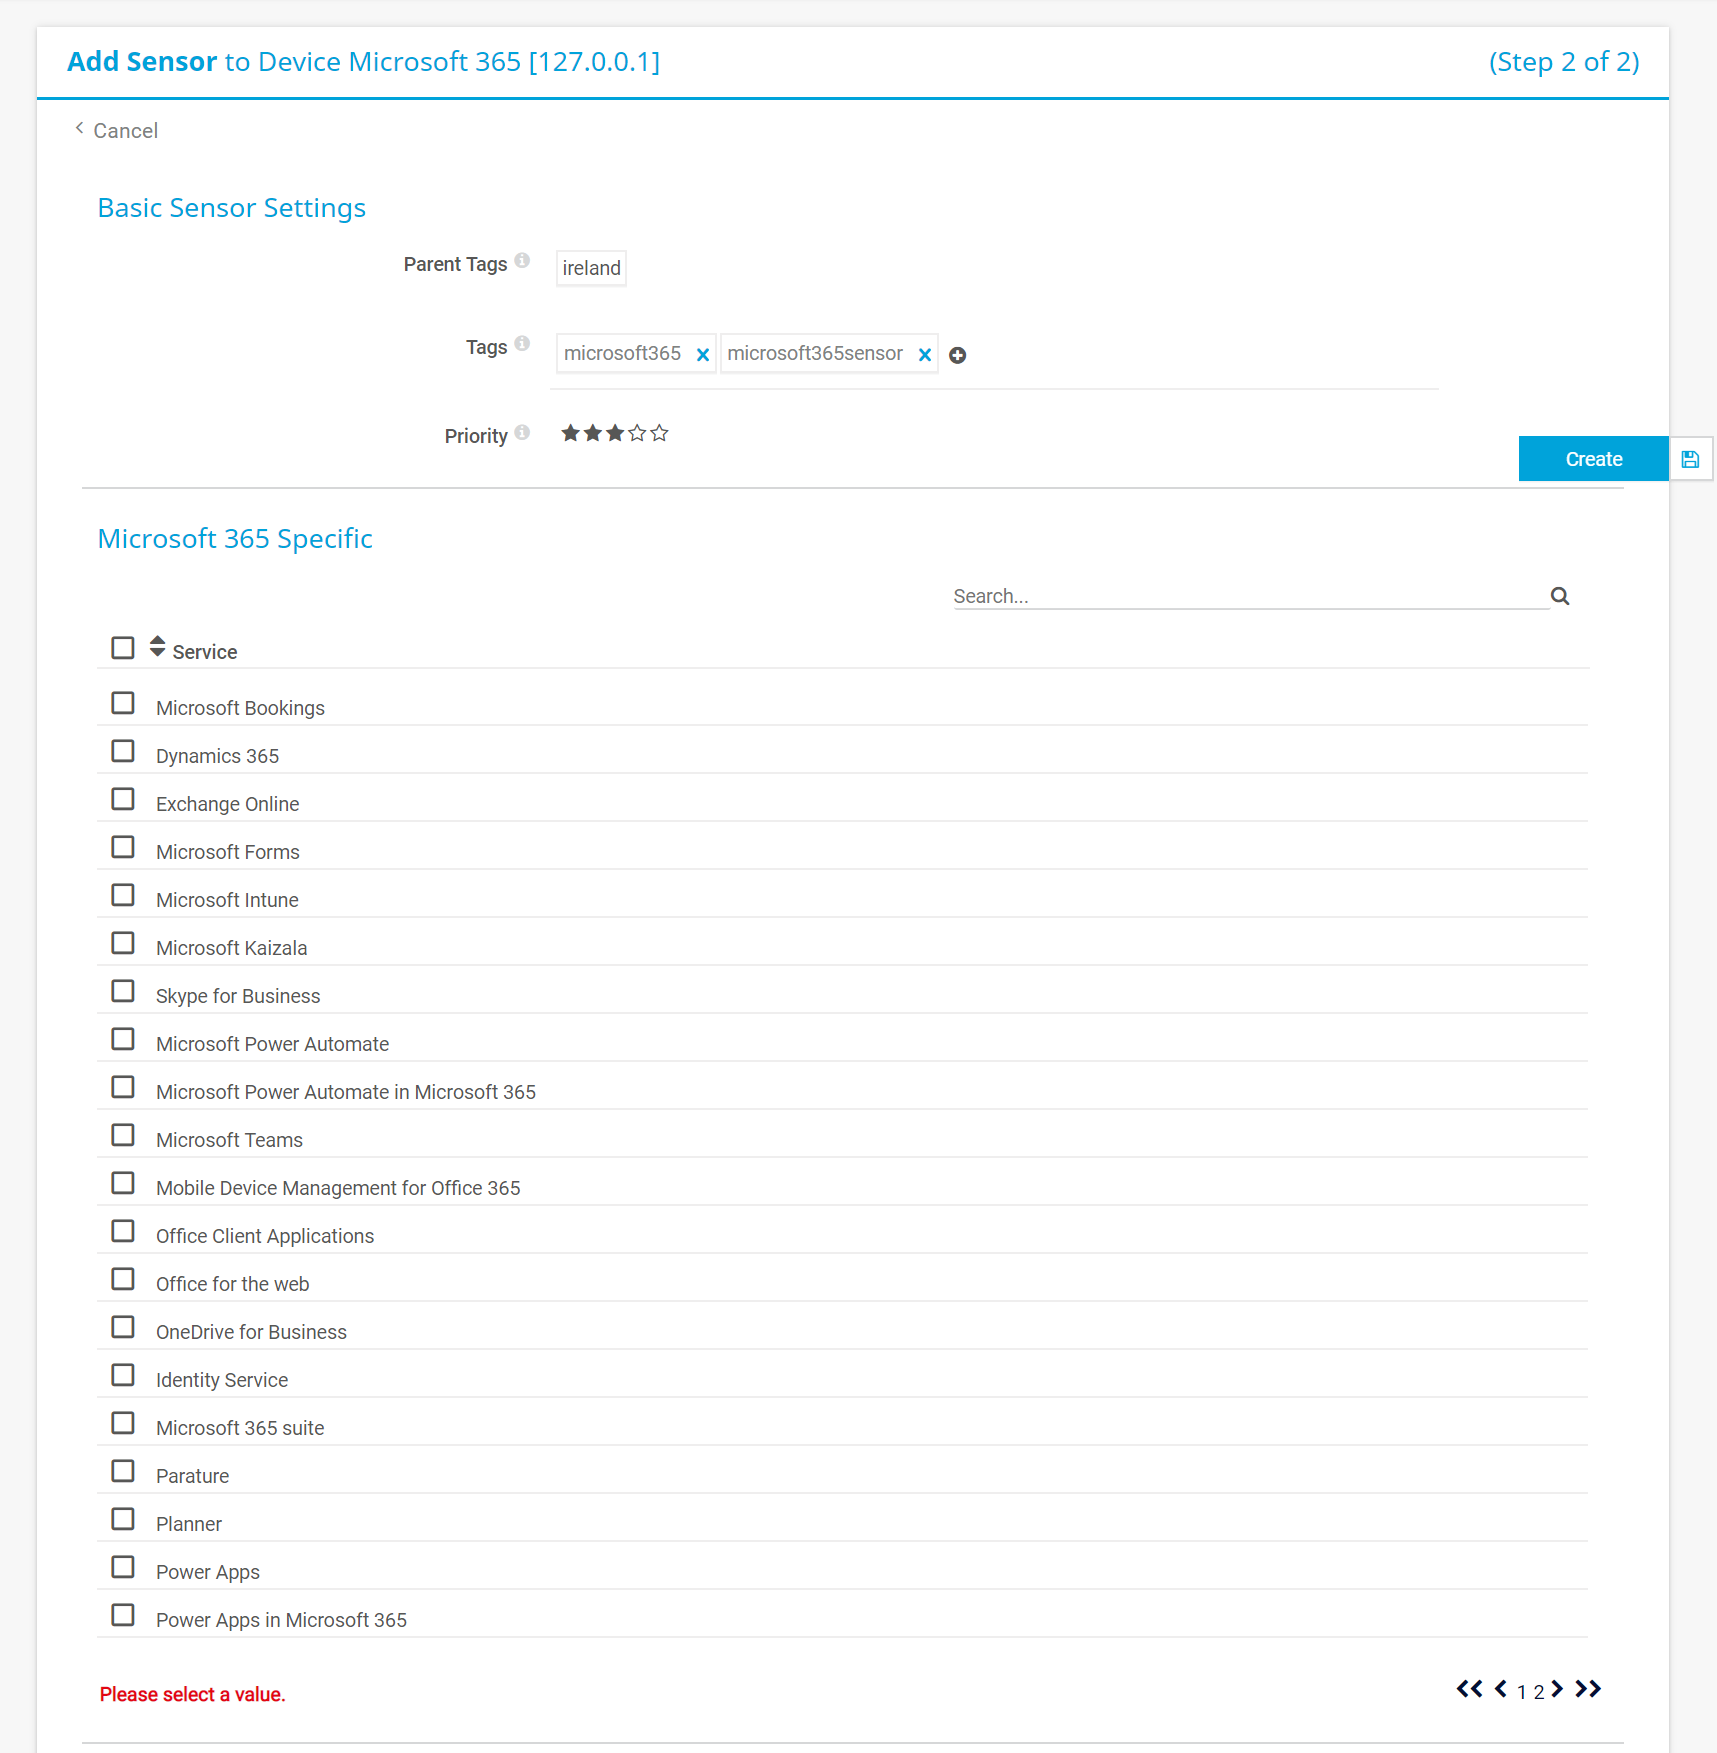
For our example, we selected the Microsoft SharePoint Online Service (this one does not appear in the screenshot because you can browse through the list of services and it appears on page 2).
Once added, the sensor collects a whole range of data about the state of the SharePoint Online Service. See the screenshot below to see how this looks in detail:
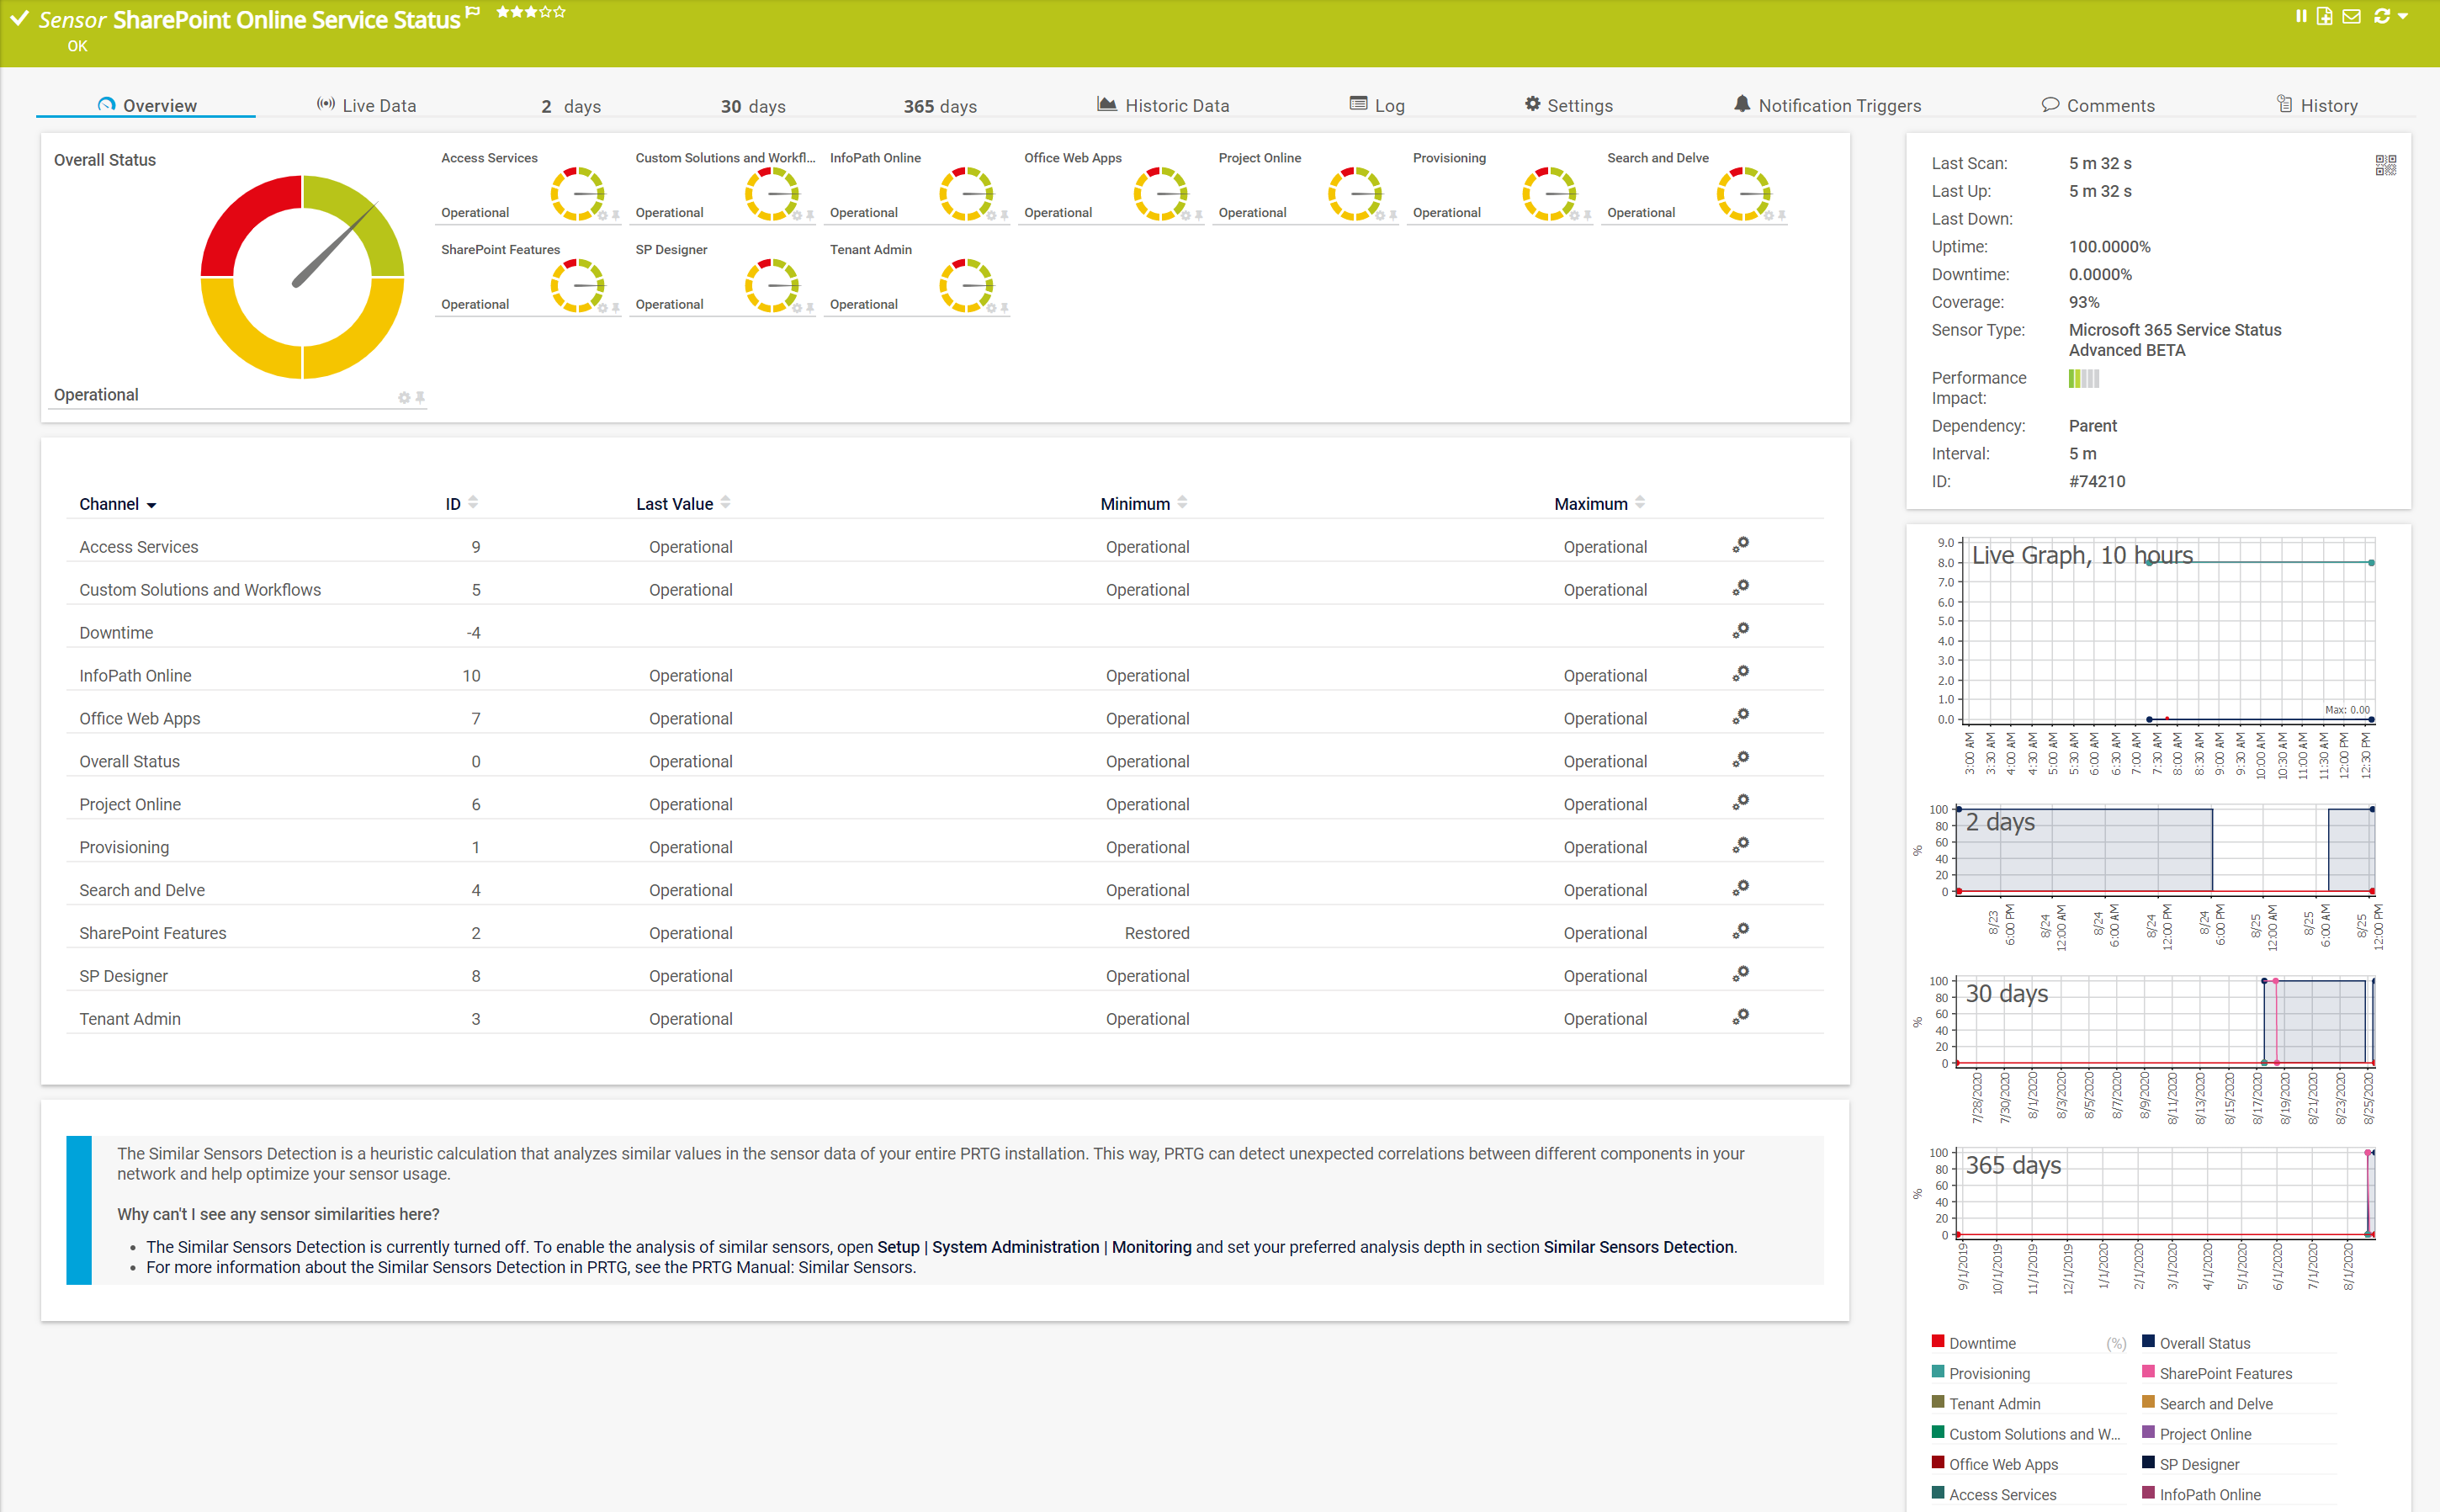
The green gauge immediately indicates that everything is OK here and that the individual sensor channels are also fully available. The SharePoint Online Service Status shows you various values and in case of degradation you can immediately see in which subarea the error is located.
The channel information is certainly different for each Microsoft 365 service. I recommend that you first add all Microsoft 365 services as sensors and then decide which of the sensors and channels are relevant for your monitoring landscape.
All relevant information about the two sensors can be found in the PRTG Manual. There, you can also read about the access rights you need to set up the sensor correctly.
- PRTG Manual: Microsoft 365 Service Status Sensor
- PRTG Manual: Microsoft 365 Service Status Advanced Sensor
Your feedback is appreciated
As always, we are happy to receive your feedback on the new sensors. Try out the new sensors and tell us about your experiences in the comments.


