 Published by Heather Pacan
Last updated on April 15, 2026
•
9 minute read
Running an IT infrastructure organization is a complex task – it involves maintenance, predictability, customer satisfaction (especially if your customers are internal employees) and problem resolution. To compete this, you need tools and information to reply and respond accordingly.
Many organizations rely on monitoring tools to assist – and how you view the data that the monitoring tool provides. The data can come in the form of alerts, a dashboard or map, as well as reporting. An IT Infrastructure report can vary according to the audience it is meant for, and today I want to talk about reports for a C-level executive. But, before we do that we need to understand what an infrastructure report is.
What Is an IT Infrastructure Report and What Is It Used For?
It is used to see the current state of your IT infrastructure – it will give you visibility into what is running, what is not and where you need to start paying some attention. Reporting helps to make sure you are in compliance with any SLAs (service level agreements) that you are bound to. In addition, you can make informed decisions on strategy and maintenance.
What Is a C-level Executive?
C-levels are the highest-level of executives in senior management at an organization. Most of the time, they have titles beginning with chief – such as Chief Executive Officer, Chief Financial Officer or Chef Technical Officer, etc.
What Is a C-Level IT Infrastructure Report?
It is a report comprised of information that the C-level will need about their Infrastructure. It is not necessary for the in-depth metrics in a C-level report. They need information about overall averages, uptimes (to match SLAs), and significant downtime. They need to see that the critical services are running. It is important for them to make sure IT is aligned with business objects so they complement rather than go in different directions.
Including in-depth data tables with a C-level report is not necessary most of the time. A C-level executive has a limited amount of time to read the report, so you want to put information in front of them that they will read and comprehend. Giving an executive a report that is meaningless to them may result in a lack of support to bring on new technologies because of a lack of understanding. Creating a report with graphs and charts will be more effective and provide the information to be quickly read.
How Can You Create a C-Level Report With PRTG?
PRTG includes multiple ways to look at your data – mapping, extracting historic data through the API or on each sensor and creating reports. This video will give you an overview of PRTG.
To create a report for C-Levels, I would suggest that you use one of the Graph Only templates or the Top 10 templates. Reports could get quite lengthy, so you need to think about what would be important for them to see – high level. I suggest using the Business Process Sensors.
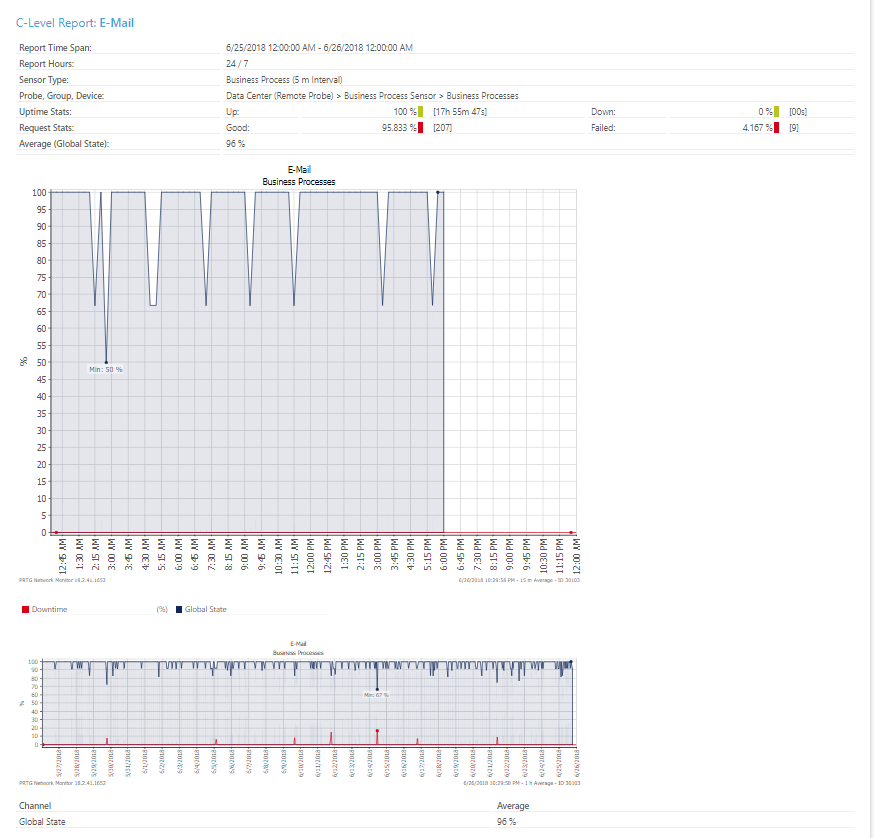
The Business Process sensors are made of channels from multiple sensors so you can represent an entire business process. You can add the sensors to the report with a Tag call business process or create a tag for the business process sensors you would like to have in the report. If you want to exclude some of the channels from the report to make it simpler, you can select your sensors manually and leave only the channels you want to include selected. I always like to use E-mail as an example for this. An E-mail environment contains several pieces of Infrastructure and if one of those pieces goes down, the service is down and that is what the C-level cares about. So, with the business process sensor you can represent that.
An example would be like this:
Another example could be just by using the Ping sensors – Ping will give you up/down status and for many critical devices this would be sufficient.
i Ping is a command-line utility, available on virtually any operating system with network connectivity, that acts as a test to see if a networked device is reachable. The ping command sends a request over the network to a specific device. A successful ping results in a response from the computer that was pinged back to the originating computer. Read more ...
If a router or firewall is down, then there is a down that the C-Level needs to know about. PRTG includes a template for the Top 10 Uptime/Downtime sensors – and this could be a quick and easy to put together report for the C-Level also:
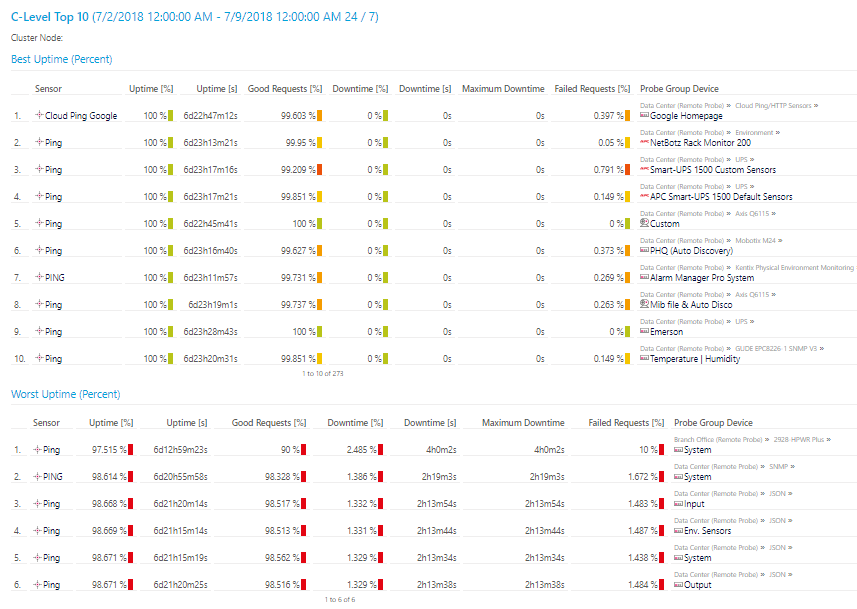
As you can see easily what is up and what is down. But this still may be too busy of a report for your C-Level to read. They need quick information and if they don’t understand PRTG, this may be meaningless to them. Most out of the box reports do contain quite a lot of information that is important to the network admin, but not your executives. With a little bit of customizing out of the box reports – I was able to make this report:
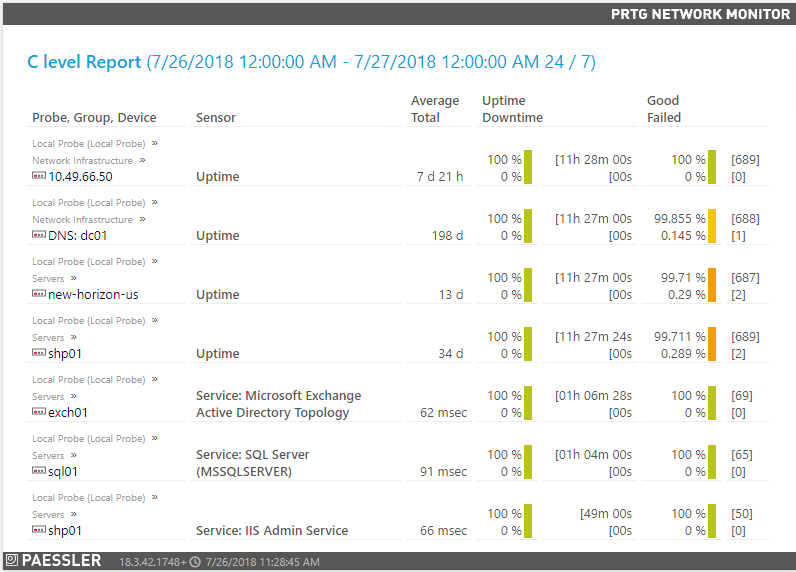
...look like this:
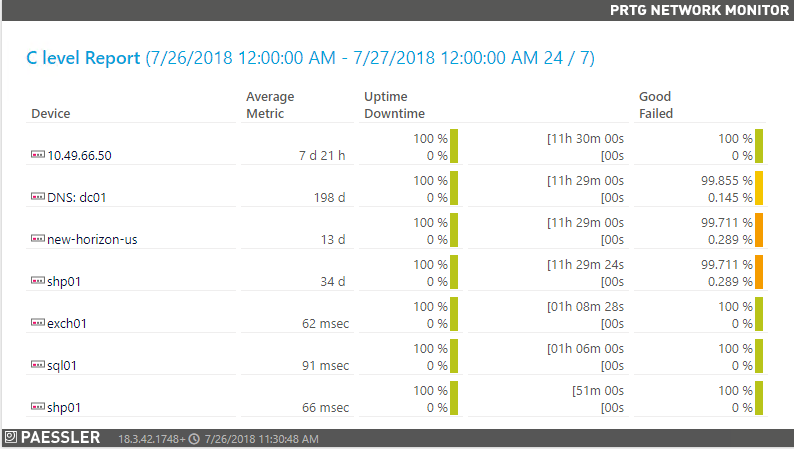
As you can see the second report is quite cleaner. I took out the path in the device tree and simply represented the device name. I also removed the sensor column because to a C-Level the sensor itself may be meaningless. In addition, I took the good/bad requests out of the right column.
iNotice: I do have to say that changing the out of the box templates is not covered by support. So, please make sure you copy the templates and create new files to modify. If you do not do that, future updates to PRTG will wipe out your customizations.
For an introduction to modifying report templates, please see this KB article.
How Did I Do It?
For my example, I used the List of Sensors No Graph report template.
I used this KB article to remove the Probe/Group reference to report in the first column and to remove the second column with the sensors.
To change the first column heading from "Probe,Group,Device" to just "Device" I had to edit my copy of the C02 Sensorlist nograph.htm file (I renamed all of my files that I modified after I copied them with an _custom before the .htm).
I modified this line:
<th><#lang key="html.global.probegroupdev" default="Probe, Group, Device"></th>
...to this:
<th><#lang key="html.global.device" default="Device"></th>
In that same file, for me to change the column heading from "Average Total" to "Average Metric" I changed this line:
<th style="<#clusterdependent hidefor='clusterinstallation'>"><#lang key="html.global.average" default="Average"><br><#lang key="html.global.total" default="Total"></th>
...to this:
<th style="<#clusterdependent hidefor='clusterinstallation'>"><#lang key="html.global.average" default="Average"><br><#lang key="html.global.metric" default="Metric"></th>
The last piece I did was to remove the good and bad requests. I had to do this in two files – from my copy of the Sensorlist No Graph Loop.htm I removed:
<span class="percent">[<#report type="goodreq" objectid="<@objectid>" avg="<@tableaverage>" sdate="<@start>" edate="<@end>" clgid="<@clgid>">]</span><br>
<span class="percent">[<#report type="failedreq" objectid="<@objectid>" avg="<@tableaverage>" sdate="<@start>" edate="<@end>" clgid="<@clgid>">]</span>
And from my copy of the Sensorlist Dataline No Graph.htm I removed:
style="<#clusterdependent hidefor='clusterinstallation'>">
<span class="percent">[<#report type="goodreq" objectid="<@objectid>" avg="<@tableaverage>" sdate="<@start>" edate="<@end>">]</span><br>
<span class="percent">[<#report type="failedreq" objectid="<@objectid>" avg="<@tableaverage>" sdate="<@start>" edate="<@end>">]</span>
Conclusion
As you can see, the reporting engine in PRTG is very powerful and can produce reports with a lot of data. With PRTG, you can provide daily, weekly, monthly or quarterly reports to all levels of your organization. There are many out of the box options you can use, or if you have some html skills - with some small modifications - you can provide your C-level with a valuable, easy to read report.
Do you work with reports in PRTG? Tell us in the comments!


