 Published by Michael Becker
Last updated on September 17, 2026
•
10 minute read
In May 2026, we asked 1,088 PRTG customers worldwide how they actually use network monitoring: not what they say in a sales call, but what shows up on their dashboards every day. The weighted sample spans organizations of every size, from small IT teams to enterprises with 5,000 or more employees, respondents in nearly 90 countries, and covers everyone from Heads of IT to Network Managers to C level executives who occasionally peek at the graphs.

For this year's read of the data, two segments get the closest look, because they map directly onto how most of you reading this actually run IT: midmarket teams at organizations with 250 to 999 employees (weighted n=258, from 337 survey respondents), and decentralized enterprises, meaning organizations with 1,000 or more employees running PRTG companywide or across multiple sites and business units (weighted n=158, from 194 survey respondents). Everything below ties back to what the numbers mean for one of these two groups, not just what they say in the abstract.
Who's Actually Running Monitoring Day to Day?
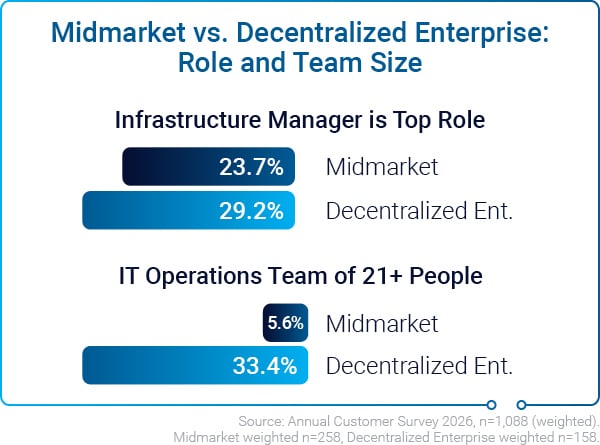
Across the full sample, Head of IT Department is the single most common role (25.5%), followed by Infrastructure Manager/Engineer/Administrator (21.1%) and Network Manager (14.1%). Infrastructure Manager already accounts for 23.7% of midmarket roles, close to the overall figure, but the mix shifts further once you isolate decentralized enterprises: there, Infrastructure Manager becomes the largest group at 29.2%, ahead of Head of IT at 16.6%. That tracks with how these organizations are structured: monitoring in an enterprise spread across multiple sites tends to sit with the people who own the infrastructure layer directly, not with a single department head trying to see everything from one desk.
Team size tells a similar story. Midmarket IT operations teams cluster at 6 to 10 people (38.3%, the largest single bucket for that segment), while decentralized enterprises are far more likely to run teams of 21 or more (33.4%, six times the midmarket rate of 5.6%). And the number of people actually responsible for monitoring specifically follows the same pattern: 75.7% of midmarket respondents have just 2 to 5 people handling monitoring, while decentralized enterprises are the only segment where double digit monitoring teams (11 to 20 people, or 21+) show up in meaningful numbers.
Whether your monitoring team is three people or thirty, one thing doesn't change: you can't fix what you can't see.
See what PRTG covers across your infrastructure with a free trial, no credit card required.

What Are These Teams Actually Trying to Get Done?
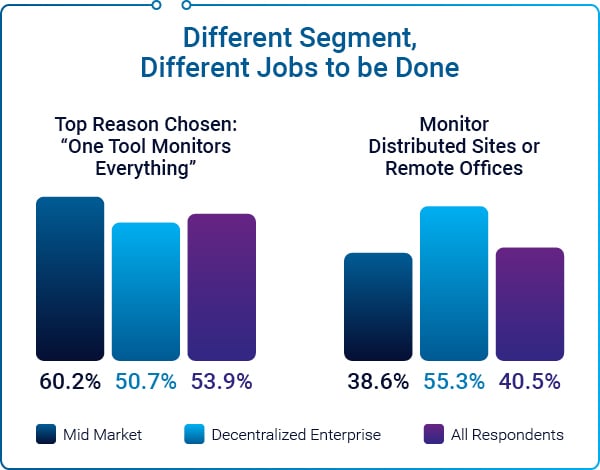
Ask midmarket IT teams why they picked PRTG in the first place, and the answer is blunt: one tool that covers everything. That reason tops the list for this segment at 60.2%, noticeably higher than the overall average (53.9%). Combined with the fact that midmarket teams show the lowest appetite for expanding their toolset (9.5%, versus 11.5% overall) and the highest intent to keep their current setup exactly as it is (64.7%), the job to be done here isn't "add more tools": it's "cover the whole infrastructure without adding another dashboard to check."
Decentralized enterprises are chasing something different: visibility that survives being spread across locations. They're the segment most likely to deploy PRTG across multiple sites or teams rather than companywide as one instance (34.1%, more than double the overall rate of 14.7%), and they lead every segment in monitoring distributed sites or remote offices (55.3% vs. 40.5% overall). They also monitor more OT and industrial systems (16.0%) and more cloud infrastructure (34.0%) than any other group. The job here is coordination at scale: keeping a consistent view across sites, teams, and infrastructure types that midmarket organizations simply don't have to reconcile.
Does Compliance Actually Drive Monitoring Decisions?
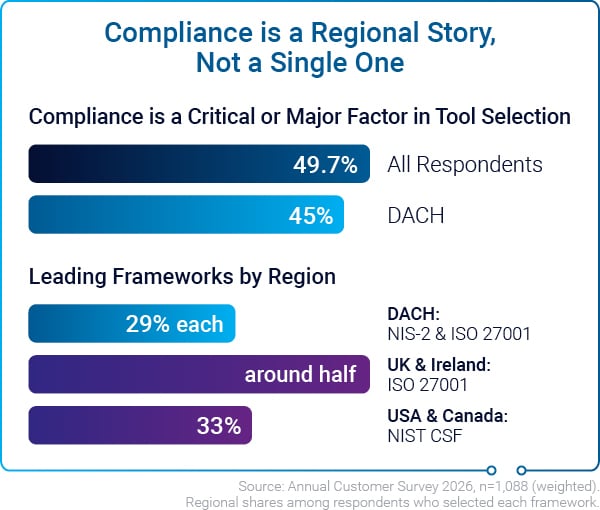
The answer is yes, for close to half the market. When we asked what drives tool selection, 49.7% of respondents named compliance or regulatory requirements as a critical or major factor. ISO 27001 leads as the most common framework overall (34.1%), with NIS-2 (20.5%) and the NIST Cybersecurity Framework (17.6%) close behind.
That overall number flattens something the regional data makes obvious: which framework matters depends heavily on where you sit. DACH customers split their attention evenly between NIS-2 and ISO 27001 (29% each), and compliance ranks as a critical or major factor for 45% of them. UK and Ireland tell a different story: ISO 27001 alone covers about half of respondents there, while NIS-2 barely registers (6%). Cross the Atlantic and the frameworks shift again: in the US and Canada, NIST CSF and SOC 2 do the heavy lifting instead. Same product, same monitoring job, three different sets of rules to satisfy.
None of this changes what monitoring itself needs to deliver. Auditors care less about which framework applies and more about evidence: proof that infrastructure was actually monitored, that outages got logged, and that availability targets were met. That's the part PRTG data is genuinely useful for: uptime and SLA reporting that holds up in an audit instead of a spreadsheet stitched together the week before the auditor shows up.
Where Should PRTG Focus Next?
Most of what respondents told us confirms that PRTG is doing exactly what it's meant to do. But three areas stood out clearly as where we can go even further, and they land a little differently depending on which of these two groups you're in.
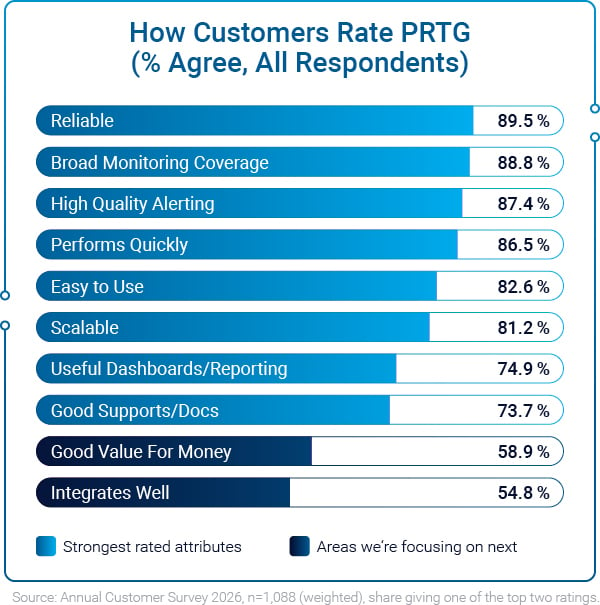
- Integrations are where we're focusing next. "Integrates well" is the attribute with the largest undecided group in the survey: four in ten respondents (40.5%) couldn't say either way whether PRTG integrates well, more than for any other attribute. Both midmarket (57.0%) and decentralized enterprises (56.5%) actually agree at rates above the overall average (54.8%), but that large neutral share is exactly why deeper, smoother integrations with other tools are one of our near term priorities.
- Larger, distributed environments tend to run more than one tool, and that's normal. 32.0% of decentralized enterprise respondents rely on PRTG exclusively (midmarket sits higher, at 46.6%, close to the overall average of 46.5%), which reflects how these organizations typically layer specialized tools on top of a core monitoring platform. It's also why 18.7% of this segment are looking at consolidating their toolset going forward: an opening for PRTG to cover more of what those additional tools currently handle.
- Value for money perception varies by market. Midmarket rates value for money above the overall average (61.7% vs. 58.9%), and midmarket also leads on its own reliability (91.4%) and alerting quality (88.7%) scores, both above the survey wide averages shown above. Value perception varies more by region than any other attribute, which is informing how we communicate pricing and packaging regionally.
How Satisfied Are Customers, and Where's the Room to Improve?
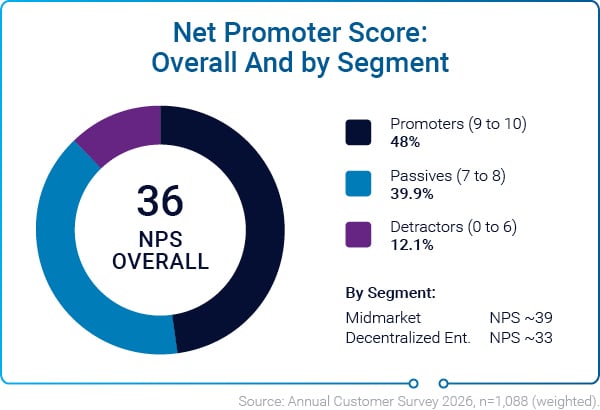
The headline number: overall Net Promoter Score sits at 36, with 48.0% promoters against 12.1% detractors. Split by segment, midmarket comes in stronger at an NPS of roughly 39 (49.5% promoters, 10.4% detractors), while decentralized enterprises land closer to 33 (47.8% promoters, 14.4% detractors), a gap consistent with the added complexity these teams are managing. Among our three core regions, UK and Ireland post the strongest results: an NPS of 40, ahead of DACH (32) and USA/CA (31), and alerting quality of 98.3%, the highest of any region in the survey. UK and Ireland's regional base is smaller, around 70 respondents, so these figures should be read as directional rather than conclusive.
What's clearly working: reliability (89.5% among the top two ratings overall), broad monitoring coverage (88.8%), high quality alerting (87.4%), and speed (86.5%) are all rated highly across both segments, and none of them show a meaningful gap between midmarket and decentralized enterprise respondents. Day to day satisfaction backs this up: 39.8% of respondents rate PRTG "Excellent" for daily monitoring, and another 53.0% rate it "Good."
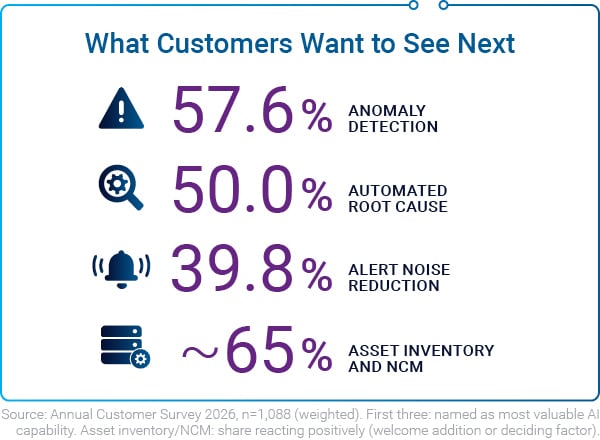
Beyond day to day satisfaction, respondents also told us where they'd like to see PRTG go next. 57.6% of all respondents flagged anomaly detection as one of the AI capabilities that would deliver the most value, climbing to 64.3% among decentralized enterprises. Interest in smarter alert noise reduction follows a similar pattern: 39.8% overall, rising to 48.8% among decentralized enterprises, the highest of any segment. Interest in these capabilities is highest exactly where infrastructure is largest and most complex.
Curious how PRTG would handle your infrastructure, whether that's a single site or fifty?
Start your free trial today and see your setup on one dashboard within minutes.

What Are We Doing About It?
None of this feedback is going into a drawer. Deeper, smoother integrations with outside tools are already one of our clearest near term priorities, precisely because they're the area where both midmarket and decentralized enterprise customers told us they'd get the most extra value from PRTG.
Interest in new capabilities is shaping our roadmap conversations just as directly. Around two thirds of respondents reacted positively to the idea of IT asset inventory (64.0%) or network configuration management (66.5%) built into PRTG rather than as a separate tool, and roughly one in eight called it a deciding factor rather than just a nice to have.
That appetite is even stronger among decentralized enterprises, who are juggling infrastructure across the most locations. Anomaly detection and automated root cause analysis, the two AI capabilities respondents ranked highest, are being evaluated with exactly the environments that asked for them most: large, distributed, and increasingly complex infrastructure setups. And on pricing, midmarket customers rate reliability and speed highly but see more room to improve on value for money, feedback that's directly informing how we explain pricing and packaging, particularly in markets like DACH.
None of this happens in isolation from what you told us. Every priority above traces back to a specific number in this survey, not a guess about what IT teams might want. If you have more feedback, share it directly on Paessler User Voice. Our product and customer teams are always listening.


 You there!