Many large and medium-sized companies rely on SAP as their ERP solution for business-critical areas. One reason they use SAP is for its high availability features. A system failure or performance degradation will cause high expenditures in IT and create work restrictions for users and customers—and using a highly available database will prevent this from happening.
But here's the challenge: besides Solution Manager, what do you actually use for SAP monitoring? If you've ever dealt with intermittent authentication issues or performance problems that are difficult to catch, you know that standard SAP tools don't always cover all your monitoring needs.
Challenges of IT and SAP System Administrators
IT is responsible for securing and monitoring business-critical applications. IT and SAP managers must ensure that SAP systems (SAP System Monitoring) and databases (such as SAP HANA, Sybase, MaxDB, Oracle, DB2, or MSSQL) run without problems or failures and that the company's business processes are running smoothly at all times.
What SAP Administrators Need to Monitor 24/7
An IT manager faces critical questions every day:
- How can SAP Basis be automated and monitored in real time 24/7?
- How can I monitor my SAP HANA database performance?
- How can I monitor individual SAP jobs and detect job interruptions before they impact production?
- How can I see if backups failed or did not run at all?
- What is the status of the update processes in SAP?
- How do I keep track of IDocs?
- What is the current utilization of system locks, and are alarms issued before the SAP system comes to a halt?
- What is the utilization percentage of the batch and dialog work processes to analyze and avoid performance bottlenecks?
- What is the spool system's status, which brings the SAP system to a standstill in the event of an overflow?
These aren't just theoretical concerns. When your primary domain controller starts experiencing high CPU utilization and authentication requests begin timing out, production systems start failing. The problem is often intermittent, making it difficult to catch without comprehensive monitoring.
Why Comprehensive SAP Monitoring Matters
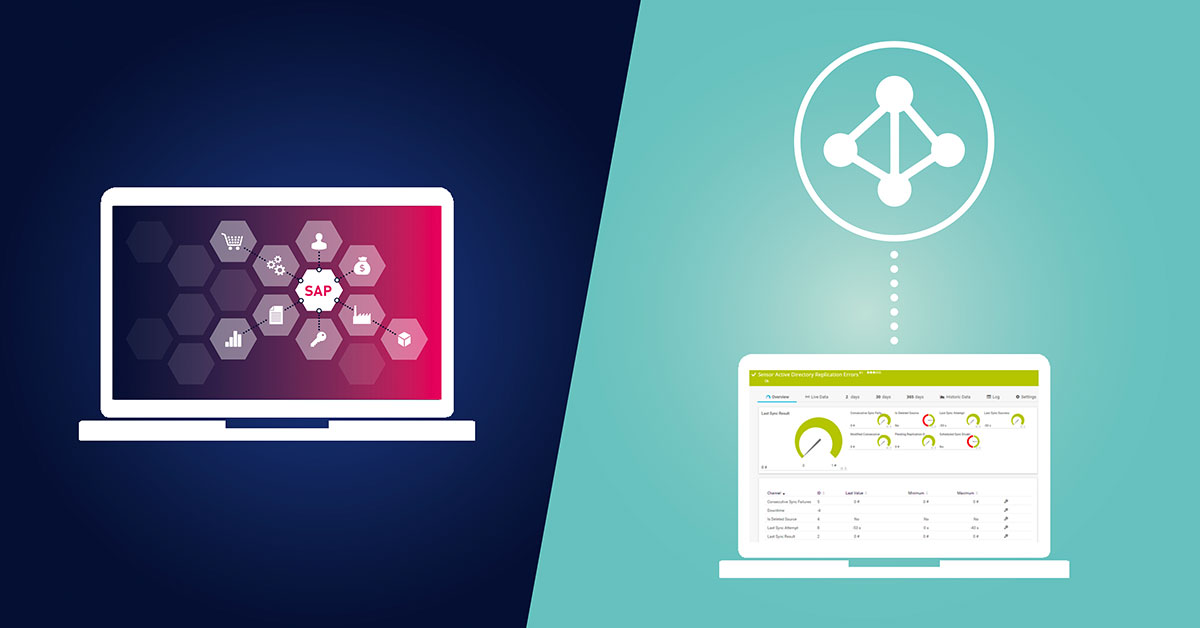
We recently wrote about how you can monitor your ERP environment with PRTG Network Monitor in general. Effective SAP monitoring should cover the following areas:
- The database(s) – SAP HANA, Oracle, SQL Server, and other database systems
- The underlying hardware/virtualization – Application servers, CPU, memory, and runtime resources
- The business processes – Workflows, dependencies, and user experience
- Dedicated sensors – Custom monitoring for SAP-specific metrics and thresholds
Today we look at what monitoring the databases and jobs in SAP can look like with PRTG, and how you can gain real-time visibility into your entire SAP ecosystem.
How Do You Monitor SAP HANA and Other Databases?
Database monitoring is critical for SAP environments. Your SAP HANA system, along with any non-SAP databases in your landscape, requires continuous oversight to prevent downtime and ensure optimal performance.
Key database metrics to track include:
- Response time – Query execution times and system responsiveness
- CPU and memory utilization – Resource consumption on individual instances
- Replication status – Data synchronization across managed systems
- Dumps and diagnostics – Error tracking and root cause analysis
- SQL performance – Query optimization and bottleneck identification
Without proper monitoring, you won't know if your database is approaching capacity limits until users start experiencing slowdowns or system failures occur.
Custom PRTG Sensors for Monitoring the SAP System Landscape
With Scansor, itesys provides user-defined sensors for PRTG that can monitor SAP landscapes in real time. The query is carried out via a direct query in SAP or delivered from the database to PRTG and is therefore up-to-date and precise.
For this purpose, a specific monitoring user is created in the SAP system; the role and access authorizations (SAP authorization concept) are supplied with the SAP monitoring license.
SAP HANA Monitoring
The SAP HANA sensor monitors a SAP HANA database system. It uses RFC (Remote Function Call) to connect to the SAP system and retrieve critical metrics.
Key monitoring capabilities include:
- Memory usage – Track memory consumption and identify potential leaks
- CPU utilization – Monitor processor load across HANA instances
- Disk space – Ensure adequate storage for data and logs
- Service status – Verify all HANA services are running correctly
- Backup status – Confirm backups completed successfully
- Replication health – Monitor system replication for high availability
SAP Job Monitoring
The SAP Job sensor monitors the status of SAP background jobs. This is essential for detecting job interruptions before they impact business processes.
Monitoring features:
- Job status tracking – Identify failed, aborted, or delayed jobs
- Runtime analysis – Detect jobs running longer than expected
- Job chains – Monitor dependencies between related jobs
- Notifications – Receive alerts when jobs fail or exceed thresholds
SAP System Monitoring
The SAP System sensor provides comprehensive oversight of your SAP application servers and ABAP systems.
What it monitors:
- Dialog work processes – Track utilization to prevent user access issues
- Batch work processes – Monitor background processing capacity
- Update processes – Ensure transactional updates are processed
- Spool system – Prevent spool overflow that can halt the system
- System locks – Track lock utilization and prevent deadlocks
- IDoc processing – Monitor interface document flow
Real-Time Monitoring and Automation for SAP Environments
Real-time monitoring is essential for SAP environments where downtime directly impacts business operations. PRTG provides continuous visibility into your SAP landscape with automated alerting when thresholds are exceeded.
Automation capabilities include:
- Automatic notifications – Email, SMS, or push notifications when issues arise
- Escalation workflows – Route alerts to the right team members
- Custom dashboards – Visualize SAP metrics in real-time
- Historical data retention – Analyze trends and plan capacity
- Integration with ITSM – Connect to ticketing systems for incident management
Beyond SAP: Monitoring Your Complete Application Ecosystem
SAP doesn't operate in isolation. Your application performance monitoring strategy should encompass the entire technology stack that supports your SAP environment.
Critical components to monitor:
- Web services and APIs – Track integration points and service availability
- On-premise infrastructure – Servers, storage, and network devices
- Virtualization platforms – VMware, Hyper-V, or cloud providers
- Network performance – Bandwidth, latency, and packet loss
- Security systems – Firewalls, authentication services, and access controls
This comprehensive approach ensures you can perform effective troubleshooting and root cause analysis when issues occur, rather than guessing which layer of your infrastructure is causing problems.
Observability and Visualization: Making Sense of Monitoring Data
Collecting metrics is only valuable if you can visualize and act on them. PRTG provides customizable dashboards and templates that help you:
- Create role-specific views – Different dashboards for SAP Basis teams, DBAs, and management
- Track KPIs – Monitor service level agreements and business metrics
- Identify trends – Spot patterns before they become problems
- Generate reports – Document system performance for stakeholders
The ability to see your entire SAP landscape at a glance—from application servers to databases to business processes—enables proactive management rather than reactive firefighting.
Prerequisites and Getting Started
To implement SAP monitoring with PRTG and Scansor sensors, you'll need:
- PRTG Network Monitor – Installed and configured in your environment
- Scansor SAP sensors – Available from itesys (starter pack is free)
- SAP monitoring user – Created with appropriate authorizations
- RFC connectivity – Network access from PRTG to SAP systems
- SAP Solution Manager (optional) – Can complement PRTG for certain use cases
The starter pack includes basic sensors like "SAP SysCheck.exe" and "SAP SysInfo.exe" that provide general system and SAP information. Extended monitoring capabilities are available through additional sensor packages.
Frequently Asked Questions
What SAP monitoring tools work best besides Solution Manager?
PRTG Network Monitor with Scansor sensors provides comprehensive SAP monitoring without the maintenance overhead of Solution Manager. It monitors SAP HANA, application servers, jobs, and business processes in real-time with automated alerting and customizable dashboards.
How can I track SAP system uptime and downtime data?
PRTG automatically logs all monitoring data with configurable retention periods. You can track system availability, generate uptime reports, and analyze historical performance trends. The Available.log on your SAP work directory also contains uptime/downtime records that can be correlated with PRTG data.
Can PRTG monitor both SAP and non-SAP systems?
Yes. PRTG is a unified monitoring platform that tracks your entire IT infrastructure—SAP systems, databases, servers, network devices, applications, and cloud services—all from a single interface. This eliminates the need for multiple monitoring tools that don't communicate with each other.
Conclusion: Proactive SAP Monitoring Prevents Costly Downtime
Effective SAP monitoring isn't just about knowing when something breaks—it's about detecting issues before they impact your business. With real-time visibility into your SAP HANA databases, application servers, jobs, and business processes, you can:
- Prevent downtime before users are affected
- Optimize performance based on actual metrics, not guesswork
- Troubleshoot faster with comprehensive diagnostics and root cause analysis
- Meet SLAs with automated reporting and alerting
- Plan capacity using historical data and trend analysis
Whether you're running SAP on-premise or in a hybrid cloud environment, comprehensive monitoring with PRTG gives you the observability you need to keep business-critical systems running smoothly.
Ready to see how PRTG can monitor your SAP environment? Explore monitoring with PRTG and download our 30-day trial today!
 Published by


