 Published by Paessler Editorial Team
Last updated on April 07, 2026
•
6 minute read
Most IT environments today are a mix. Windows servers in one rack, Linux boxes in another, maybe some Docker containers on top of that. For years, PRTG users in those environments had to get creative — Wine-based workarounds, clunky emulators, setups that technically worked but nobody wanted to maintain.

That's not the situation anymore. PRTG now has a native Linux solution, and it's actually good. Whether you want to monitor Linux servers from your existing PRTG setup or deploy a probe directly on a Linux machine, both are straightforward today.
This article covers how PRTG works on Linux, what you can monitor, which distros are supported, and how to get started.
Does PRTG Actually Run on Linux? Here's the Honest Answer
The short answer: yes and no, and the distinction matters.
The PRTG core server still requires Windows. That hasn't changed. But running PRTG on Linux used to mean Wine-based workarounds that were more proof-of-concept than anything you'd run in production.
Today it's different:
- The PRTG Multi-Platform Probe runs natively on Linux, no Wine or emulation involved
- The probe connects back to your Windows-based PRTG core server and monitors your environment independently
- You can deploy probes across multiple Linux machines, covering remote sites, segmented networks, or cloud environments
- The core server stays on Windows; everything else can be Linux
You don't need a Windows machine at every location. One Windows core server can manage probes running across your entire Linux infrastructure.
What Is the PRTG Multi-Platform Probe — and Why It Changes Everything
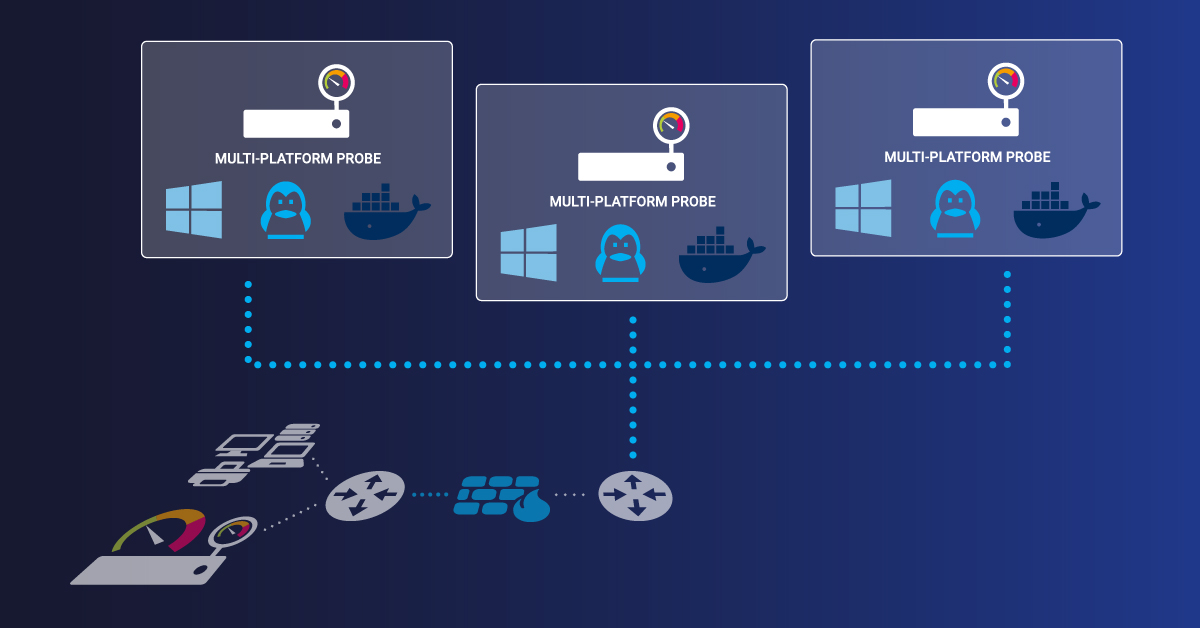
The Multi-Platform Probe is PRTG's native Linux agent, introduced in PRTG version 21.4.73. It's what makes real Linux monitoring possible without compromise.
A few things that set it apart from older probe approaches:
- Runs natively on Linux. No Windows dependency on the probe machine itself.
- Operates independently, monitors your environment, and sends results back to the PRTG core server
- Install it via your distro's package manager or spin it up as a Docker container
- Broad platform support: Ubuntu, Debian, RedHat, CentOS, Docker, ARM devices, Raspberry Pi
- Works with both PRTG Network Monitor and PRTG Hosted Monitor (cloud)
It's a fully autonomous monitoring outpost. You put it on a Linux machine, it keeps watch, and it reports back to your core. No local Windows environment needed.
Which Linux Distros and Environments Does PRTG Support?
One of the most common questions is whether PRTG will work on a specific setup. Here's the current supported platform list:
Linux Distributions:
- Ubuntu (LTS versions)
- Debian
- Red Hat Enterprise Linux (RHEL)
- CentOS
Container and Specialized Environments:
- Docker (container-based deployment)
- ARM-based devices
- Raspberry Pi
Deployment methods:
- APT package manager (Debian/Ubuntu)
- RPM package manager (RedHat/CentOS)
- Docker container pull
That covers a lot of ground — traditional on-prem Linux servers, containerized environments, and edge devices on ARM hardware. If you're running Ubuntu specifically, the complete PRTG Ubuntu installation guide walks through the full setup process.
What Can You Actually Monitor on Linux with PRTG?
Once the Multi-Platform Probe is running, you get solid visibility into your Linux systems. Here's what PRTG covers out of the box:
System Health:
- CPU usage and load averages
- Memory and swap utilization
- Disk space and I/O performance
- Running processes and services
Network and Traffic:
- Bandwidth usage per interface
- Network latency and packet loss
- SNMP-based device metrics
Custom and Advanced Monitoring:
- Custom sensors via Python scripts
- SSH-based monitoring for Linux-specific metrics
- Docker container health and resource usage
SNMP is one of the more reliable ways to pull system metrics from Linux servers, though it does require some setup on the Linux side. If you haven't done that yet, the guide to monitoring Linux system parameters via SNMP is worth reading before you start.
How to Get Started with PRTG on Linux — Fast
You don't need to overhaul your setup to get Linux monitoring running. Three steps:
Step 1 — Get the PRTG core server running on Windows
This is your central hub. Already running PRTG? You're good. Starting fresh? Download PRTG and get the core up first.
Step 2 — Deploy the Multi-Platform Probe on your Linux machine
Install via APT or RPM depending on your distro, or pull the Docker image. The probe registers with your core server once it's up.
Step 3 — Connect and start adding sensors
Once connected, add your Linux devices and sensors through the PRTG web interface. You'll have live data coming in pretty quickly.
The PRTG Multi-Platform Probe Setup Guide covers the full process in detail, including NATS server configuration. You can also get an overview of PRTG's Linux network monitoring capabilities on the Paessler website.
Is PRTG the Right Linux Monitoring Tool for Your Team?
PRTG isn't the only Linux monitoring option out there. But it stands out in a few specific situations.
It's a good fit if you:
- Already use PRTG for Windows or network monitoring and want to extend coverage to Linux
- Manage a mixed Windows and Linux environment and want everything in one place
- Need something that deploys quickly without a lot of custom scripting
- Want enterprise-grade monitoring without a steep learning curve
You might look elsewhere if you:
- Run a purely Linux-native stack and prefer open-source tools like Zabbix or Prometheus
- Need Linux as your core server platform — PRTG's core is still Windows-only
For most teams managing hybrid infrastructure, PRTG's combination of ease of use, broad sensor library, and native Linux probe support makes it worth a look. More on what's possible in PRTG's Linux monitoring overview.
Wrapping Up
Linux support in PRTG has come a long way. The Multi-Platform Probe gives you native Linux coverage, broad distro support, and the full PRTG sensor library, all managed from the same interface you're already using for Windows and network monitoring.
If you're running a mixed environment and want to stop treating Linux as the awkward exception, this is a reasonable place to start. Check out PRTG's Linux network monitoring capabilities or download PRTG and try it free.